

Abstract
Angelman syndrome (AS) is a neurogenetic disorder caused by loss of maternal UBE3A expression or mutation-induced dysfunction of its protein product, the E3 ubiquitin-protein ligase, UBE3A. In humans and rodents, UBE3A/Ube3a transcript is maternally imprinted in several brain regions, but the distribution of native UBE3A/Ube3a1 protein expression has not been comprehensively examined. To address this, we systematically evaluated Ube3a expression in the brain and peripheral tissues of wild-type (WT) and Ube3a maternal knockout mice (AS mice). Immunoblot and immunohistochemical analyses revealed a marked loss of Ube3a protein in hippocampus, hypothalamus, olfactory bulb, cerebral cortex, striatum, thalamus, midbrain, and cerebellum in AS mice relative to WT littermates. Also, Ube3a expression in heart and liver of AS mice showed greater than the predicted 50% reduction relative to WT mice. Co-localization studies showed Ube3a expression to be primarily neuronal in all brain regions and present in GABAergic interneurons as well as principal neurons. These findings suggest that neuronal function throughout the brain is compromised in AS.
Introduction
Angelman syndrome (AS) is a neurogenetic disorder associated with profound intellectual disability, severe language impairment, movement and balance disorder, epilepsy, and a unique behavioral profile with frequent laughter and smiling (Williams et al., 2006). AS results from a deficiency of functional UBE3A (also known as E6-associated protein or E6-AP), an E3 ubiquitin ligase encoded by the UBE3A gene1. UBE3A is an imprinted gene, (Knoll et al., 1989; Kishino et al., 1997; Matsuura et al., 1997; Sutcliffe et al., 1997), and most commonly, AS results from maternal deletions of varying size that include the UBE3A gene. Less common causes of AS are UBE3A mutations, uniparental paternal disomy (UPD), and imprinting center mutations (Laan et al., 1999; Williams et al., 2006). Although several Ube3a ubiquitination substrates have been described, none have been definitively linked to the pathogenesis of Angelman syndrome (Huibregtse et al., 1991; Kuhne and Banks, 1998; Nuber et al., 1998; Kumar et al., 1999; Reiter et al., 2006; Greer et al., 2010).
The first AS mouse model developed had partial UPD spanning the region including Ube3a on mouse chromosome 7, the region homologous to human chromosome 15 (Cattanach et al., 1997). In situ hybridization studies in these mice showed that Ube3a expression was undetectable in hippocampus and cerebellar Purkinje neurons, suggesting predominant maternal expression in these regions. In other regions including the cerebral cortex, Ube3a expression was moderately reduced, while in regions such as the anterior commissure and optic chiasm, expression was indistinguishable from wild-type (WT) controls, suggesting biallelic Ube3a expression (Albrecht et al., 1997). A subsequent AS mouse model was generated by an insertional mutation of exon II of the Ube3a gene passed through the maternal germline of Ube3a, a null mutation leading to loss of Ube3a expression. Based on in situ hybridization studies in these mice, monoallelic maternal Ube3a expression was proposed for only the hippocampus and cerebellar Purkinje neurons, while biallelic expression was demonstrated in the piriform cortex and suggested for other brain regions (Jiang et al., 1998). Another AS mouse model was generated by deletion of part of exon 15 and all of exon 16, a modification predicted to inactivate Ube3a ligase function (Miura et al., 2002). These mouse models were shown to recapitulate many of the phenotypic features of AS, including motor dysfunction, increased seizure susceptibility, and hippocampal-dependent learning and memory deficits (Jiang et al., 1998; Miura et al., 2002, Van Woerden et al., 2007).
Based on these models, AS research has focused mainly on the hippocampus and cerebellum, where Ube3a deficiency was thought to be the most pronounced. However, recent work using a YFP-Ube3a fusion protein reporter mouse demonstrated that maternal predominant expression of Ube3a may not be restricted to the hippocampus, cerebellum, and olfactory bulbs, as paternal YFP reporter expression was shown to be weakly detected in temporal cortex, and reported to have similar expression in other brain areas including thalamus (Dindot et al., 2008). Moreover, Yashiro and colleagues recently used immunohistochemistry and immunoblotting to show that there is minimal cortical expression of Ube3a in AS mice, indicating that Ube3a is nearly exclusively expressed from the maternal chromosome in WT mice throughout the cortex (Yashiro et al., 2009).
These results underscore a need for a more comprehensive understanding of Ube3a protein expression patterns to help direct future research into the pathogenesis and treatment of AS. Therefore, we compared Ube3a expression in the CNS and peripheral tissues of WT rodents and AS mice by immunoblotting and immunohistochemistry. We demonstrate that Ube3a expression is nearly exclusively maternal derived in all brain regions and is expressed in both principal neurons and GABAergic interneurons.
Materials and Methods
Mice and Tissue Preparation
All mice were maintained on C57/SV-129 mixed background. WT males (Ube3a M+/P+) were bred with AS females (Ube3a M−/P+) to generate WT and AS littermates. PCR analysis (described previously by Jiang et al., 1998) was performed on ear punches to genotype the offspring. Male and female mice were used in this analysis.
Brain tissue was prepared by decapitation and rapid removal of the brain onto ice. The appropriate brain regions were rapidly dissected and snap frozen on dry ice. The time from decapitation to freezing of the brain regions was less than 3 minutes. Peripheral tissues (heart, liver, and kidney) were also removed and snap frozen on dry ice. Tissue was stored at −80°C until use.
Western blot analysis
Tissues were homogenized in Kontes glass or Wheaton Teflon tissue grinders in a 2% sodium dodecyl sulfate (SDS) buffer containing 10 μg/ml leupeptin and 1 μg/ml pepstatin. A BCA protein assay was run on the homogenates which were then diluted to a final concentration of 0.7–1 mg/ml. Samples were heated at 60°C for 10 minutes and fractionated on SDS-polyacrylamide gel electrophoresis (PAGE). Proteins were transferred in 1X CAPS buffer onto nitrocellulose membranes. Membranes were stained with Ponceau-S and digitally scanned in order to compare total protein levels in each lane by densitometric scanning of the 50–116 kDa molecular weight range using ImageJ. Membranes were then blocked in 5% milk in Tris-Buffered Solution with Tween-20 (TTBS) at 4°C overnight. Membranes were then incubated with primary antibody, anti-mouse Ube3a (E6-AP) (Sigma-Aldrich clone 330 Cat#E8655) diluted 1:1000, anti-rabbit Ube3a (E6-AP) (Bethyl labs Cat# A300–352A) diluted 1:1000, anti-mouse β-actin (Santa Cruz Biotechnologies Cat#SC-47778) diluted at 1:2000, in 5% milk in TTBS overnight at 4°C. Membranes were washed 4X 10 minutes in TTBS, incubated with secondary antibody (goat anti-mouse IgG1-HRP (Santa Cruz Biotechnologies Cat#SC-2969) diluted 1:5000 or 1:3000) in 5% milk in TTBS for 1.5 hours, washed 4X 10 minutes in TTBS, and developed using Western Lighting Enhanced Luminol Reagent-Plus (Plus-ECL). X-ray films exposed in a linear range were quantified using ImageJ for densitometric analysis as described previously (Brown et al., 2005). Western blot signals were then normalized for variations in total protein loading in the corresponding lane, as quantified from Ponceau-S stained membranes (see above), thereby avoiding potential problems associated with quantifying a single protein for use as a loading control. For example, levels of β-actin varied approximately 2–fold in total tissue homogenates of micro-dissected brain regions (Supplementary Figure 4).
Immunohistochemistry/Immunocytochemistry
For immunohistochemistry, animals were deeply anesthetized and transcardially perfused with 0.1M PBS (pH 7.4) followed by 4% paraformaldehyde in PBS. Brains were removed and postfixed overnight, cryoprotected, and 40 μm coronal sections cut through the neuraxis.
Free-floating sections were washed in 50 mM Tris-buffered saline (TBS, pH 7.4) and then incubated for 20 min in 10 mM sodium citrate (pH 6.0) containing 0.05% Triton X-100 at 75–80°F. Sections were then processed for immunoperoxidase staining as previously described (Bubser and Deutch, 1999). Primary antibodies used include the mouse anti-Ube3a (E6-AP) (1:2000; Sigma-Aldrich clone 330), rabbit anti-parvalbumin (1:10,000; Swant), rabbit anti-calbindin (1:10,000; Swant), rabbit anti-calretinin (1:10,000; Swant), and rabbit anti-GFAP (1:2000; Chemicon).
For immunocytochemistry, primary hippocampal cultures were prepared from PND 0–1 Sprague-Dawley rat pups. Briefly, brains were removed and placed in ice-cold modified Hank’s balanced salt solution (HBSS). Hippocampi were dissected, cut into 3 mm cubes and incubated with 0.05% trypsin–EDTA in HBSS for 30 min at 37°C. After trypsin treatment, tissue blocks were triturated with HBSS with 10% horse serum, and dissociated cells were plated onto polyornithene coated plates or coverslips. The culture medium contained 500 mL Neurobasal, 10 ml B27, 0.5mM L-glutamine, and 25 μM penicillin/streptomycin. 4 μM AraC was added two times in the first week to reduce glial cell proliferation and cultures were maintained in a 5% CO2 incubator for 2–3 weeks. For immunostaining, cells were washed with cold PBS, and fixed in 3.7% formaldehyde, then blocked with 8% bovine serum albumin in PBS. Primary antibodies used were rabbit anti-PSD-95 diluted 1:500 (Invitrogen), mouse anti-Ube3a (E6-AP) diluted 1:1000 (Sigma-Aldrich clone 330), rabbit anti-Ube3a diluted 1:500 (Bethyl), and rabbit anti-synapsin diluted 1:1000 (Chemicon). Anti-rabbit or anti-mouse fluorescent secondary antibodies were used (Molecular Probes). Labeled cells were imaged using a Zeiss 510 confocal microscope. For overlay analysis, dendrites from 10 neurons in 5 separate cultures were examined using MetaMorph software (Molecular Devices).
Subcellular Fractionation
Hippocampal tissue was homogenized in Homogenization buffer (150 mM KCl, 50 mM Tris-HCl pH 7.5, mM DTT, 0.2 mM PMSF, 1 mM benzamidine, 1 μM pepstatin, 10 μg/ml leupeptin, and 1 μM microcystin-LR) using Wheaton Teflon or Kontes glass tissue grinders at 4°C. Total homogenate was rocked for 30 minutes at 4°C and spun down at 100,000 × g for 1 hour yielding an S1 fraction (soluble cytosolic protein pool) and a P1 pellet (insoluble fraction). P1 was resuspended in Homogenization buffer containing 1% (v/v) Triton X-100 using a Kontes, rounded tip cone pestle and rocked for 30 minutes at 4°C. The homogenate was then spun down at 9,000 × g for 10 minutes at 4°C yielding an S2 fraction (membrane-associated protein pool) and a P2 pellet (Triton insoluble fraction). The P2 was sonicated at 4°C in Homogenization buffer containing 1% (v/v) Triton X-100 and 1% (w/v) sodium deoxycholate and rocked for 30 minutes at 4°C. The homogenate was spun down at 9,000 x g for 10 minutes at 4°C yielding an S3 fraction (PSD-associated fraction) and a P3 pellet (Triton/Deoxycholate-insoluble fraction).
Statistics
Statistical comparisons were made by unpaired Student’s t-test, one sample t-test, or one-way ANOVA followed by Tukey’s post test, as appropriate.
Results
Ube3a protein expression is markedly reduced throughout the brain of AS mice
In order to probe for Ube3a protein levels in brain and peripheral tissues we first tested the specificity of two commercial antibodies to Ube3a. Using a mouse monoclonal Ube3a antibody (Sigma-Aldrich clone 330) we detected bands of the appropriate molecular weight for Ube3a, approximately 100 kDa in WT forebrain homogenate (Figure 1A, lane 1). Depending on electrophoresis conditions (e.g., the acrylamide concentration), up to three bands of Ube3a-immunoreactive protein could be resolved. These bands are specific for Ube3a as they were not detected in forebrain homogenates from the biallelic Ube3a knock-out (M−/P−) mouse (Figure 1A, lane 4). Comparison of whole forebrain extracts from WT, paternal deficient (M+/P−), AS (M−/P+), and biallelic knock-out (M−/P−) animals revealed a marked loss of Ube3a protein expression from AS compared to WT and M−/P+ mice, yet very low levels of Ube3a expression in AS mice were clearly evident with longer exposures (Figure 1A). In addition, we tested a Ube3a rabbit polyclonal antibody (Bethyl A300–352A) which also detected multiple closely migrating bands at approximately 100 kDa; however, this antibody was not as sensitive for Ube3a and also detected additional non-specific bands in whole forebrain and other tissues when tested in the biallelic Ube3a knock-out (M−/P−) mice (Supplementary Figure 1A). For these reasons, we chose to use the Sigma Ube3a antibody for all subsequent experiments
Figure 1.

Ube3a expression in brain is dramatically reduced in AS mice. A. Western blot analysis of total forebrain homogenates from WT (M+/P+), AS (M−/P+), UBE3A M+/P−, and UBE3A knockout (M−/P M−) mice shows a loss of Ube3a protein in AS mice compared to that of WT and AS mice when probing with the Sigma-Aldrich Ube3a antibody. Overexposure of the Western blot (bottom blot in A) reveals low levels of specific Ube3a staining in AS mice, as compared with the complete loss of expression in Ube3a knockout (M−/P −) mice. Arrows correspond to specific Ube3a staining that is not seen in M −/P − mice. B. Western blot analysis of total brain homogenates from hippocampus, striatum, hypothalamus, thalamus, cortex, cerebellum, midbrain, and olfactory bulbs reveals an estimated 90% loss of Ube3a expression in AS mice compared to WT mice (also see Supplementary Figure 3). C. Relative Ube3a expression across brain regions of WT mice quantified from Western blots in panel A, by normalizing to Ponceau-S total protein stain, shows the highest expression in the cortex, thalamus, and olfactory bulbs with lowest expression in the striatum. Animals: WT N=3, AS N=4.
As the original studies suggested that UBE3A transcript expression was imprinted in only a few brain regions (Albrect et al., 1997; Jiang et al., 1998), it was surprising that whole forebrains from AS mice appeared to contain such a low total level of Ube3a protein when compared to WT forebrains. In order to more precisely compare Ube3a protein levels in tissue samples, semi-quantitative western blotting methods were developed to detect Ube3a, based on methods established for other antigens (Brown et al., 2005, 2008). Pilot studies demonstrated that staining of nitrocellulose membranes with Ponceau-S allowed for linear normalization for total protein loading across a >10-fold range (Supplementary Figure 2A/B). Thus, normalization of Western blot signals to Ponceau-S staining intensity is an effective correction for variations in protein loading and electrophoretic transfer (typically <2-fold variation between samples). Under optimized conditions, the chemiluminscence detection of Ube3a Western blot signals on X-ray films was also linear over at least a 4-fold range (Supplementary Figure 2B). Ube3a protein levels in total homogenates of microdissected brain regions from WT and AS littermate mice were then compared. Ube3a is expressed throughout the brain of WT mice with a statistically significant 2.5-fold variation in the total levels between regions (one-way ANOVA, P=0.0017), with highest relative expression in cortex, thalamus, and olfactory bulbs (Figure 1B and C). A post-hoc Tukey’s multiple comparison test showed Ube3a expression in striatum was lower than in the thalamus (2.2–fold; P<0.05), cortex (2.2 fold; P<0.05), and olfactory bulbs (2.5 fold, P<0.01). Ube3a expression was also lower in the hypothalamus (1.7 fold; P<0.05) and the cerebellum (1.9 fold; P<0.05) when compared to the olfactory bulbs.
In comparison, there was a marked reduction of Ube3a expression in all brain regions assayed from AS mice (Figure 1B). Longer exposures of the Western blots revealed very low levels of Ube3a in all brain regions of the AS mice (Supplementary Figure 3); we estimate Ube3a levels to be reduced by >90% compared to WT animals in all brain regions. Similarly, Ube3a expression was detected in whole forebrain extracts from AS mice upon longer exposures (Figure 1A, bottom panel).
Immunohistochemical studies were performed to evaluate the extent and cell-type specificity of Ube3a expression throughout the brain. Using the same Sigma-Aldrich mouse monoclonal antibody, we observed Ube3a staining in WT mice across all brain regions. Strikingly, there was no detectable specific staining in brain tissue from AS mice (Figure 2). In WT brain tissue, the hippocampal Ube3a-like immunoreactivity (Ube3a-li) was seen in cells in the dentate gyrus and pyramidal cell layers, as well as in cells scattered throughout the stratum moleculare in a pattern typical of interneuron staining (Figure 3A). The relative intensity of Ube3a-li cellular staining varied somewhat across brain areas, suggesting that different neuronal subpopulations may express the protein to varying degrees. For instance, cells in the central and medial nuclei of the amygdala showed higher intensity staining than cells in the basolateral nucleus (Figure 3F), and cells in the substantia nigra pars compacta stained more intensely than cells in the pars reticulata (Figure 3G). Moreover, specific Ube3a-li cellular staining was absent in all brain regions of slices prepared from AS mice (Figure 2, Figure 3B).
Figure 2.

Ube3a-like immunoreactivity (Ube3a-li) is absent throughout the brain in AS mice. Coronal sections through cortex, hippocampus, thalamus, and brainstem are shown. Ube3a-li is seen in cells throughout the brain of WT mice (left), while no specific Ube3a-li is detected in the AS mouse brain (right). Scale bars are 2000 μm for the top panels and 250 μm for the magnified panels below.
Figure 3.

Distribution of Ube3a-like immunoreactivity (Ube3a-li) in the mouse brain. A. Dense Ube3a-li neurons are seen in the pyramidal cell layer and in scattered cells of the stratum oriens of the dorsal hippocampus from a WT mouse. B. No Ube3a-li elements are present in the dorsal hippocampus of the AS mouse. C. Ube3a-li cells are seen throughout the thalamus, with particularly dense staining seen in the cells of the paraventricular thalamic nucleus. D. In the somatosensory and other cortices, Ube3a-li cells can be seen in layers II-VI. E. Ube3a-li cells are seen through the dorsal striatum. F. Ube3a-li marks cells of the amygdala complex, with prominent staining seen in the central and especially medial nuclei, and what appears to be a somewhat lower density of cells in basolateral nucleus. G. Cells immunoreactive for Ube3a are present it the dorsal pons and overlying cerebellar cortex; in the pons, Ube3a-li cells can be seen in the locus ceruleus, parabrachial nucleus, and dorsal tegmental nucleus. H. Densely packed Ube3a-li cells in the substantia nigra and medially contiguous ventral tegmental nucleus are present, with fewer Ube3a-li cells seen in the pars reticulata. Scale bars are 500 μm C and 200 μm (F-H); the scale bar in G also applies to panels A, B, D, and E.
Ube3a is expressed in both principal and interneurons
The pattern of Ube3a-li in hippocampus was suggestive of expression in interneurons, so we co-stained with parvalbumin (PV) and calretinin (CR), markers of different interneuron types. Ube3a-li was expressed in the majority of PV-li neocortical interneurons (Figure 4A), as well as in brain regions where PV marks projection neurons, including the reticular nucleus of the thalamus (Figure 4C) and globus pallidus. In addition, CR-li and Ube3a-li colocalized to interneurons in the hippocampus (Figure 4B), and in the majority of CR-li interneurons in the neocortex. To confirm the cell type specificity of Ube3a expression, brain sections were co-stained with Ube3a and glial fibrillary acidic protein (GFAP), a glial cell marker. Ube3a-li was not observed in GFAP-positive cells, consistent with neuronal expression (Figure 4D). Under these experimental conditions, Ube3a-li was only detected in cell nuclei with no clear cytoplasmic staining observed (Figure 4A–D).
Figure 4.

Ube3a-li is present in interneurons but not astrocytes. A. In the neocortex some parvalbumin(PV)-li interneurons (brown) exhibiting nuclear labeling for Ube3a-li (arrow) are seen next to cells that are express only Ube3a-li (black) or parvalbumin (arrowhead) but not Ube3a. B. A calretinin-li cell expressing Ube3a-li (arrow) is seen dorsal to a dense band of Ube3a-li positive hippocampal dentate granule cells. C. In the thalamic reticular nucleus the great majority of cells show both PV- and Ube3a-li (arrow). D. Astrocytes, which express the GFAP-li (brown), do not express Ube3a-li (seen in black IR nuclei) in the hippocampus. Scale bars are 25 μm in panel C and 10 μm in panel D; the scale bar in panel D applies also to panels A and B.
Subcellular Ube3a expression profile
To evaluate the subcellular distribution of Ube3a expression more systematically, we performed additional immunocytochemical and subcellular fractionation studies. Initially, we performed immunocytochemical analysis in cultured rat hippocampal neurons. Ube3a-li was most intense in the nucleus, but was also seen throughout the soma and dendrites (Figure 5A). To evaluate Ube3a synaptic expression, cultured neurons were co-stained with synapsin or PSD-95 antibodies. The dendritic Ube3a-li partially overlapped with staining for synapsin, a presynaptic protein, and PSD-95, a postsynaptic protein. This pattern is suggestive for Ube3a expression both presynaptically and postsynaptically (Figure 5B).
Figure 5.

Subcellular Ube3a expression pattern in hippocampal neuron cultures. Ube3a is ubiquitously expressed throughout rat hippocampal neurons, with the most intense staining levels in the nucleus, but also with prominent staining in the cytoplasm and dendrites. A. Ube3a-li partially co-localizes with the presynaptic marker synapsin. B. Ube3a-li and PSD-95-li partially co-localize in dendrites of rat hippocampal neurons. Regions of co-localization are depicted in yellow. Scale bars are 20 μm for upper panels and 5 μm for lower panels.
To further examine the subcellular localization of Ube3a, subcellular fractions were isolated from WT mice. Our protocol yields an S1 fraction (soluble protein pool), S2 fraction (membrane-associated protein pool), S3 fraction (postsynaptic density (PSD)-associated pool), and a P3 pellet (insoluble fraction). Equal amounts of protein from each fraction were loaded into a 7.5% acrylamide gel for SDS-PAGE and Western blot analysis. The majority of Ube3a was detected in the S1 (soluble) pool where it co-fractionated with the cytosolic protein GAPDH. Lower levels of Ube3a co-fractionated with the IP3R, a marker for the endoplasmic reticulum, in the S2 (membrane-associated) pool (Figure 6). Ube3a was also detected in the S3 (PSD-associated) pool and P3 (insoluble) fraction, where the majority of PSD-95 fractionates (Figure 6). These data are consistent with a broad distribution of Ube3a throughout the cell, but with highest abundance in the soluble pool.
Figure 6.
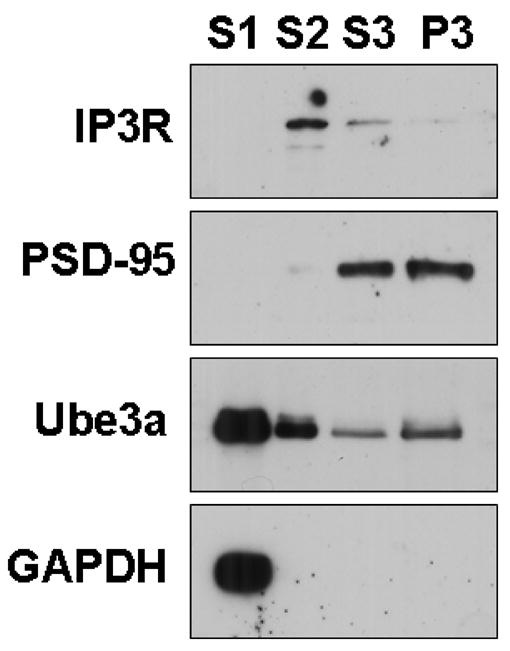
Ube3a localizes to multiple subcellular fractions. Subcellular fractionation and Western blot analysis of hippocampal homogenates shows Ube3a co-fractionates strongly with the cytoplasmic protein, GAPDH. Ube3a is co-fractionated to a lesser extent with the endoplasmic reticulum associated protein, IP3R (membrane-associated fraction), and with PSD-95 (postsynaptic density-associated fractions).
Maternal bias for Ube3a protein expression in peripheral tissues
Little is known about Ube3a expression in the periphery, or whether lack of peripheral maternal expression could contribute to associated symptoms in AS. To evaluate peripheral Ube3a expression, we compared Ube3a protein levels in total homogenates from heart, liver, and kidney of WT and AS mice. Ube3a was readily detected in WT tissues via Western blot (Figure 7), but levels in heart, liver, and kidney were reduced by 73±14%, 68±7%, and 64±18% respectively, relative to levels in WT tissues. If maternal and paternal alleles of a gene are expressed with equal efficiency, heterozygous knockout animals typically express ~50% of the WT protein levels. Therefore, we also tested whether total tissue levels in AS mice were significantly lower than the predicted 50% of WT levels. A one-sample t-test revealed that reductions in Ube3a expression levels in AS heart (P=0.006) and AS liver (P=0.01) were significantly greater than 50% of the WT. However, in kidney there was only a trend for the loss of Ube3a expression to be significantly greater than 50% of the WT (P=0.21).
Figure 7.

Ube3a expression in peripheral tissues is decreased in AS mice. Western blot analysis of total homogenates from heart, liver, and kidney of WT and AS mice demonstrates that Ube3a is expressed in these peripheral tissues. Quantification of Western blots (top row) were normalized to the Ponceau-S total protein stain and set as a percentage of WT (graphs below Western blots). Ube3a expression levels in heart, liver and kidney of AS mice are reduced by ≈70% compared to corresponding tissues from WT mice. Animals: WT N=3, AS N=4.
Discussion
We determined the Ube3a protein expression pattern in WT and AS mice using Western blot and immunohistochemical analysis. We initially tested two commercially available antibodies for specificity to Ube3a and chose to use the Sigma-Aldrich Ube3a (E6-AP) antibody, because the Bethyl Ube3a antibody detected proteins in a similar molecular weight range even in the biallelic Ube3a knockout (M−/P−) mouse. Nevertheless, we detected doublet or triplet banding patterns in several tissues probed with the Sigma antibody. Since the Ube3a gene encodes three different protein isoforms due to alternative splicing of 5′ exons (Yamamoto et al., 1997), the three bands detected by immunoblotting may represent Ube3a protein isoforms. In addition, post-translational modifications may contribute to the detection of multiple protein variants.
Until recently, it was widely accepted that Ube3a was maternally imprinted predominantly in hippocampus, cerebellum, and olfactory bulbs based on in situ hybridization data (Albrecht et al., 1997, Jiang et al., 1998). We have shown through immunoblotting and immunohistochemistry that maternal predominant Ube3a protein expression is not limited to these regions but instead occurs throughout the brain. These results highlight the importance of evaluating protein expression changes in addition to transcript levels. Our observations are consistent with previous RT-PCR results in human brain samples, where UBE3A transcript was expressed uniformly across the brain in controls, and was reduced to 10% of control levels in frontal cortex from AS brain (Rougeulle et al., 1997). Our data also validate recently reported observations made using an Ube3a-YFP reporter mouse in which selective expression of the maternally derived Ube3a-YFP transgene was not limited to hippocampus, cerebellum, and olfactory bulbs (Dindot et al., 2008). We note that imprinted Ube3a protein expression throughout the neocortex was also recently reported in AS mice (Yashiro et al., 2009). We significantly extend these findings by examining native Ube3a protein throughout all cortical and subcortical regions.
These results are perhaps not surprising given the phenotypic features in Angelman syndrome individuals. Movement and gait disorders suggest involvement off basal ganglia circuitry (Beckung et al., 2004), whereas EEG abnormalities, generalized seizure types, and sleep disturbances suggest dysfunction in thalamocortical circuits (Lossie et al., 2001; Miano et al., 2004; Colas et al., 2005). The marked impairment of expressive speech is consistent with impaired perisylvian cortical circuit development (Catani et al., 2005). Taken together, this suggests that Ube3a plays a fundamental role in most neurons and neuronal circuits. One such Ube3a role may be in the experience-dependent maturation of synapses and circuits as was demonstrated in the mouse visual cortex (Yashiro et al., 2009).
Using immunohistochemical and immunocytochemical techniques we showed that the Ube3a protein is expressed in both glutamatergic (e.g., cortical pyramidal neurons) and GABAergic interneurons (e.g., PV- and CR-immunoreactive interneurons). The expression of Ube3a in GABAergic interneurons, particularly in PV neurons in the reticular nucleus of the thalamus is intriguing. EEG abnormalities in Angelman patients almost invariably include paroxysms of rhythmic diffuse high amplitude slowing. These patterns are highly suggestive of thalamocortical dysregulation for which GABAergic interneurons in the thalamus may play a critical role (Huguenard et al., 2007).
We showed that Ube3a is broadly distributed within cells, suggesting multiple functional roles. The immunohistochemical data indicated primarily nuclear staining, and it has been proposed that Ube3a plays an important role as a transcription factor (Ramamoorthy et al., 2008). A more detailed analysis using cultured hippocampal neurons showed that while the highest intensity staining is nuclear, Ube3a is expressed throughout neurons, with prominent staining in the soma and dendrites. Differences in the relative detection of extranuclear pools of Ube3a in cultured neurons and in brain slices may reflect procedural differences between these analyses, such as fixation conditions or the use of different secondary antibodies coupled to fluorescent probes for direct visualization or to biotin for amplified colorimetric detection using streptavidin-peroxidase. Alternatively, the antibody epitope in extranuclear pools of Ube3a in brain slices from adult animals may be shielded by association with other proteins that are expressed at lower levels in the neuronal cultures. However, Western blotting of subcellular fractionation detected smaller amounts of Ube3a in membrane associated and postsynaptic density associated fractions, consistent with the staining of cultured neurons. Similar to our results, Dindot and colleagues recently showed that the transgenic Ube3a-YFP reporter protein co-localizes with both presynaptic and postsynaptic markers (Dindot et al, 2008). Thus, the pool of synaptic Ube3a might affect local synaptic protein degradation to modulate intracellular processes that play key roles in synaptic plasticity (Weeber et al., 2003; van Woerden et al., 2007; Greer et al., 2010). It will also be important to see if Ube3a subcellular localization changes in response to neuronal activity.
Heterozygote animals typically express most genes/proteins at 50% of WT levels if both alleles are equally active. We found that Ube3a is substantially expressed in several peripheral tissues in WT mice, but that the levels are reduced by 64–73% in the heterozygous (M−/P+) AS mice, significantly lower than the predicted 50% expression level. We also note that there is still a very low level of Ube3a protein expression in all brain regions tested from AS mice. This is consistent with the finding that AS mice and biallelic Ube3a knockout mice have separable phenotypes based on behavioral testing (Heck et al., 2008). Earlier studies showed biallelic human UBE3A expression in heart and kidney, as well as in lymphocytes and fibroblast cultures, but did not quantitatively address the extent of UBE3A loss in peripheral tissues in AS (Nakao et al., 1994; Rougeulle et al., 1997; Vu and Hoffman, 1997). However, a more recent study found preferential UBE3A transcript expression from the maternal allele in human fibroblasts (Herzing et al, 2002). While the clinical significance of reduced Ube3a protein expression in peripheral tissues of AS mice is unclear, AS individuals frequently have disturbances in gastrointestinal function (Laan et al., 1999; Williams et al., 2005). Thus, it will be important to learn if UBE3A deficiency in peripheral tissues is linked to these adverse symptoms.
Determining mechanisms involved in Ube3a imprinting has been critical in the understanding of AS (Chamberlain et al., 2001; Herzig et al., 2002; Tsai et al., 2002; Le Meur et al., 2005; Regha et al., 2006; Horsthemke and Wagstaff 2008; Ideraabdullah et al., 2008; Koerner et al., 2009). Taken together, the present data indicate that Ube3a expression from the paternal chromosome is suppressed to varying degrees in different tissues. There are at least two possible explanations of these data. First, genomic modification(s) that give rise to imprinting provide for graded levels of expression rather than an “all or none” effect. Second, since the tissues sampled contain multiple cell types, paternal Ube3a expression could be completely suppressed in some cells, but not affected in others. Our immunohistochemical studies of the CNS provide no evidence of a limited number of cells expressing normal levels of Ube3a in the AS mice (Figure 2 and 3). Moreover, heart and liver contain a preponderance of myocytes and hepatocytes, respectively, and more limited numbers of other cell types. Thus, we favor the idea that genomic imprinting can result in graded expression from one allele, apparently in a cell-dependent manner. It will be important to compare mechanisms for gene silencing in neurons and peripheral tissues, particularly with respect to the roles of changes in chromatin conformation and the Ube3a antisense transcript. In addition, the degree of paternal Ube3a expression should be closely examined for changes across development and in response to activity. This could be readily done using the Ube3a-YFP mouse developed by Dindot and colleagues (Dindot et al, 2008). Such studies may suggest approaches to activate UBE3A expression from the paternal chromosome in the brain of AS patients to compensate for the loss of maternal expression.
In summary, we have shown that there is global and strong suppression of Ube3a protein expression in the brain of the AS mouse. This provides a foundation for future studies to examine how deficits in Ube3a expression underlie the diverse symptoms of AS that include movement disorders, refractory generalized epilepsy, severe expressive language impairment, and sleep disturbances that almost certainly involve circuits outside of the hippocampus and cerebellum. Moreover, developing treatments for AS should include consideration of the potential role of peripheral Ube3a deficits and determining means of compensating for the loss of Ube3a throughout the brain.
Supplementary Material
Comparison of Sigma-Aldrich (E8655) verses Bethyl (A300-352A) Ube3a antibodies. A. Western blot analysis of total forebrain homogenates from WT, AS, and Ube3a knock-out (KO) mice. Increasing exposure time reveals a non-specific band detected in Ube3a KO forebrain homogenate using the Bethyl Ube3a antibody (red arrow). There are no non-specific bands detected with the Sigma-Aldrich Ube3a antibody. Total homogenates of heart, liver, and kidney from WT, AS, and KO mice were also probed with both Sigma-Aldrich and Bethyl Ube3a antibodies. Total homogenates from the liver and kidney of KO mice probed with the Bethyl Ube3a antibody revealed non-specific banding patterns (red arrows). No non-specific bands were detected using the Sigma-Aldrich Ube3a antibody in the peripheral tissues tested. B. Immunocytochemical analysis of Ube3a-li immunoreactivity in cultured rat hippocampal neurons revealed a similar staining pattern with both the Sigma-Aldrich and Bethyl antibodies. Scale bars are 20 μm in each image.
Demonstration of the linearity of western blot quantification normalizing to Ponceau-S total protein stain. A. Quantification of 10-fold and 100-fold dilutions of a total hippocampal homogenate demonstrate the linear range when using Ponceau-S total protein stain of nitrocellulose membranes. Note that a log scale is used for the y axis. N=4 replicates of each dilution. B. Increasing volumes of a total hippocampal homogenate were transferred to nitrocellulose membranes, stained for total protein using Ponceau-S and western blotted for Ube3a. Both the Ponceau-S stain and the Ube3a blot demonstrate near linearity across the 4-fold range of sample loading. N=3 replicates of each volume loaded.
Ube3a protein can be detected at low levels in AS brain tissue homogenates. Overexposure of the Western blot in Figure 1B revealed low level Ube3a protein expression in AS mice from all brain regions assayed.
Western blot analysis is done by normalizing to Ponceau-S total protein stain. The upper panel shows Ponceau-S total protein stain of WT mouse total homogenate from hippocampus (Hp), striatum (St), hypothalamus (Hy), thalamus (Th), cortex (Cx), cerebellum (Cb), midbrain (Mb), and olfactory bulbs (Ob). Lower panels show Western blot of Ube3a and β-Actin. The variable expression of β-Actin across brain regions makes it an unreliable protein when attempting to normalize for protein loading.
Acknowledgments
The mice to start the AS colony were a kind gift from Dr. Art Beaudet at Baylor College of Medicine in Houston, TX. This research was supported by an NRSA (1 F31 NS061537) to R.M.G, a Vanderbilt Kennedy Center Hobbs Discovery Grant to R.J.C., an Angelman Syndrome Foundation grant to E.J.W., and NS048882 to K.F.H.
Footnotes
Throughout the manuscript, following the standard nomenclature, UBE3A and UBE3A will denote the human gene and protein name, respectively, and Ube3a and Ube3a the rodent gene and protein name, respectively. As indicated here, UBE3A and Ube3a are synonymous with E6-AP.
Publisher's Disclaimer: This is a PDF file of an unedited manuscript that has been accepted for publication. As a service to our customers we are providing this early version of the manuscript. The manuscript will undergo copyediting, typesetting, and review of the resulting proof before it is published in its final citable form. Please note that during the production process errors may be discovered which could affect the content, and all legal disclaimers that apply to the journal pertain.
References
- Albrecht U, Sutcliffe JS, Cattanach BM, Beechey CV, Armstrong D, Eichele G, Beaudet AL. Imprinted expression of the murine Angelman syndrome gene, Ube3a, in hippocampal and Purkinje neurons. Nat Genet. 1997;17:75–78. doi: 10.1038/ng0997-75. [DOI] [PubMed] [Google Scholar]
- Beckung E, Steffenburg S, Kyllerman M. Motor impairments, neurological signs, and developmental level in individuals with Angelman syndrome. Dev Med Child Neurol. 2004;46:239–243. doi: 10.1017/s0012162204000398. [DOI] [PubMed] [Google Scholar]
- Brown AM, Deutch AY, Colbran RJ. Dopamine depletion alters phosphorylation of striatal proteins in a model of Parkinsonism. Eur J Neurosci. 2005;22:247–256. doi: 10.1111/j.1460-9568.2005.04190.x. [DOI] [PMC free article] [PubMed] [Google Scholar]
- Bubser M, Deutch AY. Stress induces Fos expression in neurons of the thalamic paraventricular nucleus that innervate limbic forebrain sites. Synapse. 1999;32:13–22. doi: 10.1002/(SICI)1098-2396(199904)32:1<13::AID-SYN2>3.0.CO;2-R. [DOI] [PubMed] [Google Scholar]
- Cattanach BM, Barr JA, Beechey CV, Martin J, Noebels J, Jones J. A candidate model for Angelman syndrome in the mouse. Mamm Genome. 1997;8:472–478. doi: 10.1007/s003359900479. [DOI] [PubMed] [Google Scholar]
- Cattani M, Jones DK, ffytche DH. Perislyvian language networks of the human brain. Ann Neurol. 2005;57:8–16. doi: 10.1002/ana.20319. [DOI] [PubMed] [Google Scholar]
- Chamberlain SJ, Brannan CI. The Prader-Willi syndrome imprinting center activates the paternally expressed murine Ube3a antisense transcript but represses paternal Ube3a. Genomics. 2001;73:316–322. doi: 10.1006/geno.2001.6543. [DOI] [PubMed] [Google Scholar]
- Colas D, Wagstaff J, Fort P, Salvert D, Sarda N. Sleep disturbances in Ube3a maternal-deficient mice modeling Angelman syndrome. Neurobiol Dis. 2005;20:471–478. doi: 10.1016/j.nbd.2005.04.003. [DOI] [PubMed] [Google Scholar]
- Dindot SV, Antalffy BA, Bhattacharjee MB, Beaudet AL. The Angelman syndrome ubiquitin ligase localizes to the synapse and nucleus, and maternal deficiency results in abnormal dendritic spine morphology. Hum Mol Genet. 2008;17:111–118. doi: 10.1093/hmg/ddm288. [DOI] [PubMed] [Google Scholar]
- Greer PL, Hanayama R, Bloodgood BL, Mardinly AR, Lipton DM, Flavell SW, Kim T, Griffith EC, Waldon Z, Maehr R, Ploegh HL, Chowdhury S, Worley PF, Steen J, Greenberg ME. The Angelman syndrome protein Ube3A regulates synapse development by ubiquitinating Arc. Cell. 2010;140:704–716. doi: 10.1016/j.cell.2010.01.026. [DOI] [PMC free article] [PubMed] [Google Scholar]
- Heck D, Zhao Y, Roy S, LeDoux MS, Reiter LT. Analysis of cerebellar function in Ube3a deficient mice reveals novel genotype specific behaviors. Hum Mol Genet. 2008;17:2181–2189. doi: 10.1093/hmg/ddn117. [DOI] [PMC free article] [PubMed] [Google Scholar]
- Herzing LB, Cook EH, Jr, Ledbetter DH. Allele-specific expression analysis by RNA-FISH demonstrates preferential maternal expression of UBE3A and imprint maintenance within 15q11–q13 duplications. Hum Mol Genet. 2002;11:1707–1718. doi: 10.1093/hmg/11.15.1707. [DOI] [PubMed] [Google Scholar]
- Horsthemke B, Wagstaff J. Mechanisms of imprinting of the Prader-Willi/Angelman region. Am J Med Genet A. 2008;146A:2041–2052. doi: 10.1002/ajmg.a.32364. [DOI] [PubMed] [Google Scholar]
- Huguenard JR, McCormick DA. Thalamic synchrony and dynamic regulation of global forebrain oscillations. TINS. 30:350–356. doi: 10.1016/j.tins.2007.05.007. [DOI] [PubMed] [Google Scholar]
- Huibregtse JM, Scheffner M, Howley PM. A cellular protein mediates association of p53 with the E6 oncoprotein of human papillomavirus types 16 or 18. Embo J. 1991;10:4129–4135. doi: 10.1002/j.1460-2075.1991.tb04990.x. [DOI] [PMC free article] [PubMed] [Google Scholar]
- Ideraabdullah FY, Vigneau S, Bartolomei MS. Genomic imprinting mechanisms in mammals. Mutat Res. 2008;647:77–85. doi: 10.1016/j.mrfmmm.2008.08.008. [DOI] [PMC free article] [PubMed] [Google Scholar]
- Jiang YH, Armstrong D, Albrecht U, Atkins CM, Noebels JL, Eichele G, Sweatt JD, Beaudet AL. Mutation of the Angelman ubiquitin ligase in mice causes increased cytoplasmic p53 and deficits of contextual learning and long-term potentiation. Neuron. 1998;21:799–811. doi: 10.1016/s0896-6273(00)80596-6. [DOI] [PubMed] [Google Scholar]
- Kishino T, Lalande M, Wagstaff J. UBE3A/E6-AP mutations cause Angelman syndrome. Nat Genet. 1997;15:70–73. doi: 10.1038/ng0197-70. [DOI] [PubMed] [Google Scholar]
- Knoll JH, Nicholls RD, Magenis RE, Graham JM, Jr, Lalande M, Latt SA. Angelman and Prader-Willi syndromes share a common chromosome 15 deletion but differ in parental origin of the deletion. Am J Med Genet. 1989;32:285–290. doi: 10.1002/ajmg.1320320235. [DOI] [PubMed] [Google Scholar]
- Koerner MV, Pauler FM, Huang R, Barlow DP. The function of non-coding RNAs in genomic imprinting. Development. 2009;136:1771–1783. doi: 10.1242/dev.030403. [DOI] [PMC free article] [PubMed] [Google Scholar]
- Kuhne C, Banks L. E3-ubiquitin ligase/E6-AP links multicopy maintenance protein 7 to the ubiquitination pathway by a novel motif, the L2G box. J Biol Chem. 1998;273:34302–34309. doi: 10.1074/jbc.273.51.34302. [DOI] [PubMed] [Google Scholar]
- Kumar S, Talis AL, Howley PM. Identification of HHR23A as a substrate for E6-associated protein-mediated ubiquitination. J Biol Chem. 1999;274:18785–18792. doi: 10.1074/jbc.274.26.18785. [DOI] [PubMed] [Google Scholar]
- Laan LA, Haeringen Av, Brouwer OF. Angelman syndrome: a review of clinical and genetic aspects. Clin Neurol Neurosurg. 1999;101:161–170. doi: 10.1016/s0303-8467(99)00030-x. [DOI] [PubMed] [Google Scholar]
- Le Meur E, Watrin F, Landers M, Sturny R, Lalande M, Muscatelli F. Dynamic developmental regulation of the large non-coding RNA associated with the mouse 7C imprinted chromosomal region. Dev Biol. 2005;286:587–600. doi: 10.1016/j.ydbio.2005.07.030. [DOI] [PubMed] [Google Scholar]
- Lossie AC, Whitney MM, Amidon D, Dong HJ, Chen P, Theriaque D, Hutson A, Nicholls RD, Zori RT, Williams CA, Driscoll DJ. Distinct phenotypes distinguish the molecular classes of Angelman syndrome. J Med Genet. 2001;38:834–845. doi: 10.1136/jmg.38.12.834. [DOI] [PMC free article] [PubMed] [Google Scholar]
- Matsuura T, Sutcliffe JS, Fang P, Galjaard RJ, Jiang YH, Benton CS, Rommens JM, Beaudet AL. De novo truncating mutations in E6-AP ubiquitin-protein ligase gene (UBE3A) in Angelman syndrome. Nat Genet. 1997;15:74–77. doi: 10.1038/ng0197-74. [DOI] [PubMed] [Google Scholar]
- Miano S, Bruni O, Elia M, Musumeci SA, Verrillo E, Ferri R. Sleep breathing and periodic leg movement pattern in Angelman Syndrome: a polysomnographic study. Clin Neurophysiol. 2005;116:2685–2692. doi: 10.1016/j.clinph.2005.08.005. [DOI] [PubMed] [Google Scholar]
- Miura K, Kishino T, Li E, Webber H, Dikkes P, Holmes GL, Wagstaff J. Neurobehavioral and electroencephalographic abnormalities in Ube3a maternal-deficient mice. Neurobiol Dis. 2002;9:149–159. doi: 10.1006/nbdi.2001.0463. [DOI] [PubMed] [Google Scholar]
- Nakao M, Sutcliffe JS, Durtschi B, Mutirangura A, Ledbetter DH, Beaudet AL. Imprinting analysis of three genes in the Prader-Willi/Angelman region: SNRPN, E6-associated protein, and PAR-2 (D15S225E) Hum Mol Genet. 1994;3:309–315. doi: 10.1093/hmg/3.2.309. [DOI] [PubMed] [Google Scholar]
- Nuber U, Schwarz SE, Scheffner M. The ubiquitin-protein ligase E6-associated protein (E6-AP) serves as its own substrate. Eur J Biochem. 1998;254:643–649. doi: 10.1046/j.1432-1327.1998.2540643.x. [DOI] [PubMed] [Google Scholar]
- Ramamoorthy S, Nawaz Z. E6-associated protein (E6-AP) is a dual function coactivator of steroid hormone receptors. Nucl Recept Signal. 2008;6:e006. doi: 10.1621/nrs.06006. [DOI] [PMC free article] [PubMed] [Google Scholar]
- Regha K, Latos PA, Spahn L. The imprinted mouse Igf2r/Air cluster--a model maternal imprinting system. Cytogenet Genome Res. 2006;113:165–177. doi: 10.1159/000090829. [DOI] [PubMed] [Google Scholar]
- Reiter LT, Seagroves TN, Bowers M, Bier E. Expression of the Rho-GEF Pbl/ECT2 is regulated by the UBE3A E3 ubiquitin ligase. Hum Mol Genet. 2006;15:2825–2835. doi: 10.1093/hmg/ddl225. [DOI] [PMC free article] [PubMed] [Google Scholar]
- Rougeulle C, Glatt H, Lalande M. The Angelman syndrome candidate gene, UBE3A/E6-AP, is imprinted in brain. Nat Genet. 1997;17:14–15. doi: 10.1038/ng0997-14. [DOI] [PubMed] [Google Scholar]
- Sutcliffe JS, Jiang YH, Galijaard RJ, Matsuura T, Fang P, Kubota T, Christian SL, Bressler J, Cattanach B, Ledbetter DH, Beaudet AL. The E6-Ap ubiquitin-protein ligase (UBE3A) gene is localized within a narrowed Angelman syndrome critical region. Genome Res. 1997;7:368–377. doi: 10.1101/gr.7.4.368. [DOI] [PMC free article] [PubMed] [Google Scholar]
- Tsai TF, Chen KS, Weber JS, Justice MJ, Beaudet AL. Evidence for translational regulation of the imprinted Snurf-Snrpn locus in mice. Hum Mol Genet. 2002;11:1659–1668. doi: 10.1093/hmg/11.14.1659. [DOI] [PubMed] [Google Scholar]
- van Woerden GM, Harris KD, Hojjati MR, Gustin RM, Qiu S, de Avila Freire R, Jiang YH, Elgersma Y, Weeber EJ. Rescue of neurological deficits in a mouse model for Angelman syndrome by reduction of alphaCaMKII inhibitory phosphorylation. Nat Neurosci. 2007;10:280–282. doi: 10.1038/nn1845. [DOI] [PubMed] [Google Scholar]
- Vu TH, Hoffman AR. Imprinting of the Angelman syndrome gene, UBE3A, is restricted to brain. Nat Genet. 1997;17:12–13. doi: 10.1038/ng0997-12. [DOI] [PubMed] [Google Scholar]
- Weeber EJ, Jiang Y, Elgersma Y, Varga AW, Carrasquillo Y, Brown SE, Christian JM, Mirnikjoo B, Silva A, Beaudet AL, Sweatt JD. Derangements of hippocampal calcium/calmodulin-dependent protein kinase II in a mouse model for Angelman mental retardation syndrome. J Neurosci. 2003;23(7):2634–2644. doi: 10.1523/JNEUROSCI.23-07-02634.2003. [DOI] [PMC free article] [PubMed] [Google Scholar]
- Williams CA, Beaudet AL, Clayton-Smith J, Knoll JH, Kyllerman M, Laan LA, Magenis RE, Moncla A, Schinzel AA, Summers JA, Wagstaff J. Angelman syndrome 2005: updated consensus for diagnostic criteria. Am J Med Genet A. 2006;140:413–418. doi: 10.1002/ajmg.a.31074. [DOI] [PubMed] [Google Scholar]
- Yamamoto Y, Huibregtse JM, Howley PM. The human E6-AP gene (UBE3A) encodes three potential protein isoforms generated by differential splicing. Genomics. 1997;41:263–266. doi: 10.1006/geno.1997.4617. [DOI] [PubMed] [Google Scholar]
- Yashiro K, Riday TT, Condon KH, Roberts AC, Bernardo DR, Prakash R, Weinberg RJ, Ehlers MD, Philpot BD. Ube3a is required for experience-dependent maturation of the neocortex. Nat Neurosci. 2009;12:777–783. doi: 10.1038/nn.2327. [DOI] [PMC free article] [PubMed] [Google Scholar]
Associated Data
This section collects any data citations, data availability statements, or supplementary materials included in this article.
Supplementary Materials
Comparison of Sigma-Aldrich (E8655) verses Bethyl (A300-352A) Ube3a antibodies. A. Western blot analysis of total forebrain homogenates from WT, AS, and Ube3a knock-out (KO) mice. Increasing exposure time reveals a non-specific band detected in Ube3a KO forebrain homogenate using the Bethyl Ube3a antibody (red arrow). There are no non-specific bands detected with the Sigma-Aldrich Ube3a antibody. Total homogenates of heart, liver, and kidney from WT, AS, and KO mice were also probed with both Sigma-Aldrich and Bethyl Ube3a antibodies. Total homogenates from the liver and kidney of KO mice probed with the Bethyl Ube3a antibody revealed non-specific banding patterns (red arrows). No non-specific bands were detected using the Sigma-Aldrich Ube3a antibody in the peripheral tissues tested. B. Immunocytochemical analysis of Ube3a-li immunoreactivity in cultured rat hippocampal neurons revealed a similar staining pattern with both the Sigma-Aldrich and Bethyl antibodies. Scale bars are 20 μm in each image.
Demonstration of the linearity of western blot quantification normalizing to Ponceau-S total protein stain. A. Quantification of 10-fold and 100-fold dilutions of a total hippocampal homogenate demonstrate the linear range when using Ponceau-S total protein stain of nitrocellulose membranes. Note that a log scale is used for the y axis. N=4 replicates of each dilution. B. Increasing volumes of a total hippocampal homogenate were transferred to nitrocellulose membranes, stained for total protein using Ponceau-S and western blotted for Ube3a. Both the Ponceau-S stain and the Ube3a blot demonstrate near linearity across the 4-fold range of sample loading. N=3 replicates of each volume loaded.
Ube3a protein can be detected at low levels in AS brain tissue homogenates. Overexposure of the Western blot in Figure 1B revealed low level Ube3a protein expression in AS mice from all brain regions assayed.
Western blot analysis is done by normalizing to Ponceau-S total protein stain. The upper panel shows Ponceau-S total protein stain of WT mouse total homogenate from hippocampus (Hp), striatum (St), hypothalamus (Hy), thalamus (Th), cortex (Cx), cerebellum (Cb), midbrain (Mb), and olfactory bulbs (Ob). Lower panels show Western blot of Ube3a and β-Actin. The variable expression of β-Actin across brain regions makes it an unreliable protein when attempting to normalize for protein loading.