

Abstract
We investigated whether humans use a target’s remembered location to plan reaching movements to targets according to the relative reliabilities of visual and remembered information. Using their index finger, subjects moved a virtual object from one side of a table to the other, and then went back to a target. In some trials, the target shifted unnoticed while the finger made the first movement. We regressed subjects’ movement trajectories against the initial and shifted target locations to infer the weights that subjects gave to remembered and visual location. We measured the reliability of vision and memory by adding conditions in which the target only appeared after subjects made the first movement (vision-only) and in which the target was initially present, but disappeared during the first movement (memory-only). When both visual and remembered information were available, movement trajectories were biased to the remembered target location. The different weights that subjects gave to memory and visual information on average matched the weights predicted by the variance associated with the use of vision and memory alone. This suggests that humans integrate remembered information about object locations with peripheral visual information by taking into account the relative reliability of the two sources of information.
Keywords: visuo-motor, memory, localization, arm movement, cue integration, statistically optimal, periphery, pointing
Introduction
Two principle sources of information about objects in the world are available to the brain for planning goal-directed hand movements – visual information present at the time of planning and remembered information from previous fixations on or close to an object. Recent research has de-emphasized the potential role of memory in motor planning, suggesting that the brain uses only visual information to plan hand movements because the eyes can be directed anywhere to access needed information (O’Regan, 1992; Rensink, 2000). This accords with the qualitative observation that in several visuo-motor tasks people seem to prefer making many eye movements over relying on memory (Ballard, Hayhoe & Pelz, 1995; Gajewski & Henderson, 2005).
Disregarding memorized information would be sensible if this information were limited and unreliable. Several researchers have argued that the visual system cannot retain detailed visual information across saccades and has special difficulties with absolute spatial positions (Irwin, 1991; Henderson & Hollingworth, 1999; Henderson & Hollingworth, 2003; O’Regan, 1992). The argument is mainly based on studies in which subjects failed to detect differences between images when an intervening saccade is made or a blank is presented between the images (Irwin, 1991; McConkie & Currie, 1996; Rensink, O’Regan & Clark, 1997). To the extent that the brain stores information about objects in short-term visual memory, the reliability of this information is limited in part by the capacity limitations on short-term memory (Luck & Vogel, 1997; Henderson & Hollingworth, 1999) and by the fact that remembered information is old and in a changing world sometimes not correct anymore. The lower quality of memorized target location information is likely one of the reasons why hand movements toward remembered targets are less precise than toward visual targets (Binsted, Rolheiser & Chua, 2006; Elliott & Calvert, 1992; Heath, Westwood & Binsted, 2004; Lemay & Proteau, 2001).
That the brain does not maintain a rich mnemonic representation of scenes is now widely accepted; however, the brain may use visual short-term memory in a more directed, task-specific manner to help guide reaching movements. A close look at eye-hand coordination patterns suggests a possible role for memory. Often, the hand starts to move to the target before the eyes, or very shortly afterwards (Abrams, Meyer & Kornblum, 1990; Aivar, Hayhoe, Chizk & Mruczek, 2005; Binsted & Elliott, 1999; Carnahan & Marteniuk, 1991; 1994; Pelz, Hayhoe & Loeber, 2001). Thus, while the fact that gaze almost always arrives at a target before the hand (Binsted, Chua, Helsen & Elliott, 2001; Flanagan & Johansson, 2003; Neggers & Bekkering, 2000) indicates that visual information is very important for online control of hand movements, eye movements do not seem to be optimized for gathering visual target information for the planning of the movement. In many situations, the only visual information that is available to the brain for planning the hand movement is peripheral and thus of low quality (Burbeck & Yap, 1990; Whitaker & Latham, 1997). In such cases, remembered information about a target object’s location, orientation and shape gathered during previous fixations close to the target could be useful.
We have recently found that in a sequential movement task subjects integrated remembered information about object locations gained in previous fixations with peripheral visual information for planning goal directed movements (Brouwer & Knill, 2007). In all of the conditions tested in that study, subjects gave some “weight” to both remembered target locations and to peripheral visual information, where the relative contribution of memory to planning depended on the quality of the available peripheral visual information. These findings suggest a continuous model of how visual short-term memory contributes to motor planning in which the contribution of remembered information depends on its reliability relative to the immediately available visual information at the time of planning. The current paper applies the frame-work of statistical estimation to test whether humans optimally integrate remembered and visual information about object location as a function of the relative reliability of the two sources of information. Such a demonstration would support building models that condition the contribution of visual short-term memory to specific tasks on objective analyses of remembered and immediately available visual information for the tasks.
Background and preliminaries
In the perceptual domain, studies have shown that the brain integrates different sensory cues about object properties in a (close to) statistically optimal way: the contribution of each of the cues to the final, combined estimate of the property is such that the uncertainty of this estimate is as low as possible (Alais & Burr, 2004; Ernst & Banks, 2002; Gepshtein & Banks, 2003; Hillis et al., 2004; Knill & Saunders, 2003; Landy & Kojima, 2001). Memory of an object’s location at previous fixations and ‘current’ peripheral visual information about the object can be considered as two cues that inform an observer or actor about the location of the object in space. Assuming that the uncertainty associated with each cue can be approximated as a Gaussian distribution in space, an optimal integrator would estimate the location of an object as a weighted sum of the remembered location and its best estimate of location from the available, peripheral visual information. In the simplified case in which position is specified along only one dimension, we can write the optimal estimate of location as
| (1) |
where is the observer’s remembered location (the observer’s best estimate from memory), is the observer’s best estimate of location from the available visual information and is the observer’s best, final estimate of location (note that from here onwards, with ‘perceived’ we mean that which is estimated by the observer, possibly using both visual and memorized information). Rmemory and Rvision are the reliabilities of the two location estimates, expressed as the inverses of the variances of the Gaussian distributions representing the uncertainties associated with the estimates
| (2) |
Equation (1) can be re-written as a weighted linear sum of location estimates from the two “cues”
| (3) |
where the weights are given by
| (4) |
These weights characterize an ideal integrator. Human observers may be suboptimal, in which case, the weights that characterize their integration functions will not satisfy equation (4).
The integrator itself is unbiased – the weights sum to 1. To characterize human estimation of object location, one should accommodate potential biases into the estimator. To do this, we can write an observer’s estimate of location as
| (5) |
where a and b represent absolute perceptual biases. As long as the linear assumption embodied in equation (5) holds, this does not pose a problem for studying cue integration, since we are concerned with the relative (not absolute) weights that humans use to integrate cues. Given a behavioral measure, Zobserved, that is linearly related to an observer’s internal estimate of location, we can use the weights derived by regressing this measure against remembered and visually specified location to estimate the observer’s cue weights, and . Letting Xmemory represent the experimentally specified position of a target object to be remembered on each trial of an experiment and Xvision represent the visual position of the target on each trial, we can fit weights, kmemory and kvision to the function
| (6) |
to estimate the relative weights that the subjects give to memory and vision when integrating them. The absolute values of the empirically measured weights, kmemory and kvisionwill be biased both by subjects’ own perceptual biases and by biases in the mapping between perceptual states and the behavioral measure, Zobserved; however, given the assumption of linear biases in both, the relative weights measured in the experiment are equal to the relative weights that characterize subjects’ cue integration function (equation (4)),
| (7) |
This allows us to characterize subjects’ cue weights as a normalized function of the empirically measured weights,
| (8) |
In a typical test of optimality, one compares calculated using equation (8) with computed using equation (4) and some experimental measures of cue reliability.
In our previous study, subjects sequentially picked up virtual objects from a target region and put them in a virtual trash bin (the setup was approximately as the current one, depicted in Figure 1). During transporting the first object to the trash bin, the second object could change location. In those perturbation trials, the peripheral visual information about object location that was available when planning the movement from the trash bin to the second object (Xvision) differed from the remembered, original object location (Xmemory). To estimate the relative weights that subjects gave to remembered target location and visual target location for planning the movement to the target, we regressed the position of subjects’ fingers at different points in time during the movement against the target object location as it was at the beginning of a trial and its location at the end (which may or may not be the same). Figure 2 shows the results of this analysis averaged across all subjects. The weights in the first part of the movement reflect the relative contribution of visual short-term memory to planning. The experimentally measured weights decrease in the second half of the movement presumably because of the influence of online control based on the newly fixated target location. As an interesting aside, subjects never noticed the perturbation, but clearly gave a large weight to memory for motor planning, suggesting caution when making strong conclusions about the limited capacity of memory from change detection experiments.
Figure 1.

(A) Schematic depiction of the experimental setup, (B) an overview of a trial in which the target is perturbed downwards, in the condition with both visual and memorized information, and (C) a schematic depiction of the possible locations of the targets relative to the reloading center. The grey lines along the arc indicate the possible locations of the targets.
Figure 2.

Brouwer and Knill (2007) measured the relative influence of remembered target location and visual target location on the position of subjects’ fingers at different points during a movement to touch a previously viewed object. The target object was approximately 29 degrees away from fixation. This figure reproduces the data measured in that experiment for high and low contrast targets. The influence of memory is shown as a normalized weight between 0 (no influence) and 1 (total dominance) as a function of the percentage of movement time (averaged across subjects). Because the display was flickered for 200 ms after movement onset and it takes 120 to 150 ms for online corrections to appear in movement kinematics, we can reliably treat the weights prior to approximately 40 – 50% of the total movement duration as reflecting the influence of memory on movement planning. The weights decrease in both stimulus conditions in the last half of the movement due to online control which is driven by visual target location information.
In the original experiment, we manipulated the contrast of the target with the intention of changing the reliability of peripheral visual information for planning movements to the target. As seen in Figure 2, the manipulation had a clear effect on how subjects weighted memory and vision; however, we had no independent means of assessing whether and by how much the contrast manipulation actually affected cue reliability. In the current study, we explicitly tested whether subjects are statistically optimal in how they weight memory and vision for planning movements in this task. Using measures of pointing variance in vision-only and memory-only conditions, we tested the predictions of optimal integration as expressed in equations (2) and (4).
Methods
Overview
In a virtual environment, subjects performed a pointing task in which they picked up a virtual ‘weapon’ with their fingertip, reloaded it at a ‘reloading center’ and then moved back to touch a target that was presented close to the original location of the weapon. In the vision-only condition, the target was not displayed at the beginning of a trial, but appeared only after subjects had moved the weapon to the reloading center and were fixating the reloading center. It disappeared again after subjects began their movements back from the reloading center to the target. Thus, the only information they could use to plan the movement to the target in the vision-only condition was provided by peripheral vision. In the memory-only condition, the target was visible at the start of the trial, but disappeared as soon as the subject picked up the weapon and started to move with the weapon to the reloading center. In this condition, subjects could only use memory to plan their movement to the target. In the vision-and-memory condition, the target was visible from the beginning of a trial until the subject began moving his or her finger from the reloading center to the target. In that condition, both peripheral vision and memory could be used to plan the movement. In part of the vision-and-memory trials, the target location was perturbed up or down during subjects’ movement to the reloading center. These trials created a conflict between the visual and remembered target location available for planning the movement to the target, and were used to compute cue weights.
In none of the conditions was the target visible after subjects began their movements from the reloading center back to the target. This guaranteed that there was no visual information about the target available for online adjustments. The goal of this manipulation was to remove the effect of online control as observed in the memory weights of the original experiment (Figure 2), so that the end-points of subjects’ movements only reflected computations involved in planning. The variance of subjects’ movement end-points in vision-only and memory-only conditions provides estimates (albeit with added motor execution noise) of the variances of the internal estimates of target location available from peripheral visual information and from memory. When corrected for motor execution noise, these variance estimates predict the weights that subjects should give to memory and vision in the vision-and-memory condition (equation (4)).
Subjects
Ten subjects volunteered to take part in the experiment for payment. They were students at the University of Rochester and between 18 and 20 years old. All subjects were naïve with respect to the purpose of the experiment and had never participated in similar experiments before. They had normal or corrected to normal visual acuity and good stereo vision as tested by Randot® Stereo-tests (Stereo Optical Company Inc., Chicago, Illinois). The present study is part of an ongoing project that had been approved of by the local ethics committee.
Apparatus
Subjects performed their task in a virtual reality setup as depicted in Figure 1A. Figure 1B shows the working environment of the subject and the sequence of events during a trial. Starting with their right index finger on a large starting cross, subjects were asked to pick up first the square weapon (which automatically ‘stuck’ to the finger on touching it), ‘reload’ it at the reloading center, and then return to blow up the round target.
Subjects rested their heads in a chin and head rest and viewed the experimental environment that was displayed on a monitor through a mirror. The tilted table underneath as well as the moving hand were obscured by the mirror. Subjects viewed the display stereoscopically through LCD shutter glasses. The distance between the eyes and the table was approximately 55 cm. The starting cross, weapon, target and reloading center were made to appear on the table by rendering them in three dimensions at the appropriate locations and orientations. For most of the time during a trial (see ‘General procedure’), a virtual finger was rendered at the 3D position and orientation of the subject’s real finger. In order to record the location and orientation of the finger over time, subjects wore a steel tube over their index finger with three infrared markers attached to it. These were tracked by an Optotrak 3020 system (NDI, Waterloo, Ontario, Canada) at 120 Hz. The information was used online to compute the 3D position and pose of the finger. We used linear extrapolation of the finger’s position to correct for the approximately 20 ms delay between recording the finger’s position and the appearance of the virtual finger in the display; thus, the virtual finger moved in real time with the actual, unseen finger.
On the table were two steel plates; one on the right and one on the left. The weapon and the target were projected on the right plate and the starting cross and the reloading center on the left plate. The plates were connected to a 5 V source and to a Northern Digital Optotrak Data Acquisition Unit II that recorded the voltage across each plate at 120 Hz. The steel tube worn over the index finger acted as a ground, so that by measuring the voltage of the plates we acquired precise measurements of the time that the finger left and arrived at the left or the right plate. These measurements were used to determine the timing of the beginnings and ends of the sub-movements involved in the task.
For each time that a subject came into the laboratory, we calibrated the virtual environment by measuring the positions of the eyes in space, the position and orientation of the display in space and the position and orientation of the subject’s finger relative to the Optotrak markers. See for details about the calibration procedure Brouwer and Knill (2007).
We measured the horizontal component of eye movements by recording EOG (electro oculogram) signals (see for details Brouwer & Knill, 2007). The eye movement signals were used online to ensure that subjects started to move the finger from the reloading center to the target before the eyes (we will discuss later, under ‘Target visibility’, why we introduced this requirement). The start of the hand’s movement was the moment that the finger left the table. The start of a saccade to the target was the moment that eye velocity exceeded a velocity threshold after the moment that the finger arrived at the reloading center. This threshold was manually set at each eye calibration.
Stimuli
The weapon was a 7 mm wide square, the target was a circle with a diameter of 7 mm (≈ 0.7 deg of visual angle), and the reloading center was a plus sign with a diameter of 10 mm (≈ 1.0 deg). The starting cross, reloading center and objects were all displayed in red on a dark background (a setting of 100% black; 0.03 cd/m2 as measured with a Minolta luminance meter LS-110; 0.00 cd/m2 as measured through the shutter glasses). We chose a black background in order to minimize the visibility of other landmarks such as the edges of the display. In addition, red objects on a dark background are optimal for viewing through shutter glasses. The weapon and the target could be of high contrast (a setting of 60% red; 1.60 cd/m2, 0.20 cd/m2 through the shutter glasses) or low contrast (a setting of 30% red; 0.30 cd/m2, 0.03 cd/m2 through the shutter glasses).
The starting cross was always located at the center of the display’s edge closest to the subject. Figure 1C schematically shows the possible locations of the weapon, the target and the reloading center. The reloading center was located on the horizontal midline of the display and 14 cm to the left of center. The reloading center formed the center of an imaginary circle with a radius of 28 cm (≈ 28 deg). The weapon and target were positioned on the right hand side of this imaginary circle; thus, both were always at the same distance from the reloading center. The location of the weapon and target were determined by drawing lines from the reloading center to the imaginary circle at specified angles from the horizontal. The angles specifying the weapon’s position were chosen by uniformly sampling an angle from the range [−12.5°,−2.5°] creating positions on the display that varied approximately uniformly in height over a range of 5 cm (≈ 5 deg of visual angle). The same parameters were used to choose target positions, but targets were positioned above the horizontal rather than below the horizontal. The configuration of weapon, target, reloading center was then rotated randomly by an angle within the range of ±2.5° around the center of the display. With this configuration, the distance between the weapon and the target varied between 2.5 cm and 12.1 cm (≈ between 2.5 and 12.1 deg of visual angle).
Procedure
The room in which the experiment was performed was darkened. A subject started each trial by positioning the right index finger on the starting cross. The reloading center, the square weapon and the round target were presented simultaneously with the starting cross. After 500 ms, the cross spun, signaling the subject to start moving to the weapon. If the movement started before 100 ms after the start signal, a ‘too early’ warning appeared and the trial was repeated later. All movements were performed by lifting and lowering the finger rather than by sliding it across the table. On touching the weapon, it ‘magnetically’ stuck to the finger, as indicated by the square increasing in size. The criterion for touching the weapon was that the fingertip had to be within 10 mm of the center of the square. At the moment that the subject’s finger left the table in order to go to the reloading center, we presented a 200 ms flicker, rendering the whole screen successively black and white repeatedly with a cycle period of four binocular frames. The frame rate of the monitor running in stereo mode was 118 Hz, giving an effective binocular frame rate of 59 Hz. Thus, the flicker rate was 14.75 Hz.
In order to have the weapon reloaded, the fingertip, with the weapon attached to it, had to touch the reloading center within 3.5 mm. A successful reload was indicated by a spin of the weapon. Next, the subject moved the finger from the reloading center to the round target. Subjects had to move their finger before they moved the eyes. If they moved the eyes first, a warning appeared and the trial was repeated later. Because we wanted to minimize online control of the movement, the finger disappeared after the finger tip had covered 4.2 cm of the 28 cm between the reloading center and the target. The finger was visible again during the last 4.2 cm of the movement, so that subjects still got a visual impression about what they did. (For consistency, the finger disappeared during the center part of the movement to the reloading center as well.) If subjects hit the target within 10 mm of its center, it exploded spectacularly. If they missed, the target reappeared to inform subjects about the error they had made. Subjects were asked to move fast and precisely. If the complete trial was not finished within 6000 ms, a message appeared that this was too slow and the trial was repeated later. At the end of each block, a score was displayed that corresponded to the number of trials on which subjects had hit the target. After the complete experiment, subjects were first asked whether they had noticed anything strange in the display and then, whether they had ever noticed targets shifting up or down.
There were three conditions, one in which both visual and memorized information about the target were available (vismem), one in which only visual information could be used (vis) and one with only memorized information about the target (mem). Table 1 gives an overview of the visibility of the target across different time intervals. In vismem, both the weapon and the target were visible at the start of the trial. In half of the trials the position of the target was perturbed during the flicker that was presented after the finger left the table with the weapon to move it to the reloading center. Perturbations were 1 cm “up” or “down” – shifted in the direction perpendicular to the axis connecting the reloading center to the target area – with equal numbers of perturbations up or down. The flicker ensured that this was not noticed by the subjects. In the other half of the trials, the target remained where it was. Target location was not perturbed in the other two conditions. In vis, the target only appeared at the time that the finger arrived at the side of the table where the reloading center was projected. In mem, the target was present at the start of the trial, but disappeared at the time that the finger left the table with the weapon.
Table 1.
Overview of the visibility of the target during different epochs in the trial per condition vis (vision only), mem (memory only) and vismem (vision and memory). A plus sign means that the target is visible, a minus sign that it is invisible. During the flicker, the whole screen successively turns black and white so that none of the virtual objects are visible at that time.
| Condition | Trial starts |
Finger leaves table with weapon |
Finger leaves reloading center |
Finger arrives at reloading area |
|
|---|---|---|---|---|---|
|
| |||||
| vis | − | flicker | − | + | − |
| mem | + | flicker | − | − | − |
| vismem | + | flicker (and target perturbation) |
+ | + | − |
In all of the three conditions, the target was not present at the time that the finger left the reloading center. It either disappeared at that time (vis, vismem) or it had already disappeared earlier (mem). This minimized the contribution of online control. Without this manipulation, it would have been difficult to compare the mem condition to the vis and vismem conditions, since only in these latter two conditions would it have been possible to look at the target and adjust the hand’s movement on the basis of this new information. However, only having the target disappear at hand movement onset did not ensure comparable conditions. A pilot experiment showed that when a target always disappears on movement onset, subjects direct their eyes often to the target before they start the movement of the hand. When the target remains visible, this practically never happens (Brouwer & Knill,2007). The consequence of the eyes arriving at the target before the hand starts to move in this experiment would again be that the conditions cannot be compared since foveal target information could be used for planning the movement in the vismem and vis condition, but not in the mem condition. Thus, because we wanted to be able to compare conditions, and because we are interested in the information used during planning a movement, which normally includes both memorized and peripheral visual information (Brouwer & Knill, 2007), we introduced the requirement that the hand had to start moving before the eyes for a valid trial.
Design
All subjects performed five sessions on separate days. Each session consisted of three blocks of trials. Within blocks, trials were presented in random order. Between blocks, subjects could rest.
During the first, third and fifth session, subjects performed three blocks of vismem trials. Each block contained 80 trials. In half of them, the weapon and target were low contrast, in the other half they were high contrast. For each of the two levels of contrast, target location was unperturbed in 20 trials, and perturbed in 20 trials. Of the perturbation trials, 10 targets were shifted 1 cm up in the Y-coordinate direction of the virtual tabletop, and 10 were shifted 1 cm down. Finally, the feedback of each of those 10 targets was consistent with the visual location in 5 trials, and consistent with memorized location in the other 5. The first session was considered as a practice session and the data were discarded. The first blocks of the other two sessions were also discarded as practice. Thus, the total number of analyzed vismem trials was 4 blocks * 80 trials = 320 trials per subject.
Half of the subjects performed the vis condition during the second session and the mem condition during the fourth session, the other half did it the other way around. A block of vis trials contained 35 low and 35 high contrast trials. A block of mem trials contained 36 low and 36 high contrast trials. The first blocks were discarded as practice. Thus, for the vis condition we analyzed 2 blocks * 70 trials = 140 trials per subject, and for the mem condition 2 blocks * 72 trials = 144 trials per subject.
Data analysis
Pointing errors
We used the signals from the contact of the finger with the steel plates to determine when the finger left or arrived at the starting cross, the weapon, the reloading center and the target (subjects always lifted their fingers to perform the task rather than sliding their fingers along the table). We determined the constant pointing error relative to the center of the target at the time that the subject arrived there, both in the horizontal (X) and in the vertical (Y) directions. Negative values for the horizontal and vertical pointing error indicate hitting a location to the left and below the center of the target respectively; positive values indicate a location to the right and above of the target’s center. Variable pointing error was computed by taking the standard deviation of the constant pointing errors for each subject and each condition separately, for both the horizontal and vertical direction.
The optimality hypothesis predicts a particular relationship between the variance of subjects’ estimates of position from visual and remembered information, respectively, and the weights that subjects give to those cues. We used the variances of subjects’ endpoints in the vis and mem conditions to estimate the perceptual variances. In order to do that, however, we must account for biases in the mapping between perceived target position and the end-points of movements. In particular, we have observed both in the current study and in past studies that some subjects show a bias in their endpoints toward the midline of the display; that is, subjects hit slightly below targets that are presented relatively high (or far) on the table, and above targets presented relatively low (or near). To correct for this, we assumed that subjects’ end-points were linear functions of unbiased estimates of target position
| (9) |
where represents subjects’ internal estimate of the height of a target on any given trial, Yobs is the height of the end-point of subjects’ finger at the end of the initial movement to the target and Noise is motor execution noise. The mean-squared error of the linear model in equation (9) provides an estimate of the unbiased variance in subjects’ perceptual estimates of target position plus a variance term related to the motor execution noise. This estimate is equivalent to dividing the variable pointing error computed as described above by the slope of the regression line.
We used the square-root of the mean-squared error of the regression model in equation (9) to compute corrected estimates of subjects’ unbiased variable error. This was done separately for each subject and condition of the experiment. Subjects’ variable errors reflect the contributions of both perceptual noise (localization uncertainty) and motor noise (variability in executing the pointing movement). The confounding influence of motor noise creates a small bias in estimates of visual and memory weights predicted using the variable error as an estimate of their perceptual uncertainty. In the discussion of results, we will analyze the data both using the raw variable error measures and using a measure that accounts for motor variability. The latter analysis effectively removes the small mismatches we found between the predictions derived form the raw variable error measures and subjects’ weights.
Normalized memory weight
For the vismem condition, we used the same method as in Brouwer and Knill (2007) to quantify the weight that subjects assigned to memorized location over the course of the movement from the reloading center to the target. Multiple linear regressions were performed with the vertical finger position as the dependent variable and the memorized and visual target location as independent variables for different time steps. The underlying model for the regression at each time step was that the vertical position of the finger could be given by the following linear function:
| (10) |
where Yfinger(t) is the observed position of the finger at time t, Ymemory is the position of the target at the beginning of the trial and Yvision is the position of the target as it appeared prior to subjects moving to touch the target. On perturbed trials Ymemory and Yvision differed by 1 cm. Before performing the regression, we shifted the finger position data and the target positions on each trial so that the origin was always the starting position of the finger. We then normalized each movement trajectory in time and selected points in time for analysis that were separated by 10% of each movement’s duration. We computed the normalized contribution of remembered location to a finger’s location at each point in time as the ratio of the weight given to the remembered location to the sum of weights given to the remembered and visually specified locations; i.e.,
| (11) |
This resulted in ten sets of weights for the influence of remembered and visually specified location at 10%, 20% …, 100% of movement duration, with separate values for each subject and each high and low contrast condition. Note that the normalized weight given to visual location information would simply be 1 minus the weight given to memorized location.
We used resampling to calculate a measure of the standard error on all of the weight estimates. We replicated the analysis described above 1000 times by randomly sampling (with replacement) N trajectories from the set of trajectories and applying the regression analysis to these samples (N = number of trajectories in a set). The standard deviations of the resulting weights provide estimates of the standard errors of the weight estimates.
Eye position
To determine the eyes’ and hand’s relative departure times from the reloading center and their relative arrival times at the target, we determined saccades off-line. First, we smoothed the eye velocity signal by a moving average window of 21 frames in order to remove irregularities caused by random variations in the signal. Then we detected the saccade from the reloading center toward the target by finding the first frame in which the eye velocity exceeded 143 deg/s after the time that the finger arrived at the reloading center. From that frame we searched for the frame in which the eye velocity first dropped below 57 deg/s. This point in time was defined as the end of the saccade and arrival of the eyes at the target.
Results
Pruning bad data
Out of a total of 6040 trials, 21 trials were rejected due to technical reasons (e.g. dropped Optotrak frames). For each subject and each session, we discarded trials in which either the vertical or horizontal errors were greater than 3 times the standard deviation of the error in that selection of trials. This resulted in 239 discarded trials. None of the subjects reported to have noticed the perturbations.
Our analysis of subjects’ constant and variable errors revealed that two subjects were likely unable to see the low contrast stimulus in many of the trials of the vis condition, when the target only appeared in the periphery at the time that the subject touched the reloading area with the weapon. In particular, these subjects had a combination of very high end-point variance (in the Y direction) and a very strong regression to the center of the target zone on the right hand side of the display. The uncorrected variable error of these two subjects’ end-points was greater than the average uncorrected variable error of the other eight subjects by more than three times the standard deviation of those subjects’ error (1.37 cm and 1.53 cm for the two ‘bad’ subjects compared with 0.61 ± 0.23 cm for the eight ‘good’ subjects). The slope of the regression line relating the visual target’s end-point positions to the two bad subjects’ end-point positions were 0.45 and 0.28, respectively, indicating a strong regression to the center of the target region. By comparison, the other eight subjects had average slopes of 0.96 ± 0.19. After correcting for the bias in the mapping between movement end-point and target position, the two bad subjects had a variable error of 3.07 cm and 5.45 cm, respectively, as compared with an average corrected variable error of 0.69 ± 0.13 cm for the other eight subjects. These same two subjects performed normally (regression slopes near 1 with low variable error in end-points) in the mem and vismem conditions, indicating that their poor performance in the vis condition did not reflect a general inability to perform (or inattention to) the task. The remainder of the results section will consider only the eight subjects whose performance, as measured by their corrected variable error was within the ‘normal’ range as defined by the spread of the group in all three conditions.
Timing of the hand
Figure 3 shows the overall hand timing in the experiment. Each trial involves three ‘dwelling times’: time spent on the starting cross, weapon and reloading center, and three movement times: time between starting area and weapon, between weapon and reloading center and between reloading center and target. Repeated measures ANOVAs on these times (excluding the vismem trials in which the target shifted) showed a main effect of contrast on time spent on the starting cross, movement time from the starting cross to the weapon, and time spent on the reloading center. In all cases, these times were longer for low contrast trials compared to high contrast trials. There was only a main effect of condition (vis, mem and vismem) on the time spent on the reloading center. This dwelling time also showed an interaction between contrast and condition (discussed below). Another interaction between contrast and condition was observed for the movement time from the starting cross to the weapon.
Figure 3.

Mean movement and dwelling times of the finger for the low and high contrast conditions. Zero is the starting signal. Squares represent arrival times, circles represent leaving times. To the right of the symbols, we indicated the objects in the experimental environment that correspond to these moments of arrival and leaving.
Figure 4 shows average times per condition that are of particular relevance to our experiment. The time from the start of the trial until the moment that the hand leaves the table with the weapon (Figure 4A) reflects the time that can be used to store the location of the target. Repeated measures ANOVAs (excluding the vismem trials in which the target shifted) show only an effect of contrast (F(1,7) = 25.38, p < 0.01), with subjects taking longer for low compared to high contrast targets (condition (vis, mem and vismem): F(2,14) = 1.55, p = 0.25 and interaction with contrast: F(2,14) = 1.65, p = 0.22). The time that subjects spend on the reloading center (Figure 4B) is important since it reflects the time that the visual location of the target is perceived in the periphery1. This time is affected by condition (F(2,14) = 7.26, p < 0.01), contrast (F(1,7) = 5.84, p = 0.046) and there is an interaction (F(2,14) = 96.84, p < 0.01). Basically, these effects show that time spent on the reloading area is longer in the vis condition than in the other conditions, and only in the vis condition, contrast affects the dwelling time in that subjects remain longer at the reloading center when the contrast is low than when it is high.
Figure 4.
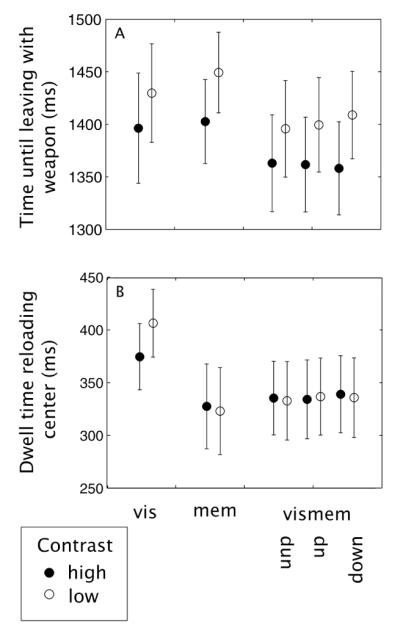
(A) Time between the start signal and the moment of leaving with the weapon and (B) the time that the finger spent in the reloading area for each condition. These times reflect respectively the time available to store the target location (in mem and vismem) and the time available to collect peripheral visual target location information for planning the movement (in vis and vismem). Errors bars are between subject standard errors of the mean.
Timing of the eyes
On average, the eyes start to move 155 ms after the finger has left. They arrive at the target 414 ms before the hand. Repeated measures ANOVA’s showed that these times were not affected by contrast or condition.
Constant end-point errors
Figure 5 shows the average constant end-point errors in both the X and Y directions in the five main conditions of the experiment – vis, mem, vismem (unperturbed), vismem (perturbed up) and vismem (perturbed down) – for both low and high contrast targets. The constant errors in Y in the vismem conditions (Figure 5A) show the predicted effects of memory on motor planning: if a target was shifted downwards, subjects hit it above its center and if a target was shifted upwards, they hit it below its center - that is, subjects’ hitting locations are drawn to the target’s old, memorized location. A repeated measures ANOVA on constant vertical error in the vismem condition, with target shifts (no shift, upward and downward) and contrast (high and low) as independent variables showed a main effect of target shift: F(2,14) = 72.72, p < 0.01, no main effect of contrast: F(1,7) = 3.25, p = 0.11, and an interaction between contrast and target shift: F(2,14) = 39.74, p < 0.01. The interaction reflects a smaller difference in the constant error between up and down perturbations for high contrast condition than for low contrast stimuli – an effect consistent with a greater reliance on memory in the low contrast conditions.
Figure 5.
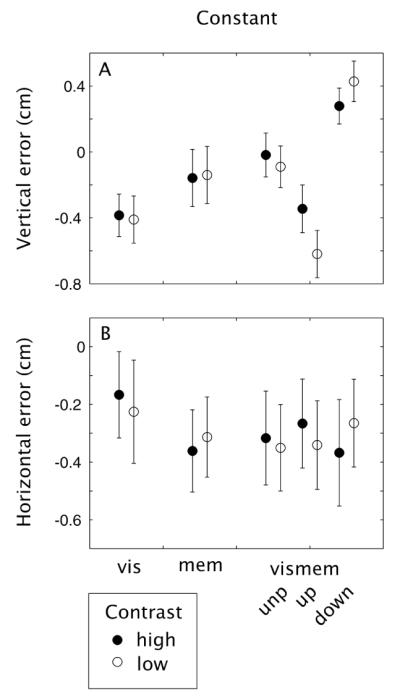
Mean constant errors in the (A) vertical and (B) horizontal direction for each condition.
Subjects generally undershoot the target as shown by the negative values of constant horizontal error in Figure 5B. Repeated measures ANOVAs (excluding the vismem trials in which the target shifted) show no effects of vis, mem or vismem condition (F(2,14) = 2.54, p = 0.11), contrast (F(1,7) = 0.17, p = 0.69) and there is no interaction (F(2,14) = 1.32, p = 0.30).
Variable end-point errors
Figures 6A and B show subjects’ average variable error in the Y direction (uncorrected (A) and corrected (B) for biases toward the center of the display). A repeated measures ANOVA on the uncorrected variable error of vis, mem and the unperturbed data of vismem shows an effect of condition (F(2,14) = 7.97, p < 0.01). A Fisher LSD post-hoc test indicated that the variability in vismem was significantly lower than in the mem condition (p < 0.01). There was also an effect of contrast (F(1,7) = 7.89, p = 0.03) with lower variability for high contrast conditions. There is no interaction between contrast and condition (F(2,14) = 2.64, p = 0.11).
Figure 6.
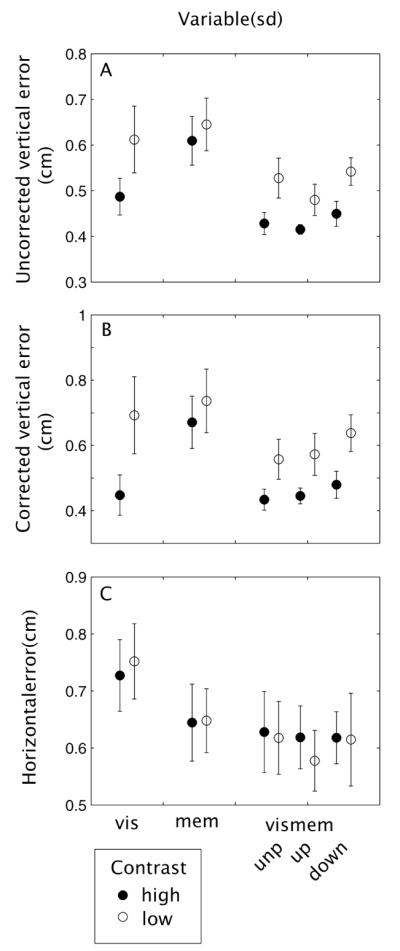
Mean variable errors in the vertical direction ((A) uncorrected and (B) corrected for biases to point toward the middle of the target-weapon configuration), and (C) mean variable errors in the horizontal direction for each condition.
A repeated measures ANOVA on the corrected variable error of vis, mem and the unperturbed data of vismem also show an effect of condition (F(2,14) = 6.75, p < 0.01), and contrast (F(1,7) = 9.20, p = 0.02). Again, variability in vismem is significantly lower than in the mem condition (Fisher LSD p < 0.01) and variability in vis is lower than in mem (Fisher LSD p = 0.04). For the corrected variable error there is also an interaction between contrast and condition (F(2,14) = 4.21, p = 0.04). Variability is lower in the high compared to the low contrast condition, but this effect is caused by the vis and vismem conditions (Fisher LSD p < 0.01 for the effect of contrast in vis and p = 0.01 for the effect of contrast in vismem).
Figure 6C shows subjects’ average variable error in the X direction. There is a significant effect of viewing condition (F(2,14) = 5.01, p = 0.02) with variability being lower in the vismem compared to the vis condition (Fisher LSD p = 0.02) but no effect of contrast (F(1,7) = 0.08, p = 0.79) and no interaction (F(2,14) = 0.64, p = 0.54).
The influence of memory on subjects’ movements over time
In order to compute the relative influence of memory on the positions of subjects’ fingers over time, we used the trials in the vismem condition. We regressed subjects’ finger positions (in Y) at different points during the movements toward the target against both the remembered target location (its location at the beginning of a trial) and the visually specified location at the time that the movement was planned (its location when subjects’ fingers were in the reloading center). Figure 7A shows the normalized memory weight as a function of the proportion of time through the movement. We have only plotted subjects’ average weights for the last half of the movement because of the low reliability of weight estimates derived from the regression analysis for time points in the first half. Figure 7B shows the average standard error in the estimates of the memory weights (computed by resampling). The data show that subjects rely more on memory for low contrast targets than for high contrast targets. The mean relative weight to memorized location at the end of the movement was 0.27 in the high contrast condition and 0.48 in the low contrast condition.
Figure 7.

(A) Normalized weights given to memorized location for predicting finger position as a function of the proportion of time through subjects’ movements. We have only shown the weights computed for the last half of the movement because the weights estimated for points in time during the first half of the movement were, for some subjects, extremely noisy. This is reflected in the standard errors of the weight estimates. The standard errors on weight estimates for a few subjects exceeded 10 for times prior to the halfway point of the movements (high standard errors on normalized weights are possible, because normalized weights were constrained to sum to 1, not to lie between 0 and 1; thus, the re-sampled distribution of memory weights used to compute error bars could include negative values and values greater than 1). In part, this was due to the low signal-to-noise ratio for estimating weights early in movements when the finger trajectories to different target positions have not diverged by much. In part, it was due to bad motion recording data for some subjects early in movements. Superimposed on the plots are graphs of the weights computed in the previously published experiment (dashed lines). (B) Average standard errors of the weight estimates in the last half of the movements. Average standard errors earlier in the movement are not shown because they are so high.
Shown for comparison in the figure are the weights computed in our original experiment (Brouwer & Knill,2007). The major difference between the two experiments was that after the movement toward the target had started, visual information about the target was available in the previous experiment, whereas it was not in the current experiment. In the earlier experiment, we also did not impose any constraint on subjects’ eye movements; rather, subjects naturally delayed their orienting saccades to the target relative to their hand movement. 50% of the way through subjects’ movements, the estimated weights are almost exactly the same in the two experiments. In both experiments, these weights reflect how subjects integrated memory and vision for motor planning. The influence of memory on subjects’ movements in the previous experiment dropped over the second half of the movements, presumably due to the effects of visually guided online control. Since no visual information was available during movements in the current experiment, subjects had no opportunity to use foveated visual information about the target to make trajectory corrections at the ends of their movements. This is reflected by the fact that the influence of memory stays constant over time in the current experiment. This allows us to use the weights measured from subjects’ finger end-points (the most reliable estimates we have) as estimates of planning weights for the current task.
Optimality – analysis of variable error
Assuming no extra noise in the integration process, the variance of an optimal cue integrator’s estimates of target position can be related to the variance of the estimates derived from each cue independently by
| (12) |
where is the variance of the integrated estimate. If we assume that perceptual uncertainty in target location dominates subjects’ variable errors in the pointing task, we can fill out subjects’ corrected variable errors in the vis and mem conditions in equation (12) to compute predicted variable end-point errors in the vismem condition. Figure 8A shows a scatter plot of the predicted standard deviation of subjects’ end-points (corrected for biases to the center of the screen) against the standard deviations predicted from the variable errors in the vis and mem conditions. There is a clear shift of subjects’ data above the unity line – their variable error in the vismem condition is greater than predicted from their variable in the vis and mem conditions under the optimality hypothesis. This is shown clearly in the bar graph (Figure 8B) of the average variable error (real and predicted) for both the low and high contrast conditions. The difference between measured and predicted variable errors (averaged across contrast conditions) was marginally significant (t(7) = 2.34, p = .052).
Figure 8.

(A) Scatter plot of the (corrected) variable error in subjects’ end-points in the vismem condition versus the variable error predicted by their variable error in the vis and mem conditions using equation (9); that is, assuming that all of the variable error was due to perceptual errors. (B) The average across subjects of subjects’ variable errors versus their predicted variable errors.
The previous analysis assumed that perceptual noise dominates subjects’ end-point variability; however, variability in motor execution (motor noise) also contributes to the total variable error in all conditions (van Beers, Haggard & Wolpert, 2004). The existence of motor (or other non-perceptual noise) predicts that measured variances in the vismem condition would be higher than those predicted by assuming no motor noise (as in Figure 8). If we assume that motor variance is independent of stimulus condition, we can write the measured variance in subjects’ end-points as sums of the variance in their perceptual estimates of target location and the motor variance,
| (13) |
where Vvis is the measured variance of a subject’s end-points in the vis condition, Vmem is the measured variance of a subject’s end-points in the mem condition, Vvismem is the measured variance of a subject’s end-points in the vismem condition and is the variance in end-points induced by variance in motor execution. This leaves four unknowns and three knowns; however, if we assume that subjects are optimal we can use their data to estimate using the constraint embodied in equation (12). Combining equations we have for the variance of end-points in the vismem condition gives
| (14) |
This gives a quadratic equation for which for our data had only one real solution for each subject and condition. Solving equation (14) for the high and low contrast conditions for each of the eight subject gave average estimates of motor variance of 0.095 cm2 (high contrast) and 0.083 cm2 (low contrast). These values correspond to standard deviations of 0.308 cm (high contrast) and 0.288 cm (low contrast).
For any one contrast condition, the optimality hypothesis makes no clear predictions relating variable error in the vis, mem and vismem conditions, except that equation (14) admits a real solution. The optimality hypothesis combined with the assumption that motor execution variability is independent of stimulus conditions (e.g. is independent of perceptual variance) does, however, predict that the estimates of motor variance derived from equation (14) will be the same for both high and low contrast stimulus conditions. This is true of the average motor variance estimates across subjects. A linear analysis of motor noise estimates as a function of two factors – subject and contrast condition – also shows that only 15% of the variance in motor noise estimates is attributable to differences in condition, while 85% is attributable to individual subject differences.
One difficulty with applying this analysis to individual subjects’ data is that subjects’ variance estimates are inherently noisy, particularly because they are derived from separate blocks of trials and subjects performance likely varies over time. Presumably because of this, three of the subjects had measured visuo-motor variances in one of the contrast conditions that were lower than could be predicted by a positive motor variance from equation (14) (the three data points below the unity line in Figure 8). For these subjects and the corresponding conditions, applying equation (14) to the experimentally measured variances gave negative estimates of motor variance – clearly a physical impossibility.
While it is not surprising to find a few data points like this, it renders impossible the approach of using estimates of motor noise derived for each subject to correct the predicted memory weights as we would like to. We therefore used variance measures averaged across all subjects to derive a measure of motor noise for the “average” subject. Figure 6B shows the average variance data for all of the conditions in the experiment. We computed the variable error in the vismem condition predicted by the average subjects’ variable error in the vis and mem conditions and each possible value for the motor variance. We selected the motor variance that minimized the average squared difference between the predicted and measured vismem variances in the high and low contrast conditions. The resulting estimate of motor noise had a standard deviation of 0.283 cm (almost exactly the average of the estimates of motor noise derived from individual subjects). Figure 9 shows that predictions of subjects variable error in the vismem condition derived using this one estimate of motor variability almost exactly equated the predicted and measured variable errors in both contrast conditions.
Figure 9.
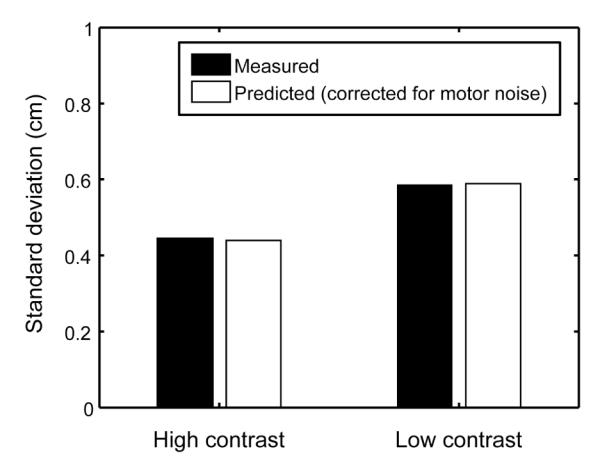
Predicted and measured variable error for the average subject after taking into account the best fitting motor noise to the data. A single value for motor noise of .283 cm (standard deviation) practically eliminated the error in the prediction for both low and high contrast conditions.
Optimality – analysis of memory weights
Equations (2) and (4) show the relationship between optimal linear cue weights and the reliability of each pair of cues. The data from the current experiment allow us to test the predictions of optimality from two points of view. First, we can ask if the relative reliabilities of memory and vision as measured by end-point variability predict the differences in memory weights measured in the high and low contrast stimulus conditions. Second, we can ask if individual differences in memory and vision reliability predict individual differences in cue weights. For these analyses, we used subjects’ memory weights computed at the end of their movements, the last points in the weight plots in Figure 7, since these are the most reliable estimates of weights that we have.
Ideally, we would use estimates of motor variance computed from the variance data of individual subjects to correct the variable errors measured in the vis and mem conditions and derive estimates of individual subjects’ perceptual localization errors to use for predicting memory weights. Since we can’t reasonably do this for the three subject-condition combinations that gave rise to negative estimates of motor variance, we instead show the predictions derived from the raw variable error data in Figures 10A and 11.
Figure 10.

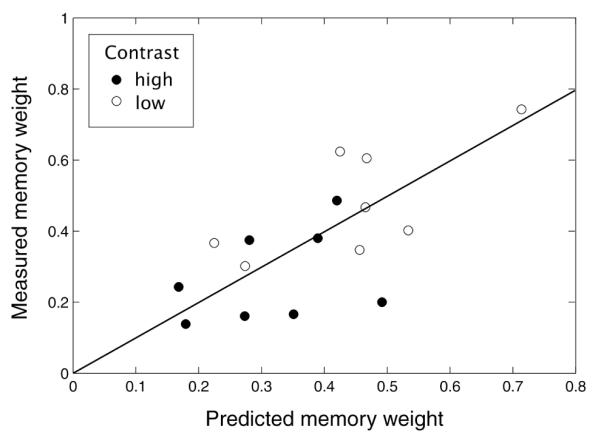
(A) Average memory weights in the high and low contrast conditions plotted along with the average of the memory weights predicted from subjects’ end-point variances in the vis and mem conditions. The measured weights were computed from subjects’ end-points in the cue-conflict (perturbed) trials in the vismem condition. (B) Memory weights for the average subject (same as in (A)) along with the memory weights predicted by the average of subjects’ end-point standard deviations in the vis and mem conditions without correcting for motor noise and the same predictions computed by correcting for the effects of motor noise (as estimated from the variance data).
Figure 11.
Scatter plot of measured memory weights as a function of the weights predicted by the standard deviation in subjects’ end-points in the vis and mem conditions.
Figure 10A shows a bar plot of the average weights that subjects gave to memory (normalized so that the sum of memory and vision weights is one) along with the averages of the weights predicted by inserting the variance of subjects’ end-points in the vis and mem conditions into equations (2) and (4). A paired t-test showed that the difference in subjects weights in the low and high contrast conditions was significant (t(7) = 7.80, p < 0.01). Individual paired t-tests between predicted and measured weights in the high and low contrast conditions showed no significant difference between the predictions of an optimal integrator and subjects’ measured weights (high contrast: t(7) = 1.04, p = 0.34; low contrast: t(7) = 0.89, p = 0.40). Note that the average weights that subjects gave to memory across the two conditions was almost exactly equal to the average predicted weight (0.376 and 0.382, respectively).
Figure 11 is a scatter plot of the measured memory weights against the weights predicted by the variance data. To see whether individual differences in subjects’ observed weights were predicted by individual differences in cue reliability, we performed a linear regression on the data points as plotted in Figure 11, but averaged over the low and high contrast conditions. There was a marginally significant correlation (r2 = 0.46, p = 0.066).
As noted above, this analysis effectively assumes no significant motor noise. Our analysis of the end-point variance data clearly suggested the presence of significant motor noise. Since we cannot compute reasonable corrected estimates of cue weights for three of the sixteen subject-condition combinations (for which motor variance estimates derived from equation (14) were negative), we applied the ideal observer analysis to the average subject; that is, a ‘subject’ whose end-point standard deviations in the different conditions and whose memory weights were the averages across the eight subjects. We used the motor variability derived from the average variance data (sd = 0.283 cm) to derive predictions of memory weights in the high and low contrast conditions for the average subject. Figure 10B shows the average subjects’ memory weights in the low and high contrast conditions, the memory weights predicted by the end-point variances without correction for motor noise and the weights predicted after correcting for the motor noise estimated from the variance data (given in the previous section). Since the average subjects’ memory weight in the low contrast condition is very near 0.5 and the end-point variances in the vis and mem conditions are nearly equal, correcting for motor noise has no real effect on the predictions. The correction does improve the match between measured and predicted weights for the low contrast condition. Since the motor noise was estimated independently from the variance data alone, this provides added support for the optimal integration hypothesis.
Discussion
When both visual and memorized information are available, subjects weigh memory on average as predicted by the optimality rules and the observed uncertainty in the single cue conditions. Changes in subjects’ weights covary with stimulus conditions that modulate the visual accuracy of object location in the periphery (contrast) as predicted by the measured uncertainty of the visual and remembered information in those conditions. Further-more, the experimental data suggests that individual differences in subjects’ memory weights correlate with individual differences in the relative reliability of remembered and visual target location information. Thus, we can conclude that subjects combine memorized and visual information in a way that is broadly consistent with statistically optimal cue combination. Before discussing the implications of this result, we should consider a number of factors that could lead individual subjects’ results to deviate from the predictions of an optimal observer.
Non-linear interactions between memory and vision
In statistically optimal cue combination, cues are assumed not to interact. One way in which memory and vision can interact is that when memorized information is available, one knows more precisely where to guide attention in the periphery to ‘find’ a target object. In the vis condition of the current experiment, subjects knew broadly where the target would appear after they touched the reloading center, but not nearly as well as in the vismem condition. This might explain the behavior of subject 10, one of the subjects discarded because he seemed unable to see the target in the low contrast, vis condition. This subject gave a high weight to vision in the low contrast, vismem condition, suggesting that in that condition, he could see the peripheral target. The other discarded subject, who also performed as if largely being unable to see the low contrast target in the vis condition, gave very little weight to vision in the low contrast vismem condition, suggesting that that subject simply always had difficulty seeing the low contrast target.
Another way that vision and memory could interact non-linearly is that different overall strategies were used for performing the task when only vision, only memory or both sources of information were available to guide movements to the target object. Our analysis assumed that subjects adopted similar strategies in the three conditions. The most notable differences one might predict would be in the temporal dynamics of subjects’ behavior; particularly, their hand-eye coordination patterns. To some extent we limited their ability to vary this by forcing subjects to fixate the reloading center until they had begun hand movements toward the target (to match the eye-hand coordination patterns we found in our previous study in which the target was continuously visible). When observers do not have memory of target location to draw on (our vis condition), they may trade time against visual accuracy to improve their visual estimate of target location before beginning their movement by holding their fingers (and fixating) at the reloading center longer in the vis condition than in the vismem condition. This would lead to a situation in which subjects’ variability in visual estimates of target location is lower in the vis condition than in the vismem condition.
We found that subjects did indeed dwell longer on the reloading center in the vis condition than in the vismem condition (approximately 390 versus 340 ms: see Figure 3B). Thus, the quality of visual information in the vis condition could have been better than in the vismem condition, which would cause a lower predicted weight to memory in vismem than observed. This notion was supported by a regression analysis on the difference in dwelling time between the vis and the vismem conditions against the difference between observed and predicted memory weight for each subject and each condition (Figure 12). The two variables were significantly positively correlated (r2 = 0.29, p = 0.03).
Figure 12.
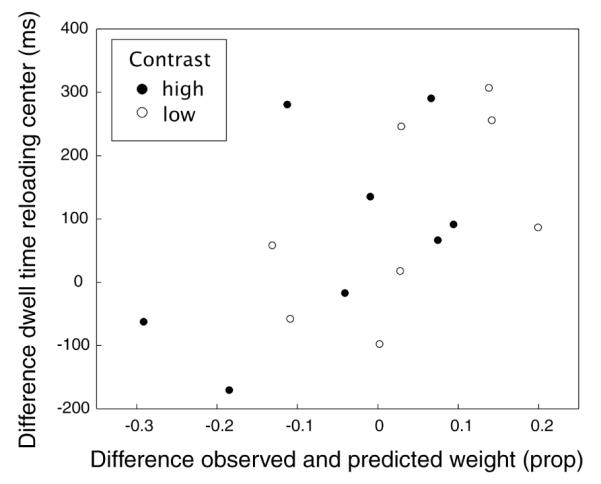
Scatter plot of the difference in dwell time on the reloading center between the vis and vismem conditions and the difference between measured and predicted weights.
Processing of visual target information during the movement to the reloading center
Our analysis and discussion has implicitly assumed that observers do not process peripheral visual information about the target object’s location during the movement after the first flicker – when moving the weapon to the reloading center. This information is available in all of the vismem conditions, including those used to estimate the weights that subjects give to remembered information and peripheral visual information, but was not available in the vis condition used to estimate the reliability of peripheral visual information for planning the movement back to the target. We assume that because subjects’ attention during this interval was directed at the reloading center, they did not process visual information about the target object location present in the periphery. If they had, we should have found larger weights for vision than predicted by subjects variable errors in the vis and mem conditions. We did not find any significant difference between predicted and measured weights, however. While this is broadly consistent with our assumptions, the uncertainty in our experimental measures precludes drawing the strong conclusion that subjects did not process any visual target information present during the movement to the reloading center. Weak modulation of the visual estimate of target location obtained by processing visual target information during this interval would be difficult to detect in our paradigm, as it would lead to only small effects on subjects’ weights.
Continuous versus discrete visual processing of target location information
The previous discussion raises a more general issue. The model we have presented treats remembered object location (in short-term memory) and visual estimates of object location as discrete, static entities that are simply combined at the planning stage of motor control. A more sophisticated and probably more realistic model of visual processing is that the brain maintains and continuously updates one estimate of object location. Even if visual processing of target location was “turned off“ by attention when subjects are moving the weapon to the reloading center, according to this model, the brain would use a process akin to a Kalman filter to continuously update its internal estimate of target object location from the visual information available once an observer switched attention to planning the pointing movement to the target. The initial state of the internal estimate would be the remembered object location, which would be continuously updated using the peripheral visual information available during planning. In this scenario, the weights that we have measured for memory in the vismem condition reflect the residual influence of the initial estimate of object location derived from memory at the beginning of the planning process on the motor plan that subjects execute at the beginning of the movement.
Taking this model seriously, performance in the vis condition would reflect the reliability of a subject’s location estimate at the end of planning when no initial estimate of object location was available at the beginning of the planning process. Similarly, performance in the mem condition would reflect the reliability of subjects’ internal estimate of target location at the beginning of planning when the target had been visible at the beginning of a trial. The predictions derived here would still hold for a such a continuous updating system, if it effectively implemented a Kalman filter to continuously update its internal estimate of object location during planning, when initialized with the remembered object location.
Generalization to more natural settings
A number of features of the current experiment are not ecologically valid. In the vis and mem conditions, target objects either appeared or disappeared in the middle of a trial and the (virtual rendering of the) finger was not visible in all conditions during the middle portion of the movements. Subjects were always constrained to maintain fixation until after they began moving their fingers to the target object. This is consistent with the hand-eye coordination pattern subjects naturally assumed in our previous experiment using a similar task; however, in the original version of the task the target object was always visible as was the subject’s finger. In the current experiment, subjects were naturally inclined to look to the target before they started their movements because they quickly knew that the target disappeared when they began moving to it. While subjects easily learned not to do that in the current experiment, the externally imposed constraint that the eyes move after the hand was somewhat unnatural. Perhaps the largest concern with the current experiment is that a condition was included that forced subjects to use memory (the mem condition). This may have biased them to use memory more than they might otherwise when both remembered and visual target location information are available.
These considerations naturally raise the question of how well the current results generalize to natural behavior. The best evidence that they do comes from comparing the current results to the results of our previous experiment in which the stimulus conditions were much more natural (stimuli did not appear or disappear during a trial) and subjects performed the task in a completely unconstrained manner. In a sense, we were lucky in that experiment that subjects naturally adopted a strategy in which they made orienting saccades to targets after beginning their finger movements. This allowed us to treat the visual information available for planning as being entirely in the periphery. It is likely that if subjects had made orienting saccades before planning their movements, we would have seen little influence of memory (the newly fixated visual information would have superseded memory). Figure 7 shows that subjects’ memory weights in the current experiment were very similar to those we measured previously, at least for that portion of subjects’ movements that we could reliably attribute to planning in the previous experiment. The weights measured in this experiment stay essentially flat over time to the end of the movement, reflecting the lack of online information for making adjustments to correct for the perturbations that were added to create the conflicts between memory and vision.
Conclusions and implications
The important role for memory in planning goal-directed movements as we found in our previous study was almost exactly replicated despite some differences between the experiments. Subjects combined memory and peripheral visual information in a graded manner – giving more weight to memory as visual information was degraded. Most importantly, subjects’ appeared to weigh memory and vision optimally, conditioned on the reliability of the different location cues. In the context of cue integration, this finding has become common-place (Hillis et al., 2004). The finding of optimal cue integration has been used previously to highlight the flexibility of the sensory system to take into account variations in cue reliability in a dynamic and flexible way. From that perspective, the current results extend those conclusions from including only sensory cues to memory.
The current results also suggest a re-thinking of the role of visual short-term memory in visuo-motor control. Rather than relying on visual information alone when it is available and reliable, humans appear to use both sources of information to the limits of their reliability. This has several important implications. First, it suggests the strong hypothesis that the brain always integrates memory with vision – subjects may appear not to use memory when it is very unreliable relative to vision, but that is simply a consequence of the information available and will depend on task and stimulus conditions in predictable ways. Note that often, memorized location may not be as unreliable as suggested by studies in which subjects have to consciously judge a memorized scene (as indicated by our finding that subjects used memory while they did not consciously detect the target’s shift). Second, it suggests a rational basis for determining visuo-motor strategies, particularly, eye-hand coordination. Rather than designing strategies to minimize reliance on visual short-term memory, the strategies are likely to be guided by the constraint that sufficient information be derived from both vision and memory to perform a task to some accepted level of performance.
Many issues regarding the use of memory in action are yet to be explored. How long can memorized information be reliably stored before vision will take over completely? And how many object locations or even other features relevant for action can be memorized? What is the role of external landmarks in memorizing object locations in these kind of tasks? In future studies, we would like to investigate the memory capacity and reference frames used for storing object information for the use in action.
Acknowledgments
We would like to thank Brian McCann for his contribution to the experimental setup, Ted Twietmeyer for constructing the EOG equipment, and Jacquelyn Spector for their contribution to data acquisition.
Footnotes
This time is an underestimation since the subjects also get this information when they are looking at the reloading center during the last part of the hand movement to the reloading center.
Commercial relationships: none.
Contributor Information
Anne-Marie Brouwer, Center for Visual Science, University of Rochester New York, NY, USA Now at: TNO Human Factors Soesterberg,The Netherlands.
David C. Knill, Center for Visual Science, University of Rochester New York, NY, USA
References
- Abrams RA, Meyer DE, Kornblum S. Eye–hand coordination: Oculomotor control in rapid aimed limb movements. Journal of Experimental Psychology: Human Perception and Performance. 1990;16:248–267. doi: 10.1037//0096-1523.16.2.248. [PubMed] [DOI] [PubMed] [Google Scholar]
- Aivar MP, Hayhoe MM, Chizk CL, Mruczek RE. Spatial memory and saccadic targeting in a natural task. Journal of Vision. 2005;5(3):3, 177–193. doi: 10.1167/5.3.3. http://journalofvision.org/5/3/3/, doi:10.1167/5.3.3. [PubMed] [Article] [DOI] [PubMed] [Google Scholar]
- Alais D, Burr D. The ventriloquist effect results from near-optimal bimodal integration. Current Biology. 2004;14:257–262. doi: 10.1016/j.cub.2004.01.029. [PubMed] [Article] [DOI] [PubMed] [Google Scholar]
- Ballard DH, Hayhoe MM, Pelz JB. Memory representations in natural tasks. Journal of Cognitive Neuroscience. 1995;7:66–80. doi: 10.1162/jocn.1995.7.1.66. [DOI] [PubMed] [Google Scholar]
- Binsted G, Chua R, Helsen W, Elliott D. Eye–hand coordination in goal-directed aiming. Human Movement Science. 2001;20:563–585. doi: 10.1016/s0167-9457(01)00068-9. [PubMed] [DOI] [PubMed] [Google Scholar]
- Binsted G, Elliott D. Ocular perturbations and retinal/extraretinal information: The coordination of saccadic and manual movements. Experimental Brain Research. 1999;127:193–206. doi: 10.1007/s002210050789. [PubMed] [DOI] [PubMed] [Google Scholar]
- Binsted G, Rolheiser TM, Chua R. Decay in visuo-motor representations during manual aiming. Journal of Motor Behavior. 2006;38:82–87. doi: 10.3200/JMBR.38.2.82-87. [PubMed] [DOI] [PubMed] [Google Scholar]
- Brouwer A-M, Knill DC. The role of memory in visually guided reaching. Journal of Vision. 2007;7:1–12. doi: 10.1167/7.5.6. http://journalofvision.org/7/5/6/, doi:10.1167/7.5.6. [PubMed] [Article] [DOI] [PubMed] [Google Scholar]
- Burbeck CA, Yap YL. Two mechanisms for localization? Evidence for separation-dependent and separation-independent processing of position information. Vision Research. 1990;27:739–750. doi: 10.1016/0042-6989(90)90099-7. [PubMed] [DOI] [PubMed] [Google Scholar]
- Carnahan H, Marteniuk RG. The temporal organization of hand, eye, and head movements during reaching and pointing. Journal of Motor Behavior. 1991;23:109–119. doi: 10.1080/00222895.1991.9942028. [PubMed] [DOI] [PubMed] [Google Scholar]
- Carnahan H, Marteniuk RG. Hand, eye, and head coordination while pointing to perturbed targets. Journal of Motor Behavior. 1994;26:135–146. doi: 10.1080/00222895.1994.9941668. [PubMed] [DOI] [PubMed] [Google Scholar]
- Elliott D, Madalena J. The influence of pre-movement visual information on manual aiming. Quarterly Journal of Experimental Psychology. 1987;39:541–559. doi: 10.1080/14640748708401802. [PubMed] [DOI] [PubMed] [Google Scholar]
- Ernst MO, Banks MS. Humans integrate visual and haptic information in a statistically optimal fashion. Nature. 2002;415:429–433. doi: 10.1038/415429a. [PubMed] [DOI] [PubMed] [Google Scholar]
- Flanagan JR, Johansson RS. Action plans used in action observation. Nature. 2003;424:769–771. doi: 10.1038/nature01861. [PubMed] [DOI] [PubMed] [Google Scholar]
- Gajewski DA, Henderson JM. Minimal use of working memory in a scene comparison task. Visual Cognition. 2005;12:979–1002. [Google Scholar]
- Gepshtein S, Banks MS. Viewing geometry determines how vision and haptics combine in size perception. Current Biology. 2003;13:483–488. doi: 10.1016/s0960-9822(03)00133-7. [PubMed] [DOI] [PubMed] [Google Scholar]
- Heath M, Westwood DA, Binsted G. The control of memory-guided reaching movements in peripersonal space. Motor Control. 2004;8:76–106. doi: 10.1123/mcj.8.1.76. [PubMed] [DOI] [PubMed] [Google Scholar]
- Henderson JM, Hollingworth A. High-level scene perception. Annual Review of Psychology. 1999;50:243–271. doi: 10.1146/annurev.psych.50.1.243. [PubMed] [DOI] [PubMed] [Google Scholar]
- Henderson JM, Hollingworth A. Global transsaccadic change blindness during scene perception. Psychological Science. 2003;14:493–497. doi: 10.1111/1467-9280.02459. [PubMed] [DOI] [PubMed] [Google Scholar]
- Hillis JM, Watt SJ, Landy MS, Banks MS. Slant from texture and disparity cues: Optimal cue combination. Journal of Vision. 2004;4(12):1, 967–992. doi: 10.1167/4.12.1. http://journalofvision.org/4/12/1/, doi:10.1167/4.12.1. [PubMed] [Article] [DOI] [PubMed] [Google Scholar]
- Irwin DE. Information integration across saccadic eye movements. Cognitive Psychology. 1991;23:420–456. doi: 10.1016/0010-0285(91)90015-g. [PubMed] [DOI] [PubMed] [Google Scholar]
- Knill DC, Saunders JA. Do humans optimally integrate stereo and texture information for judgments of surface slant? Vision Research. 2003;43:2539–2558. doi: 10.1016/s0042-6989(03)00458-9. [PubMed] [DOI] [PubMed] [Google Scholar]
- Landy MS, Kojima H. Ideal cue combination for localizing texture-defined edges. Journal of the Optical Society of America A. 2001;18:2307–2320. doi: 10.1364/josaa.18.002307. [PubMed] [DOI] [PubMed] [Google Scholar]
- Lemay M, Proteau L. A distance effect in a manual aiming task to remembered targets: a test of three hypotheses. Experimental Brain Research. 2001;140:357–368. doi: 10.1007/s002210100834. [PubMed] [DOI] [PubMed] [Google Scholar]
- Luck SJ, Vogel EK. The capacity of visual working memory for features and conjunctions. Nature. 1997;390:279–281. doi: 10.1038/36846. [PubMed] [DOI] [PubMed] [Google Scholar]
- McConkie GW, Currie CB. Visual stability across saccades while viewing complex pictures. Journal of Experimental Psychology: Human Perception and Performance. 1996;22:563–581. doi: 10.1037//0096-1523.22.3.563. [PubMed] [DOI] [PubMed] [Google Scholar]
- Neggers SF, Bekkering H. Ocular gaze is anchored to the target of an ongoing pointing movement. Journal of Neurophysiology. 2000;83:639–651. doi: 10.1152/jn.2000.83.2.639. [PubMed] [Article] [DOI] [PubMed] [Google Scholar]
- O’Regan JK. Solving the “real” mysteries of visual perception: The world as an outside memory. Canadian Journal of Psychology. 1992;46:461–488. doi: 10.1037/h0084327. [PubMed] [DOI] [PubMed] [Google Scholar]
- Pelz J, Hayhoe M, Loeber R. The coordination of eye, head and hand movements in a natural task. Experimental Brain Research. 2001;139:266–277. doi: 10.1007/s002210100745. [PubMed] [DOI] [PubMed] [Google Scholar]
- Rensink RA. Seeing, sensing and scrutinizing. Vision Research. 2000;40:1469–1487. doi: 10.1016/s0042-6989(00)00003-1. [PubMed] [DOI] [PubMed] [Google Scholar]
- Rensink RA, O’Regan JK, Clark JJ. To see or not to see: The need for attention to perceive changes in scenes. Psychological Science. 1997;8:368–373. [Google Scholar]
- Van Beers RJ, Haggard P, Wolpert DM. The role of execution noise in movement variability. Journal of Neurophysiology. 2004;91:1050–1063. doi: 10.1152/jn.00652.2003. [PubMed] [DOI] [PubMed] [Google Scholar]
- Whitaker K, Latham K. Disentangling the role of spatial scale, separation and eccentricity in Weber’s law for position. Vision Research. 1997;37:515–524. doi: 10.1016/s0042-6989(96)00202-7. [PubMed] [DOI] [PubMed] [Google Scholar]