

Abstract
An in situ freeze fracture device featuring a spring-loaded trap system has been designed and characterized for TOF SIMS analysis of single cells. The device employs the sandwich assembly, which is typically used in freeze fracture TOF SIMS experiments to prepare frozen, hydrated cells for high-resolution SIMS imaging. The addition of the spring-loaded trap system to the sandwich assembly offers two advances to this sample preparation method. First, mechanizing the fracture by adding a spring standardizes each fracture by removing the need to manually remove the top of the sandwich assembly with a cryogenically cooled knife. A second advance is brought about because the top of the sandwich is not discarded after the sandwich assembly has been fractured. This results in two imaging surfaces effectively doubling the sample size and providing the unique ability to image both sections of a cell bifurcated by the fracture. Here we report TOF SIMS analysis of freeze fractured rat pheochromocytoma (PC12) cells using a Bi cluster ion source. This work exhibits the ability to obtain single cell chemical images with sub-cellular lateral resolution from cells preserved in an ice matrix. In addition to preserving the cells, the signal from lipid fragment ions rarely identified in single cells are better observed in the freeze-fractured samples for these experiments. Furthermore, using the accepted argument that K+ signal indicates a cell that has been fractured though the cytoplasm, we have also identified different fracture planes of cells over the surface. Coupling a mechanized freeze fracture device to high-resolution cluster SIMS imaging will provide the sensitivity and resolution as well as the number of trials required to carry out biologically relevant SIMS experiments.
Keywords: mass spectrometry, imaging, single cell, phospholipids, membranes, sample preparation
INTRODUCTION
Time of Flight Secondary Ion Mass Spectrometry (TOF SIMS) is finding expanded use for biological samples 1–6. This technique uses a focused, primary ion beam to bombard a solid sample in ultra high vacuum, producing secondary ions from the sample surface. The secondary ions are electrostatically extracted into a TOF analyzer where they are separated by their mass to charge ratio. A mass spectral image is obtained by raster-scanning the pulsed, primary ion beam across the surface of the sample 7–9.
There are several examples where TOF SIMS has been used to image single cells 2–5, 10–12. Subcellular chemical localization of lipids has been used to elucidate answers to important biological questions. Lipid domains were identified in the protist mated Tetrahymena thermophila and were used to confirm that lipid rearrangement takes place during the fusion of two lipid membranes 2. Another study showed vitamin E localization in the cell somaneurite junction of the Aplysia californica, suggesting that there may be an undiscovered role for the molecule on the membrane of these cells 3. Additionally, TOF SIMS imaging has been used to measure the relative changes of cholesterol in the membrane of a single cell following the incubation of exogenous cholesterol 10. More recently, TOF SIMs has been used to demonstrate that membrane domains in mating Tetrahymena are formed in response to function rather than before the function 1. Despite these examples, it is still not trivial to investigate the chemistry in a single cell using TOF SIMS. The analysis area of a single cell is small, most mammalian cells range between 10 and 20 μm in diameter. This minimizes the amount of molecules present on the sample surface making it important to have as high a secondary ion yield as possible.
By use of cluster primary ions like Bi3+, the secondary ion yield of large organic fragments can be increased 13–15. It has also been shown that the presence of water increases the secondary ion yield of organic compounds 16, 17 and hydrated cells, even if they are frozen, are chemically more like native cells. Thus, use of frozen-hydrated samples might be important when looking at small targets with sample-limited amounts of ions.
TOF SIMS imaging is carried out under ultra high vacuum, leading to the development of several methods of sample preparation for biological samples 4, 6, 16, 18–21. One successful strategy has been to enter hydrated cells into the TOF SIMS instrument by freezing the sample in a sandwich formation 2, 10–12, 22, 23 and then to insert the assembly into the instrument. Once inside the vacuum, the sandwich is opened, freeze fracturing the sample and the sample is then transferred to the analysis chamber. By performing a freeze fracture inside the vacuum of the instrument, the sample surface is never in contact with the ambient atmosphere thereby minimizing the risk of contamination. However, water crystals can form inside the sample if it is not frozen very rapidly at low temperatures. Water crystals in the sample can cause rupture of membranes and the movement of molecules across the surface, thus making it difficult to preserve the molecules as they are in the native cell. This can be overcome by rapid freezing of the sample in liquid propane at liquid nitrogen temperature 24.
By enhancing the secondary ion yield of lipid fragments, phosphatidylethanolamine (PE), phosphatidylcholine (PC) and sphingomyelin (SM) can be better identified in single rat pheochromocytoma (PC12) cells. These phospholipids have been shown to be important in regulating the process of the neuronal cell communication, exocytosis. In exocytosis vesicles made of phospholipids, and filled with neurotransmitter, fuse with the plasma membrane of the cell. During this process, neurotransmitters are released to communicate between cells. PC12 cells are widely used as model cells for exocytosis 25. When incubated with exogenous phospholipids, exocytosis at these cells can change dynamically and quantitatively 26, 27. Incubation with phosphatidylethanolamine (PE) increased the rate of the exocytosis while phosphatidylcholine (PC) decreased it. Although PC is widely used when studying phospholipids in single cells 4, 5, 28, the analysis of the less abundant phospholipids PE and SM in TOF SIMS is more difficult than for PC. All these phospholipids fragment, however, when ionized and these fragments can be used for determination. The PE fragments of interest are at m/z 124 and 142. The PC fragments at m/z 184 and m/z 224 can be used to distinguish PC from SM, which does not show a fragment ion at 224. The discrimination is made more effective when the sample is prepared to expose the phospholipids without large amounts of salt or water on the surface. In general, for cell analysis we prefer to prepare samples with freeze-fracture, although there are cases where freeze-drying is also attractive.
Spring loaded designs based on a concept first developed by Ionoptika for installation in their new J105 dc beam chemical imager have previously been documented in the literature 29–31. In this paper, we present the characterization of an in situ freeze-fracture device which is a development of this original concept in which the freeze fracture is executed inside the analysis chamber of the TOF SIMS instrument by means of a spring and trap mechanism. The sample is sandwiched in the device, fast frozen in liquid propane, and mounted frozen onto a temperature cold stage made for the TOF SIMS IV instrument. The device is then brought into the analysis chamber of the instrument where opening the device fractures the sample. By fracturing the sample in situ the contamination risks are minimized, the frozen cells are preserved in their natural state and the presence of water during analysis enhances the secondary ion yield. Freeze fracture in vacuum has generally been carried out by manually fracturing a sandwich assembly with a liquid nitrogen cooled knife 11. Here the fracture is carried out inside the analysis chamber of the instrument on a temperature controlled stage allowing the sample to be fractured and kept at an optimized temperature. The temperature can further be controlled during the analysis and characterization of the sample. This freeze fracture device can also be used in any SIMS instrument although some adjustments to the instrument cold stage might be needed. In addition, splitting the sample into two sides allows both sides of the sandwich fracture to be analyzed in mirror images. Finally, the same sample can be analyzed following fracture, warmed and freeze dried for this analysis as well.
EXPERIMENTAL
Sample preparation
PC12 cells were cultured in supplemented RPMI -1640 medium in mouse collagen IV-coated flasks (Becton Dickinson, Bedford, MA). They were maintained at 37°C in a 7 % carbon dioxide atmosphere and subcultured every 7 days when confluent 32. Cells were harvested, when confluent, by gentle tapping of the flask and the cell suspension was centrifuged at 1500 rpm for 5 min. The supernatant was removed and the cells were resuspended in 10 mM HEPES at pH 7.4 (Figures 2–5) or RPMI with an addition of 5 μm beads (Figure 6–7) using 10–25% of the original volume to increase cell density.
Figure 2.
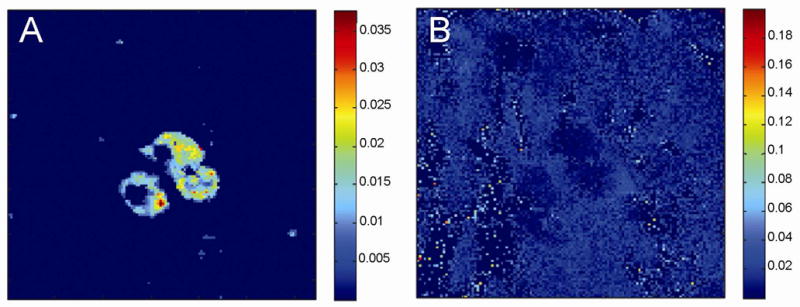
High lateral resolution image showing intra cellular structures in three PC12 cells. A) The image shows the distribution of the phosphocholine head group at m/z 184 and B) H30+ at m/z 19. The image was taken in burst alignment mode, 256×256 pixels with a current of 0.04 pA on the TOFSIMS IV instrument. The image was imported into MATLAB where it was normalized to tic, binned (2 × 2) and median filtrated (3 × 3). The lowest 15 % of the signal is not shown. The image area is 116 × 116 μm.
Figure 5.

Signal intensity in marked region of interest (ROI). A) Hydrated PC12 cells imaged at m/z 184, ROI marked by the circle B) Dried PC12 cells, at same position as in A, imaged at m/z 184. ROI marked by the circle C) Signal intensities from selected lipid fragments normalized to total ion signal are compared in the region of interest from A and B. D) Spectrum from ROI in panel A. E) Spectrum from ROI in panel B.
Figure 6.

The plane of fracture through the PC12 cells exposes different chemistry. A) An overlay of red (K+), blue (Na+) and green (PC fragment at m/z 184) is shown. Five ROI’s are marked in colored circles. The scale bar is 20 μm. B) Bar graph showing the intensity normalized to total ion current of four different ions. The color code in the graph follows that of the ROI in image 6A, giving the intensities of the ions in the different ROI’s. m/z 23 (Na+) and m/z 39 (K+) correspond to the y-axis on the left, m/z 86 (PC lipid fragment) and m/z 184 (PC lipid fragment) correspond to the y-axis on the right.
Figure 7.
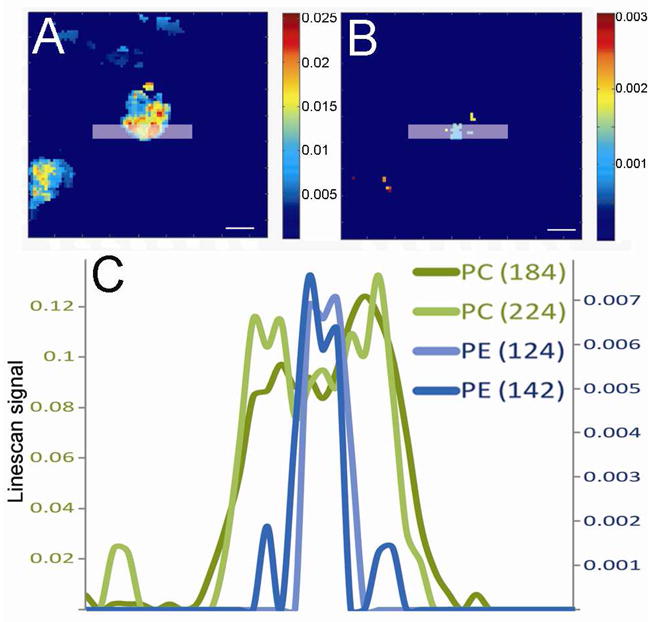
The distribution of A) m/z 184 and B) m/z 142 over a freeze fractionated hydrated PC12 cell. The image (raw data) was imported into MATLAB where it was normalized to total ion current, binned (3 × 3) and median filtrated (3 × 3). The lowest 15 % of the signal is not shown. Scale bar represents 10 μm. C) Graph of line scans from two PE fragments, at m/z 124 and 142, and two PC fragments, at m/z 184 and 224. The six pixels wide line scan was performed as marked in A) and B). The primary y-axis show PC data and the secondary y-axis show PE data. To fit the scale of the y-axis the data from PE at m/z 124 is multiplied by 3 and the data from PC at m/z 224 is multiplied by 9. The image was taken in burst alignment mode and the area of the image is 85 × 85 μm.
Si shards (Bare Silicon from SI-MAT) were manually cut to fit the freeze fracture device. The dimensions were approximately 2×8 mm (small) and 4×6 mm (big). The shards and the device were cleaned in n-heptane (Merck), acetone (VWR) and methanol (Fluka) in an ultrasonic bath prior to mounting the shards onto the device using stainless steel tabs to hold them in place. 2–3 μl of the cell suspension was deposited onto the small shard while holding the device at 37 °C. The device was then closed using a pair of tweezers and plunge frozen in liquid propane at −185 °C. The assembly was stored in liquid nitrogen until analysis. Before entering the device into the vacuum of the TOF SIMS IV instrument (ION-TOF GmbH) it was mounted onto the cold stage sample holder, under liquid nitrogen. Once in the analysis chamber the device was opened at −110° C by applying a moderate force to the lever of the device. The opening of the device engaged the spring-loaded swing arm and the sample was fractured through the ice. The presence of the spring improved reproducibility of the fracture. By having two shards mounted onto the device the analysis area was doubled after fracture, producing a sample surface on each shard. The sample was kept at −110 °C during analysis of the hydrated sample. In the instances when the sample was freeze-dried the temperature was raised up to −80 °C at a rate of 0.5 °C/s prior to analysis.
TOF SIMS Imaging
The TOF SIMS IV instrument (ION-TOF GmbH) was equipped with a Bi liquid metal cluster primary ion source. High resolution image data were recorded in burst alignment mode using Bi32+ primary ions, which have been shown to give a slightly higher lateral resolution that Bi3+ primary ions 15 enabling a lateral resolution of about 200 nm and a mass resolution (m/Δm) of about 300, with a pulsed current of 0.04 pA. High mass resolution imaging were recorded in bunched mode using Bi3+ primary ions, enabling a lateral resolution of about 4 μm and a mass resolution (m/Δm) of about 7,000, with a pulsed current of 0.1 pA. All images were recorded at 25 kV acceleration voltage, using electron flooding for charge neutralization and the accumulated primary ion dose was kept below the static limit at 4 × 10¹² ions/cm2. Images were recorded using 256 × 256 pixels.
Data treatment
All raw data has been collected and analyzed using the IonSpec and IonImage software (ION-TOF GmbH). For comparison of freeze fractured and freeze dried cells (figure 4 and 5) we used raw data. For the other figures data treatment has been done in MATLAB (The MathWorks) where the images have been binned and medium filtrated to optimize image quality.
Figure 4.

Localization of lipid fragments in freeze fractured hydrated PC12 cells. Images A to E were acquired on the hydrated sample (at −110° C) and images F to J after the sample was dried. Images A and F show the distribution of m/z 124, B and G of m/z 142, C and H of m/z 166, D and I of m/z 184, and E and J of m/z 224. All images were taken in bunched mode, 256×256 pixels and with a current of 0.1 pA. The images are taken directly from the ionimage software. The imaged area is 136 × 136 μm2.
RESULTS AND DISCUSSION
In Situ freeze fracture device
We have used a trap design to develop an in situ freeze fracture device. The device is constructed of copper, as it is highly conductive, enabling fast freezing of the sample as well as temperature control of the sample during analysis. Fast freezing is especially important when using hydrated cell samples since a slow freezing procedure can cause water crystals to form inside the cells, which could rupture the membranes and alter the morphology of the cells. Four stainless steel tabs are screwed onto the device to hold two silicon (Si) shards. It is important that the sizes of the Si shards are precise. The shards are manually cut and the approximate sizes are 2×8 mm (small) and 4×6 mm (big). A schematic of the device is shown in Figure 1 with the shards marked yellow. When the device is properly closed the two shards sandwich the sample in between them. The device is then plunge frozen in liquid propane and stored in liquid nitrogen until analysis. By keeping the sample frozen in between two Si shards the sample has no contact with the atmosphere prior to analysis, decreasing the risk of contamination. In Figure 1 the sample area between the two shards is shown as orange.
Figure 1.

Schematic of the freeze fracture device in an opened and a closed view. Screws holding the stainless steel tabs are colored red, silicon shards yellow and the sample area between the two shards orange. The two mounting holes are colored white.
The fracture device has been machined to fit the temperature controlled cold stage for the IonTof TOF SIMS IV instrument. The device is screwed onto the cold stage at liquid nitrogen temperature using the screw holes shown in white in Figure 1. The thermal contact between the device and the metal stage allows the temperature of the sample to be controlled and monitored, both during fracture and analysis, via a heater and a thermocouple incorporated into the cold stage.
The device hinge is spring loaded to facilitate opening in the chamber. Once the device is inside the analysis chamber of the instrument, the fracture is carried out by applying a moderate force to the lever of the device using an attachment to the sample entry arm. This causes the device to open, fracturing the ice matrix and exposing the embedded cells. This procedure reproducibly produces two, approximately, 2 × 4 mm ice surfaces for imaging. The use of a spring is also advantageous during sample preparation since it will cause a device, which is not properly closed, to open. Improper mounting of the silicon shards or incorrect position of the stainless steel tabs causes a small space between the shards, thickening the sample in the sandwich. The forces within the ice are fairly weak so to maximize the surface area of the water silicon interface the ice layer has to be thin in order to hold the sandwich together. However, if the volume of the sample is too large to be accommodated by the space between the shards, liquid will leak onto the copper surface of the device. In those instances ice was only found on one shard. This is probably due to the stronger interaction between copper and ice than Si - water and thus all the ice is pulled to one side during fracture.
The fracturing temperature of the sample is crucial 33. If the temperature is too high water will start evaporating almost immediately after the fracture resulting in freeze-dried sample. If the temperature is too low water will deposit onto the sample surface forming a layer of ice. We use −110° C as the fracturing temperature as this is the temperature where the sample is surrounded by ice but no ice appears to deposit onto the sample.
High resolution SIMS imaging of PC12 cells in a matrix of ice
PC12 cells are widely used as model systems for studying exocytosis and changes in the lipid composition of the membrane have been shown to affect the dynamics of exocytosis events 26, 27. The ability to get subcellular maps of lipid localization on the membrane surface would increase the understanding of the role certain lipids play in membrane fusion. However, the small size of PC12 cells, ranging between 10 and 20 μm, is challenging for SIMS imaging. By combining the use of the freeze fracture device and the Bi primary ion gun of the TOF SIMS instrument we show a high resolution TOF SIMS image of the phosphocholine (PC) head group at m/z 184 in three PC12 cells in Figure 2A. The fracture is through the center of the hydrated cells imaged, showing intracellular structures in the center, presumably the nucleus from the large size. Figure 2B displays the image of the ice matrix (m/z 19) in which the cells are embedded. There is a sharp interface between the ice and the PC demonstrating that the chemical distribution of PC has been preserved in the sample.
Mirror image capabilities
By using the freeze fracture device every fracture reproducibly produces two, approximately 2 × 4 mm, ice surfaces both containing part of the sample for imaging. This increases the analysis area twofold and, additionally, allows further interrogation of the fractured cells on both Si shards to examine both sides of a fracture. Figure 3 shows an example of mirror images of fractured PC12 cells. This procedure allows interrogation of cell fractures and the chemical distribution in different parts of the cell. The image marked A is from the larger shard and the image marked B from the small shard. Three cell clusters that are observed on each side have been zoomed in showing that the sample locations are a little bit shifted between the sides. In image A the signal intensity of the PC head group is higher so the pallet shows twice the intensity of the pallet in image B.
Figure 3.

Mirror image of several PC12 cells. A) Image of m/z 184 taken on the big shard with three cell clusters zoomed in. B) Image of m/z 184 taken on the same spot on the opposite shard. The images were imported into MATLAB where they were normalized to total ion current, binned (2 × 2) and median filtrated (2 × 2). The lowest 15 % of the signal in A) is not shown. The maximum intensity of the pallet in A) is twice the pallet in B). The images were recorded in burst alignment mode with a surface of 500 × 500 μm.
Comparing the zoomed in views they are not exact mirror images. As the head group at m/z 184 is imaged, and PC has the highest concentration in the outer leaflet of the cell membrane. When the cell fractures at the top of the cell membrane there is no PC observed on the mirror image. When the fracture instead is through the cell membrane of the cell some residual PC is observed in the mirror image. Although fracture plane can be determined in small samples by used of intracellular ions and lipid leaflet patterns, the area of the images in Figure 3 is large and therefore it is not used to elucidate the plane of fracture, which is likely different in different parts of the sample.
Increased lipid yields are observed in the hydrated freeze-fractured samples under the conditions reported
Use of the freeze fracture device mounted onto the temperature controlled cold stage enables temperature control of the sample during analysis. This makes it possible to increase the temperature of the fractured sample until water evaporates, leaving the sample dried, allowing for comparison of the lipid localization and signal intensities in the hydrated state with those after freeze drying on the same cell sample in the same position. It is important to mention that we have investigated the effect of hydration on lipid localization in PC12 cells, without optimizing the freeze drying procedure, and that larger cells have been examined successfully with freeze drying 3, 5, 21, 34. Here we have looked at the smaller PC12 cells and find it difficult to image these cells freeze dried in situ. Figure 4A–E shows images of freeze-fractured and hydrated cells and Figure 4F–J shows the same cells after increasing the temperature to −80 °C. This evaporates the water of the surface leaving the sample dry. The sample has been imaged in bunched mode to yield high mass resolution allowing accurate mass identification. Images A and F, column furthest to the left, show the image of the phosphoethanolamine (PE) headgroup minus H2O at m/z 124. Images B and G show the PE headgroup at m/z 142, images C and H show the PC headgroup minus H2O at m/z 166, images D and I show the PC headgroup at m/z 184 and images E and J, furthest to the right, show PC headgroup and part of the glycerol backbone at m/z 224. When comparing the hydrated images with those dried it is obvious that the different sample preparations result in significantly different effects in the localization of these lipid fragments. All PC fragments are localized to the same cells in the hydrated sample (C, D and E) but are not well localized in the dried sample (H, I and J). The PE fragments localize to the center cell in the hydrated sample (A and B) but not in the dried sample (F and G). The removal of water, using this procedure, might cause some rearrangement of molecules in the sample delocalizing lipids 23, 35.
The evidence suggests that repeated scans are not affecting the ionization efficiencies. The freeze-fractured image was scanned 50 times resulting in a primary ion dose of 1.7 × 10¹¹ ions/cm2, well below the static limit of 1013 ions/cm2. The sodium signal in the region of interest increases from 5.7 % of total ion current for the freeze-fractured sample to 19.7 % for the freeze-dried sample. This likely has an effect on lipid ionization too. The freeze-fractured sample image was scanned 50 times but the freeze-dried sample only 25 times, thus we used only the first 25 scans of the freeze-fractured image. We compared the first 25 scans to the second 25 scans on the freeze-fractured sample. A small decrease in lipid signal from the PC fragment ion at m/z 184, which has the highest signal-to-noise ratio, is observed after the first 25 scans (8%). However, the decrease in the same lipid signal for the freeze-dried sample was 87%. This suggests, but is still not proof, that there is a much larger influence from the presence of water, or perhaps from a lower level of Na+, than there is from reanalysis of the sample.
To further compare the samples in Figure 4, a region of interest has been marked around the center cell in the hydrated sample for the image at m/z 184 as shown in Figure 5A and likewise in 5B for the dried sample for m/z 184. The intensity of the lipid fragments in the region of interest (ROI) has been normalized to total ion current and plotted in Figure 5C. The plot shows that all of the lipid fragments in the hydrated sample (A) have a higher intensity than in the dried sample (B). In 5D and E the spectra of the hydrated and the dried sample are shown. It is possible that the fact that the sample is hydrated has resulted in the enhanced intensity of the lipid fragments from frozen hydrated sample as suggested by previous studies 16, 17, however in this case the loss of signal from the dispersion of molecules during freeze drying may contribute significantly to the difference between the two samples 17.
Chemistry in fracture planes
Using the freeze fracture device the fracture is made through the ice where the cells are embedded. The plane of fracture through the cells can vary. The identification of fraction planes on PC12 cells using TOF-SIMS has previously been discussed by Roddy et al 22. In short; one major indicator is that the K+ signal is high when the cells interior is exposed and the PC signal is high when the plasma membrane is exposed.
In Figure 6A we show an image recorded in burst alignment mode containing three clusters of cells. The image is an overlay of red, representing K+ at m/z 39, blue, representing Na+ at m/z 23, and green, representing the PC head group at m/z 184. The image shows no signs of smearing and a sharp interface between the cells make it possible to resolve individual cells within the cluster. Five areas of interest are marked around some cells within these cell clusters (red, green, blue, yellow and pink). The marked cells have been chosen so that some seem to have a higher intensity of potassium and some a higher intensity of the PC headgroup. The diagram in Figure 6B shows normalized ion intensities in these ROIs using the same color codes.
To determine the plane of fracture in the marked cells four diagnostic ions were chosen; Na+ at m/z 23, K+ at m/z 39, fragment at m/z 86 (C5H12N+ partially derived from the PC head group) and the PC head group at m/z 184 (C5H15NPO4+). These ions are represented in the graph and their intensities are normalized to total ion current. Several conclusions can be drawn. The K+ and the PC head group are anti-correlated showing which cells that are fractured through the interior and which cells are fractured at the cell membrane. Further, K+ and Na+ are anti-correlated as predicted from the cells natural environment, where K+ has a higher concentration inside the cell and Na+ has a higher concentration outside the cell. This localization indicates that the freeze-fracture process leaves the structural chemistry of the cells intact. Finally the PC head group and the PC fragment are correlated confirming PC membrane identification. The data indicate that the red and blue ROI’s represent cells fractured at the cell membrane level and the green, yellow and pink areas are cells fractured through their interior.
PE domain in a PC rich part of the PC12 cell
One goal in the development of the freeze fracture device was to be able to produce high resolution images of lipid species in the cell membrane of individual PC12 cells. The membrane components of these cells play an important role in exocytosis. Here we use the freeze fracture device to study the localization of PC and PE in a PC12 cell.
In Figure 7A the image of the PC head group at m/z 184 is shown and in Figure 7B the image of the PE head group at m/z 142 is shown. After importing into Matlab, a six pixel-wide line scan was performed over the cell, as marked in the images, and the resulting intensities of four ions are shown in the graph in Figure 7C. The ions composing the green lines are derived from PC species (at m/z 184 and at m/z 224) and the blue lines are derived from PE species (at m/z 142 and at m/z 124).
The decrease in the PC signals and the increase in PE signals are in the exact same place, suggesting that there is a PE domain in that region. The high PE signal is approximately 3 μm long and might result from the cell membrane being ruptured during the fracture, exposing the inner leaflet. Since the inner leaflet has a higher concentration of PE than the outer this can explain the PE domain. It is also possible that this region of the cell membrane is an active location for exocytosis. Such regions have been found in adrenal cells and PC12 cells 36, 37. It is possible that those regions have elevated PE levels in the cell membrane since it has been shown that PE accelerates exocytosis 26. The exact reason for this PE domain cannot be resolved by this one image, but it shows promise for future experiments with cells undergoing processes where the lipid domain structure changes and can be frozen for analysis.
Acknowledgments
This work was supported by grants from the National Institutes of Health (2R01EB002016-16 N.W./A.G.E and GM069338, N.W) and the Swedish Research Council (A.G.E.). The support of the UK Engineering and Physical Sciences Research Council (EPSRC) under its Life Sciences Initiative is gratefully acknowledged by JF and JCV. P.S. is supported by the Swedish Governmental Agency for Innovation Systems (VINNOVA). A.G.E. is supported as a Marie Curie Chair from the European Union 6th Framework. The authors thank Ulf Lanekoff for illustrations in Figure 1.
References
- 1.Kurczy ME, Piehowski PD, Van Bell CT, Heien ML, Winograd N, Ewing AG. Proc Nat Acad Sci USA. 2010;107:2751–2756. doi: 10.1073/pnas.0908101107. [DOI] [PMC free article] [PubMed] [Google Scholar]
- 2.Ostrowski SG, Van Bell CT, Winograd N, Ewing AG. Science. 2004;305:71–73. doi: 10.1126/science.1099791. [DOI] [PMC free article] [PubMed] [Google Scholar]
- 3.Monroe EB, Jurchen JC, Lee J, Rubakhin SS, Sweedler JV. J Am Chem Soc. 2005;127:12152–12153. doi: 10.1021/ja051223y. [DOI] [PubMed] [Google Scholar]
- 4.Sjovall P, Lausmaa J, Nygren H, Carlsson L, Malmberg P. Anal Chem. 2003;75:3429–3434. doi: 10.1021/ac0207675. [DOI] [PubMed] [Google Scholar]
- 5.Fletcher JS, Rabbani S, Henderson A, Blenkinsopp P, Thompson SP, Lockyer NP, Vickerman JC. Anal Chem. 2008;80:9058–9064. doi: 10.1021/ac8015278. [DOI] [PubMed] [Google Scholar]
- 6.Altelaar AFM, Klinkert I, Jalink K, de Lange RPJ, Adan RAH, Heeren RMA, Piersma SR. Anal Chem. 2006;78:734–742. doi: 10.1021/ac0513111. [DOI] [PubMed] [Google Scholar]
- 7.Benningh A. Zeitschrift Fur Physik. 1970;230:403. [Google Scholar]
- 8.Standing KG, Beavis R, Ens W, Schueler B. Int J Mass Spectrom Ion Processes. 1983;53:125–134. [Google Scholar]
- 9.Vickerman JC, Briggs D. ToF-SIMS: Surface Analysis by Mass Spectrometry. IM Publications and SurfaceSpectra Ltd; Chichester, West Sussex: 2001. [Google Scholar]
- 10.Ostrowski SG, Kurczy ME, Roddy TP, Winograd N, Ewing AG. Anal Chem. 2007;79:3554–3560. doi: 10.1021/ac061825f. [DOI] [PMC free article] [PubMed] [Google Scholar]
- 11.Colliver TL, Brummel CL, Pacholski ML, Swanek FD, Ewing AG, Winograd N. Anal Chem. 1997;69:2225–2231. doi: 10.1021/ac9701748. [DOI] [PubMed] [Google Scholar]
- 12.Cliff B, Lockyer N, Jungnickel H, Stephens G, Vickerman JC. Rapid Commun Mass Spectrom. 2003;17:2163–2167. doi: 10.1002/rcm.1169. [DOI] [PubMed] [Google Scholar]
- 13.Winograd N. Anal Chem. 2005;77:142A–149A. doi: 10.1021/ac051263k. [DOI] [PubMed] [Google Scholar]
- 14.Weibel D, Wong S, Lockyer N, Blenkinsopp P, Hill R, Vickerman JC. Anal Chem. 2003;75:1754–1764. doi: 10.1021/ac026338o. [DOI] [PubMed] [Google Scholar]
- 15.Touboul D, Kollmer F, Niehuis E, Brunelle A, Laprevote O. J Am Chem Soc. 2005;16:1608–1618. doi: 10.1016/j.jasms.2005.06.005. [DOI] [PubMed] [Google Scholar]
- 16.Piehowski PD, Kurczy ME, Willingham D, Parry S, Heien ML, Winograd N, Ewing AG. Langmuir. 2008;24:7906–7911. doi: 10.1021/la800292e. [DOI] [PMC free article] [PubMed] [Google Scholar]
- 17.Conlan XA, Lockyer NP, Vickerman JC. Rapid Commun Mass Spectrom. 2006;20:1327–1334. doi: 10.1002/rcm.2446. [DOI] [PubMed] [Google Scholar]
- 18.Quong JN, Knize MG, Kulp KS, Wu KJ. Appl Surf Sci. 2004;231:424–427. [Google Scholar]
- 19.Parry S, Winograd N. Anal Chem. 2005;77:7950–7957. doi: 10.1021/ac051263k. [DOI] [PubMed] [Google Scholar]
- 20.Brunelle A, Laprevote O. Curr Pharm Design. 2007;13:3335–3343. doi: 10.2174/138161207782360618. [DOI] [PubMed] [Google Scholar]
- 21.Malm J, Giannaras D, Riehle MO, Gadegaard N, Sjovall P. Anal Chem. 2009;81:7197–7205. doi: 10.1021/ac900636v. [DOI] [PubMed] [Google Scholar]
- 22.Roddy TP, Cannon DM, Ostrowski SG, Winograd N, Ewing AG. Anal Chem. 2002;74:4020–4026. doi: 10.1021/ac025574w. [DOI] [PubMed] [Google Scholar]
- 23.Chandra S, Bernius MT, Morrison GH. Anal Chem. 1986;58:493–496. doi: 10.1021/ac00293a053. [DOI] [PubMed] [Google Scholar]
- 24.Severs NJ, Shotton D. Rapid Freezing, Freeze Fracture, and Deep Etching. Wiley-Liss; New York: 1995. [Google Scholar]
- 25.Westerink RHS, Ewing AG. Acta Physiologica. 2008;192:273–285. doi: 10.1111/j.1748-1716.2007.01805.x. [DOI] [PMC free article] [PubMed] [Google Scholar]
- 26.Uchiyama Y, Maxson MM, Sawada T, Nakano A, Ewing AG. Brain Res. 2007;1151:46–54. doi: 10.1016/j.brainres.2007.03.012. [DOI] [PMC free article] [PubMed] [Google Scholar]
- 27.Amatore C, Arbault S, Bouret Y, Guille M, Lemaitre F, Verchier Y. Chem BioChem. 2006;7:1998–2003. doi: 10.1002/cbic.200600194. [DOI] [PubMed] [Google Scholar]
- 28.Roddy TP, Cannon DM, Meserole CA, Winograd N, Ewing AG. Anal Chem. 2002;74:4011–4019. doi: 10.1021/ac0255734. [DOI] [PubMed] [Google Scholar]
- 29.Fletcher JS, Lockyer NP, Vickerman JC. Mass Spectrom Rev. 2010 doi: 10.1002/mas.20275. [DOI] [PubMed] [Google Scholar]
- 30.Rabbani S, Vickerman JC, Lockyer N, Fletcher JS. Surf Interface Anal. 2010 [Google Scholar]
- 31.Lanekoff I, Kurczy ME, Adams KL, Malm J, Karlsson R, Sjovall P, Ewing AG. Surf Interface Anal. 2010 [Google Scholar]
- 32.Kozminski KD, Gutman DA, Davila V, Sulzer D, Ewing AG. Anal Chem. 1998;70:3123–3130. doi: 10.1021/ac980129f. [DOI] [PubMed] [Google Scholar]
- 33.Cannon DM, Pacholski ML, Winograd N, Ewing AG. J Am Chem Soc. 2000;122:603–610. [Google Scholar]
- 34.Nygren H, Hagenhoff B, Malmberg P, Nilsson M, Richter K. Microsc Res Tech. 2007;70:969–974. doi: 10.1002/jemt.20502. [DOI] [PubMed] [Google Scholar]
- 35.Chandra S, Smith DR, Morrison GH. Anal Chem. 2000;72:104A–114A. doi: 10.1021/ac002716i. [DOI] [PubMed] [Google Scholar]
- 36.Schroeder TJ, Jankowski JA, Senyshyn J, Holz RW, Wightman RM. J Biol Chem. 1994;269:17215–17220. [PubMed] [Google Scholar]
- 37.Zhang B, Adams KL, Luber SJ, Eves DJ, Heien ML, Ewing AG. Anal Chem. 2008;80:1394–1400. doi: 10.1021/ac702409s. [DOI] [PMC free article] [PubMed] [Google Scholar]