Abstract
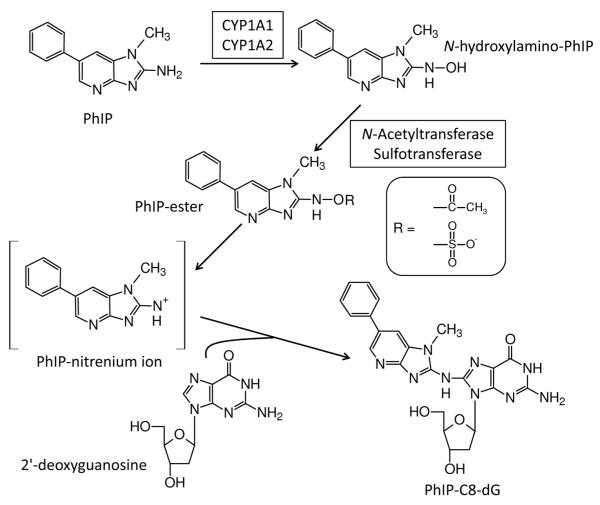
The heterocyclic aromatic amine, 2-amino-1-methyl-6-phenylimidazo[4,5-b]pyridine (PhIP) is formed by the grilled cooking of certain foods such as meats, poultry and fish. PhIP has been shown to induce tumours in the colon, prostate and mammary glands of rats and is regarded as a potential human dietary carcinogen. PhIP is metabolically activated via cytochrome P450 mediated oxidation to an N-hydroxylamino-PhIP intermediate that is subsequently converted to an ester by N-acetyltransferases or sulfotransferases and undergoes heterolytic cleavage to produce a PhIP-nitrenium ion, which reacts with DNA to form the N-(deoxyguanosin-8-yl)-2-amino-1-methyl-6-phenylimidazo[4,5-b]pyridine (PhIP-C8-dG) adduct. Thus far, the detection and quantification of PhIP-DNA adducts has relied to a large extent on 32P-postlabelling methodologies. In order to expand the array of available techniques for the detection and improved quantification of PhIP-C8-dG adducts in DNA we have developed an online column-switching liquid chromatography (LC)-electrospray ionization (ESI)-tandem mass spectrometry (MS/MS) selected reaction monitoring (SRM) method incorporating an isotopically [13C10]-labelled PhIP-C8-dG internal standard for the analysis of DNA enzymatically hydrolysed to 2′-deoxynucleosides. A dose-dependent increase was observed for PhIP-C8-dG adducts when salmon testis DNA was reacted with N-acetoxy-PhIP. Analysis of DNA samples isolated from colon tissue of mice treated by oral gavage daily for 5 days with 50 mg/kg body weight of PhIP resulted in the detection of an average level of 14.8 ± 3.7 PhIP-C8-dG adducts per 106 2′-deoxynucleosides. The method required 50 μg of hydrolysed animal DNA on column and the limit of detection for PhIP-C8-dG was 2.5 fmol (1.5 PhIP-C8-dG adducts per 108 2′-deoxynucleosides). In summary, the LC-ESI-MS/MS SRM method provides for the rapid automation of the sample clean up and a reduction in matrix components that would otherwise interfere with the mass spectrometric analysis, with sufficient sensitivity and precision to analyse DNA adducts in animals exposed to PhIP.
Introduction
The heterocyclic aromatic amine (HAA), 2-amino-1-methyl-6-phenylimidazo[4,5-b]pyridine (PhIP) is formed following the pyrolysis of amino acids and reaction with sugars in the presence of creatine/creatinine during the grilled cooking of certain foods, such as meats, poultry and fish [1-5]. PhIP represents one of the most abundantly formed of more than 20 HAAs that have been shown to be mutagenic in bacterial assays as well as mammalian cells [3,5]. The carcinogenic properties of HAAs have been demonstrated in rodent bioassays following long-term feeding studies [6]. PhIP has been found to induce tumours in the colon, prostate and mammary glands of rats, which represent the principal sites that are associated with human dietary related cancer implying that it could be a human carcinogen [3,4,7-9]. The International Agency for Research on Cancer (IARC) has classified PhIP as a group 2B carcinogen (possibly carcinogenic to humans) [10].
The genotoxicity of PhIP is related to metabolic activation resulting in an electrophilic species that is capable of generating covalent DNA adducts [1]. PhIP undergoes an initial oxidation step to an N-hydroxylamino-PhIP intermediate which is mediated by cytochrome (CYP) P450 enzymes, primarily by CYP1A2 in humans [11-13]. Subsequent metabolism by N-acetyltransferases (NAT) or sulfotransferases (SULT) converts the N-hydroxylamino-PhIP into an ester capable of undergoing heterolytic cleavage to produce a PhIP-nitrenium ion, which is the ultimate reactive species that reacts with DNA (Scheme 1) [5,13,14]. The major covalent DNA adduct detected in vivo resulting from the exposure of experimental animals and humans to PhIP is N-(deoxyguanosin-8-yl)-2-amino-1-methyl-6-phenylimidazo[4,5-b]pyridine (PhIP-C8-dG) [14,15].
Scheme 1.
Bioactivation of PhIP and DNA adduct formation.
Numerous methods have been developed for the detection of PhIP-derived DNA adducts, which include 32P-Postlabelling in combination with thin layer chromatography (TLC) or high performance liquid chromatography [16-20], immunological methods [7,9], gas chromatography-mass spectrometry following alkaline hydrolysis of PhIP adducts to the parent amine [21,22] and accelerator mass spectrometry [23-25]. 32P-Postlabelling has been the most widely used method for the detection of PhIP-DNA adducts in animal and human tissues offering the advantage that only small amounts of DNA are required for analysis. The development of electrospray ionization (ESI) has permitted the coupling of liquid chromatography (LC) to mass spectrometry (MS), which has been used for the detection of numerous DNA adducts [26]. LC-mass spectrometry has made sufficient gains in sensitivity for the detection of DNA adducts resulting in it being a viable alternative to other detection methods such as 32P-postlabelling and immunoassays, to provide more accurate and precise results through the use of stable isotope internal standards [27,28]. Recently, LC-tandem mass spectrometry (MS/MS) methods using deuterated stable isotope internal standards and off-line pre-purification of the PhIP-C8-dG adduct using solid phase extraction or online column-switching LC have been described for the detection and quantitation of adducts in cells and DNA treated in vitro with PhIP, and also in the liver and colon of rats treated in vivo with PhIP [20,22,29-31]. Mass spectrometry based methods offer a number of advantages with respect to the identification and quantitation of DNA adducts, as they rely on the detection of adduct-specific ions and characteristic transitions of the ions being monitored, respectively, and because quantification is based upon the use of isotopically-labelled internal standards.
We describe the development of a method involving online column-switching LC-MS/MS using selected reaction monitoring (SRM) for the determination of PhIP-C8-dG in DNA that has been enzymatically hydrolysed to 2′-deoxynucleosides. This newly developed method allows for the rapid automation of the sample clean up and a reduction in matrix components that would otherwise interfere with the mass spectrometric analysis. We applied this method to the detection of PhIP-C8-dG adducts in DNA samples from salmon testis DNA treated with different concentrations of N-acetoxy-PhIP in vitro and DNA obtained from mouse colon tissue following dosing with PhIP.
Experimental Procedures
Chemicals and Reagents
PhIP was acquired from Toronto Research Chemicals (North York, Ontario, Canada), and [13C10]-2′-deoxyguanosine was purchased from Cambridge Isotope Laboratories (Andover, MA). All other reagents used in the preparation of the DNA adduct standards and in vitro modified DNA samples were of the highest available purity and purchased from Sigma-Aldrich (St. Louis, MO). Caution: PhIP and its derivatives are mutagens and carcinogens and should be handled with care. Protective clothing should be worn and appropriate safety procedures followed when working with these compounds. Salmon testis DNA, deoxyribonuclease I (from bovine pancreas), snake venom phosphodiesterase I (from Crotalus adamanteus), alkaline phosphatase (from E. coli) and mass spectrometry grade formic acid were purchased from Sigma (Poole, UK). HPLC grade water, 18.2 MΩcm output quality was obtained from Maxima purification equipment (Elga, High Wycombe, UK). All other reagents (analytical grade) and HPLC grade acetonitrile were purchased from Fisher Scientific (Loughborough, UK).
Synthesis of N-acetoxy-2-amino-1-methyl-6-phenylimidazo[4,5-b]pyridine (N-acetoxy-PhIP)
2-hydroxyamino-1-methyl-6-phenylimidazo[4,5-b]pyridine (N-hydroxylamino-PhIP) was prepared as described previously, by diazotization of PhIP and reaction with sodium nitrite followed by catalytic reduction of the nitro derivative thus obtained with Pd/C to the N-hydroxylamine. [32] The hydroxylamine was acetylated as described previously to afford N-acetoxy-PhIP. [14] Given the expected instability of N-acetoxy-PhIP, it was used without any further purification.
Preparation of unlabelled and isotopically labelled N-(deoxyguanosin-8-yl)-2-amino-1-methyl-6-phenylimidazo[4,5-b]pyridine adduct standards
The PhIP-C8-dG adduct standards were prepared as described previously [14], by reacting the crude acetylation mixtures containing N-acetoxy-PhIP with solutions of 2′-deoxyguanosine or [13C10]-2′-deoxyguanosine. Unlabelled and [13C10]-labelled PhIP-C8-dG thus obtained were purified by reverse-phase HPLC [14]. The identity and purity of the unlabelled PhIP-C8-dG was confirmed by 1H NMR and ESI-MS/MS (data not shown). The adduct standard solutions were quantified by UV spectrophotometry, based upon an extinction coefficient of ε = 33,300 M−1cm−1 at λmax 360 nm. [22]
Preparation of salmon testis DNA samples modified in vitro with N-acetoxy-2-amino-1-methyl-6-phenylimidazo[4,5-b]pyridine
A range of DNA samples with different levels of in-vitro modification were prepared by adding serial 10-fold dilutions of N-acetoxy-PhIP in THF to solutions of salmon testis DNA (1 mg/mL in 25 mM phosphate buffer, pH 7.0). The estimated concentrations of the N-acetoxy-PhIP in the reaction mixtures ranged from ca. 0.0001 mg/mL to 0.1 mg/mL. The reaction mixtures were incubated overnight at 37°C, extracted with 1 volume of ethyl acetate then 1 volume of water-saturated n-butanol, and then DNA was precipitated by addition of 0.1 volume of 5 M NaCl and 2 volumes of ice-cold ethanol. DNA samples were centrifuged, the pellets thus obtained were washed twice with 5 mL of ice-cold ethanol/water (70:30, v/v) and the residues finally obtained upon centrifugation were redissolved in 5 mM BisTris buffer, pH 7.1, 0.1 mM EDTA, allowing an overnight rehydration at 4°C before freezing the samples at −80°C until further use. The DNA concentrations in the final solutions were determined by UV spectrophotometry.
Enzymatic hydrolysis of in vitro modified salmon testis DNA for LC-ESI-MS/MS analysis
Each of the in vitro modified salmon testis DNA samples (400 μg) was evaporated to dryness using a centrifugal vacuum evaporator. The dried DNA samples were dissolved in 990 μL of 50 mM BisTris, 0.1 mM EDTA, pH 7.1 buffer plus 10 μL of 1 M MgCl2 and incubated with 100 μL of deoxyribonuclease I (2 mg/mL dissolved in 0.15 M NaCl, 10 mM MgCl2) at 37°C for 6 h. The samples were further incubated with 80 μL of snake venom phosphodiesterase I from Crotalus adamanteus (0.001 U/μL dissolved in 0.11 M Tris-HCl, 0.11 M NaCl, 15 mM MgCl2, pH 8.9) and 26.2 μL of alkaline phosphatase from E. coli (0.305 U/μL) at 37°C for 15 h. The hydrolysed DNA samples were centrifuged at 14,000 rpm for 1 min and the supernatants transferred to new microfuge tubes for storage at −80°C. Aliquots of the hydrolysed DNA samples were removed to which were added 1333.3 fmol of the [13C10]-labelled PhIP-C8-dG internal standard (100 fmol/μL) and evaporated to dryness using a centrifugal vacuum evaporator. The dried samples were dissolved in 20 μL of HPLC grade water/methanol (80:20, v/v), centrifuged at 14,000 rpm for 2 min and transferred to HPLC vials with low volume inserts. A 15 μL aliquot of each sample was injected on to the online column switching LC-ESI-MS/MS, equivalent to 5 or 10 μg of hydrolysed DNA depending on the extent of modification by PhIP with 1000 fmol of the [13C10]-labelled PhIP-C8-dG internal standard on column.
Treatment of animals
Porlox/lox/CreCYP1A1 mice on a C57BL/6 background (Reductase Inducible Cre, RIC) were bred in-house at the Biomedical Research Institute, Dundee [33]. In these mice the cytochrome P450 oxidoreductase (Por) gene can be deleted tissue-specifically after the administration of chemical inducers (e.g. 3-methylcholanthrene) of CYP1A1. However, in the absence of the chemical inducer (as in the present study), these mice are phenotypically normal and indistinguishable from wild-type animals. Adult female RIC mice, > 3 weeks old, were dosed by oral gavage daily for 5 days with 50 mg/kg body weight of PhIP dissolved in corn oil. Control animals were dosed with corn oil alone. Animals were sacrificed and the colon tissue was removed. DNA isolation was performed by using standard phenol/chloroform extraction. All animal experiments were carried out under license in accordance with the law, and following local ethical review.
Enzymatic hydrolysis of animal DNA for LC-ESI-MS/MS analysis
Prior to enzymatic digestion 1333.3 fmol of the [13C10]PhIP-C8-dG internal standard (100 fmol/μL) was added to 66.7 μg of the mouse DNA samples and evaporated to dryness using a centrifugal vacuum evaporator. The dried DNA samples were dissolved in 99 μL of 50 mM BisTris, 0.1 mM EDTA, pH 7.1 buffer plus 1.0 μL of 1 M MgCl2 and incubated with 10 μL of deoxyribonuclease I (2 mg/mL dissolved in 0.15 M NaCl, 10 mM MgCl2) at 37°C for 6 h. The samples were further incubated with 6.0 μL of snake venom phosphodiesterase I from Crotalus adamanteus (0.001 U/μL dissolved in 0.11 M Tris-HCl, 0.11 M NaCl, 15 mM MgCl2, pH 8.9) and 3.18 μL of alkaline phosphatase from E. coli (0.315 U/μL) at 37°C for 15 h. The hydrolysed DNA samples were centrifuged at 14,000 rpm for 2 min and the supernatant transferred to a new eppendorf tube and then evaporated to dryness using a centrifugal vacuum evaporator. The dried samples were dissolved in 20 μL of HPLC grade water/methanol (80:20, v/v) and transferred to HPLC vials with low volume inserts. A 15 μL aliquot of each sample, equivalent to 50 μg of hydrolysed DNA and 1000 fmol of the [13C10]PhIP-C8-dG internal standard on column was injected on to the online column switching LC-ESI-MS/MS.
Online column-switching LC-ESI-MS/MS analysis
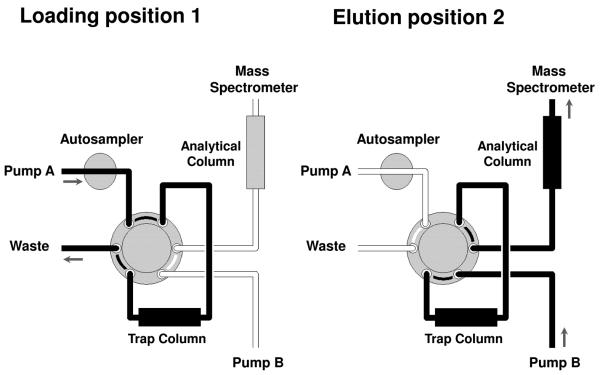
The online column switching valve system consisted of an automated switching valve (motorized two-position six-port valve, Waters Ltd., Hertfordshire, UK) connected to pump A incorporating an autosampler (Waters Alliance 2695 separations module with a 100 μL injection loop) and an isocratic pump B (Gynotek GmbH, Germering, Germany). Pump A was connected via the switching valve to the trap column, a Synergi Fusion-RP 80A C18, 4 μm, 30 × 2.0 mm column attached to a KrudKatcher disposable pre-column (0.5 μm) filter (Phenomenex, Macclesfield, UK) and Pump B was connected via the switching valve to the analytical column, a Synergi Fusion-RP 80A C18 (4 μm, 250 × 2.0 mm) column attached to a Synergi Fusion-RP 80A C18 (4 μm, 4.0 × 2.0 mm) guard column and KrudKatcher disposable pre-column (0.5 μm) filter. The outlet of the analytical column was directly connected to the mass spectrometer. The configuration of the online column switching valve system is summarised in Figure 1.
Figure 1.
Schematic representation of the online column-switching system.
Sample loading
A 15-μL aliquot of the in vitro modified (equivalent to 5 or 10 μg of hydrolysed DNA) or animal (equivalent to 50 μg of hydrolysed DNA) DNA sample containing 1000 fmol of [13C10]PhIP-C8-dG internal standard was injected onto the trap column using pump A with the switching valve in position 1. The impurities on the trap column were eluted to waste using a gradient with solvent A, 0.1% formic acid/HPLC grade water (0.1:99.9, v/v) and solvent B, 0.1% formic acid/acetonitrile (0.1:99.9, v/v) at a flow rate of 120 μL/min. The following gradient was used: 0 min–15%B, 5 min–15%B, 15 min–65%B, 24 min–65%B, 24.1 min–15%B, 40 min–15%B. Concurrently isocratic flow at 120 μL/min via the analytical column, which was eluted with 0.1% formic acid/acetonitrile (0.1% formic acid) (75:25, v/v), was maintained to the mass spectrometer by means of pump B.
Sample elution
At 12.0 min the switching valve was switched to position 2 allowing the purified PhIP-C8-dG adduct to be back-flushed from the trap column onto the analytical column and then subsequent elution into the mass spectrometer. The isocratic flow was maintained by pump B at flow rate of 120 μL/min with 0.1% formic acid/ acetonitrile (0.1% formic acid) (75:25, v/v) for 12.0 min. Concurrently the flow from pump A bypassed the trap column and was diverted directly to waste. At 24.0 min the switching valve was switched back to position 1 and the configuration of the online column switching system reverted back to initial conditions as described for the sample loading above. The total run time was 40 min.
Mass spectrometry
A Waters Micromass Quattro Ultima Pt (Micromass, Waters Ltd., Manchester, UK) tandem quadrupole mass spectrometer with an electrospray interface was used. The temperature of the electrospray source was maintained at 120°C and the desolvation temperature at 350°C. Nitrogen gas was used as the desolvation gas (650 L/h) and the cone gas (25 L/h). The capillary voltage was set at 3.20V. The cone and RF1 lens voltages were 42 V and 15 V, respectively. The collision gas was argon (indicated cell pressure 2.0 × 10⁻³ mbar) and the collision energy set at 12 eV. The dwell time was set to 200 ms and the resolution was two m/z units at peak base. The mass spectrometer was tuned by using a standard solution of PhIP-C8-dG (10 pmol/μL) in 0.1% formic acid/acetonitrile (0.1% formic acid) (75:25, v/v) introduced by continuous infusion at a flow rate of 10 μL/min with a Harvard model 22 syringe pump (Havard Apparatus Ltd., Edenbridge, UK). The hydrolysed DNA samples were analysed in positive ESI MS/MS selected reaction monitoring (SRM) mode for the [M+H]+ ion to base [B+H2]+ transitions of m/z 490 to 374 for PhIP-C8-dG and m/z 500 to 379 for [13C10]PhIP-C8-dG. The level of the adduct in the DNA samples was determined from the ratio of peak area of the [13C10]PhIP-C8-dG internal standard.
Calibration curve for PhIP-C8-dG adducts with DNA matrix
The calibration curvess were constructed by the addition of different amounts of the unlabelled PhIP-C8-dG standards (ranging from 2.0 to 4000 fmol) plus 1000 fmol of the [13C10]PhIP-C8-dG internal standard to 50 μg of enzymatically hydrolysed calf thymus DNA as the matrix. The standards were subjected to the online column switching LC-ESI-MS/MS analysis procedure as described above.
Results
Validation of the online column switching LC-ESI-MS/MS analysis
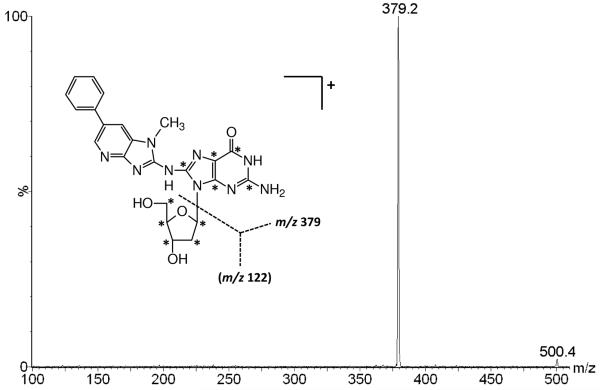
Accurate DNA adduct quantitation by mass spectrometry is best achieved by coupling selected reaction monitoring (SRM) with the use of stable isotope-labelled internal standards. Mass spectrometric analysis of the [13C10]PhIP-C8-dG internal standard was performed in positive mode LC-ESI-MS/MS using the trap column only and resulted in a typical product ion spectrum that is normally observed for adducted 2′-deoxynucleosides following the neutral loss (121 u) of the [13C5]-labelled 2′-deoxyribose moiety. The 13C-labelled atoms were equally distributed between the adducted base and 2′-deoxyribose moiety of the molecule as shown in Figure 2. The collision induced dissociation (CID) product ion mass spectrum consisted of the adducted base as being the most abundant product ion formed from the [M+H]+ ion at m/z 500. The adducted base product ion [B+H2]+ at m/z 379 was formed by the cleavage of the glycosidic bond and the accompanied proton transfer from the 2′-deoxyribose moiety to the adducted base (Figure 2). A similar fragmentation pattern with the m/z decreased by 5 for the adducted base product ion [B+H2]+ was observed for the corresponding unlabelled PhIP-C8-dG standard [M+H]+ ion. [13C10]PhIP-C8-dG was chemically pure as determined by HPLC-UV and no unlabelled adduct was detectable in the isotopic standard solutions as determined by LC-ESI-MS/MS SRM.
Figure 2.
Positive LC-ESI-MS/MS CID product ion spectrum of the [13C10]PhIP-C8-dG internal standard. The spectrum was acquired following gradient elution of the trap column with solvent A, 0.1% formic acid and solvent B, acetonitrile (0.1% formic acid) at a flow rate of 120 μL/min (the asterisks indicate the 13C labelled sites)
Initial experiments involved optimisation of the mobile phase conditions for the separation of the PhIP-C8-dG adduct on the trap column from unmodified 2′-deoxynucleosides and matrix impurities. A gradient mobile phase system consisting of 0.1% formic acid and acetonitrile (0.1% formic acid) was found to give the optimal separation on the trap column with a retention time of 14.16 min for PhIP-C8-dG. The online column switching valve system was configured as shown in Figure 1 and the switching valve was switched to position 2 at 12.0 min following injection of the hydrolysed DNA sample. This allowed for unmodified 2′-deoxynucleosides plus any other matrix impurities that may have been present to be eluted to waste while the PhIP-C8-dG adduct was back-flushed onto the analytical column for analysis by the mass spectrometer.
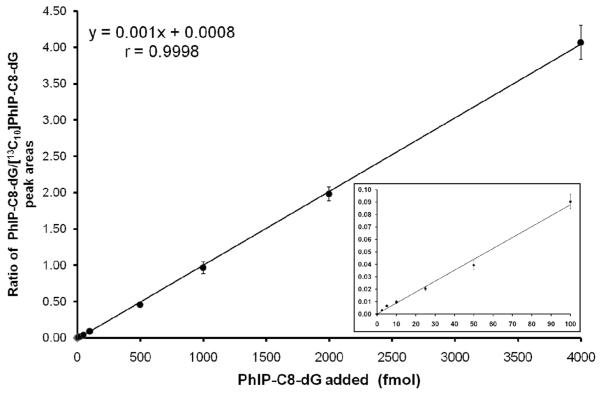
A typical online column-switching LC-MS/MS calibration curve for the detection of PhIP-C8-dG is shown in Figure 3. The calibration curve was obtained by adding different amounts of the PhIP-C8-dG standard with 1000 fmol of the [13C10]PhIP-C8-dG internal standard to 50 μg of enzymatically hydrolysed calf thymus DNA to account for any matrix effects.. A linear response over the range from 2.5 to 4000 fmol, corresponding to 1.5 to 2,469.1 adducts per 108 2′-deoxynucleosides (Figure 3), was obtained for the detection of PhIP-C8-dG with a correlation coefficient (r) of 0.9998 (y = 0.001x-0.0008). The limit of detection on column of the method was 2.5 fmol (S/N = 3) corresponding to 1.5 PhIP-C8-dG adducts per 108 2′-deoxynucleosides and the lower limit of quantitation was 10.0 fmol (S/N = 8) obtained by spiking the PhIP-C8-dG adduct and the labelled internal standard into calf thymus DNA (50 μg) enzymatic hydrolysate. The intra- and inter-assay coefficients of variation of the online column-switching LC-ESI-MS/MS method, which were obtained following the analysis of calf thymus spiked with 25, 100 and 1000 fmol of the PhIP-C8-dG standard are shown in Table 1. The average accuracy of the method, determined by spiking known amounts (2.5 to 4000 fmol) of the PhIP-C8-dG adduct and 1000 fmol of the [13C10]PhIP-C8-dG internal standard in calf thymus DNA enzymatic hydrolysate was 100.2%.
Figure 3.
Online column-switching LC-MS/MS SRM calibration curve for the detection of PhIP-C8-dG (error bars represent the standard deviation, n = 3). The ratio of the peak area of the PhIP-C8-dG standard to that of the [13C10]PhIP-C8-dG internal standard spiked into 50 μg on column of calf thymus DNA subjected to enzymatic hydrolysis was plotted against the amount of the PhIP-C8-dG (fmol). The inset shows the expanded view of the calibration curve at the lower levels of PhIP-C8-dG.
Table 1.
Intra- and inter-assay precision for the determination of PhIP-C8-dG spiked into calf thymus DNA (50 μg of enzymatically hydrolysed DNA on column)
| PhIP-C8-dG standard spike (fmol) |
Intra-day CV (%)a | Inter-day CV (%)b |
|---|---|---|
| 25 | 5.0 | 9.2 |
| 100 | 4.0 | 4.2 |
| 1000 | 5.6 | 3.5 |
n = 4
n = 4
Online column switching LC-ESI-MS/MS analysis of in vitro modified and animal DNA samples
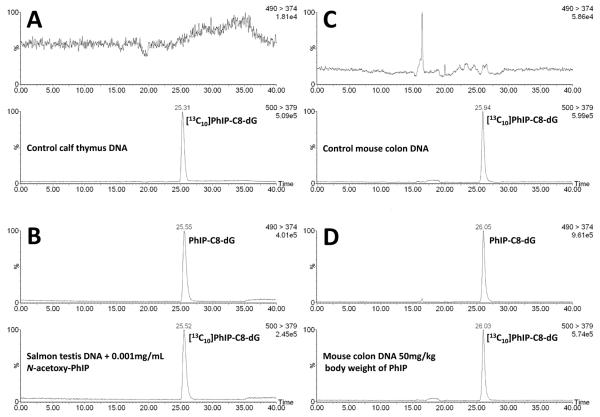
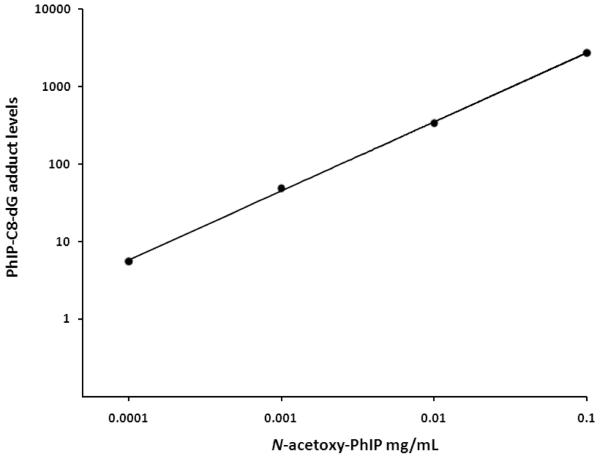
Salmon testis DNA was incubated at 37 °C overnight with solutions of N-acetoxy-PhIP. The typical online column-switching LC-MS/MS SRM ion chromatograms obtained for the determination of PhIP-C8-dG adducts in control (untreated) DNA and salmon testis DNA treated with 0.001mg/mL of N-acetoxy-PhIP are shown in Figure 4A and B, respectively. A linear dose-dependent increase was observed for the levels of PhIP-C8-dG adducts detected in salmon testis DNA following exposure to levels of N-acetoxy-PhIP ranging from 0.0001 to 0.1 mg/mL (Figure 5). The levels of PhIP-C8-dG adducts observed for the different DNA samples and the intra- and inter-assay coefficients of variation for the analyses are shown in Table 2. The typical online column-switching LC-MS/MS ion chromatograms obtained for a mouse colon DNA sample is shown in Figure 4C for a control animal that was treated with the vehicle (corn oil) alone and Figure 4D shows the typical ion chromatogram obtained following the daily oral dosing of a mouse with 50 mg/kg body weight of PhIP for 5 days. The average level of PhIP-C8-dG adducts detected in colon DNA from three animals treated under these conditions was 14.8 ± 3.7 PhIP-C8-dG adducts per 106 2′-deoxynucleosides.
Figure 4.
Typical online column-switching LC-MS/MS SRM ion chromatograms for the determination of PhIP-C8-dG in (A) control calf thymus DNA (B) following the treatment of salmon testis DNA with 0.001 mg/mL of N-acetoxy-PhIP (C) colon DNA from mouse dosed with corn oil and (D) colon DNA from mouse treated with 50 mg/kg body weight of PhIP (50 μg of hydrolysed DNA was analysed (for (B) 10μg) and 1000 fmol of [13C10]PhIP-C8-dG internal standard on column). The SRM transitions monitored were m/z m/z 490 to 374 for PhIP-C8-dG and m/z 500 to 379 for [13C10]PhIP-C8-dG. The trap column was eluted using a gradient with solvent A, 0.1% formic acid and solvent B, acetonitrile (0.1% formic acid) at a flow rate of 120 μL/min. The analytical column was eluted isocratically with 0.1% formic acid/acetonitrile (0.1% formic acid) (75:25, v/v) at a flow rate of 120 μL/min.
Figure 5.
Plot for the formation of PhIP-C8-dG adducts following the treatment of salmon testis DNA with N-acetoxy-PhIP concentrations ranging from 0.0001 to 0.1 mg/mL as determined by online column-switching LC-MS/MS SRM analysis.
Table 2.
Determination of PhIP-C8-dG adducts in salmon testis DNA treated with PhIP using online column-switching LC-MS/MS SRM analysis
| PhIP (mg/mL) + salmon testis DNA sample |
PhIP-C8-dG adducts (per 106 2′- deoxynucleosides)c |
Intra-day CV (%)d | Inter-day CV (%) |
|---|---|---|---|
| 0.0001a | 5.5 ± 0.2 | 4.3 | 3.2 |
| 0.0010a | 49.2 ± 1.9 | 1.7 | 3.9 |
| 0.0100b | 336.2 ± 31.3 | 2.3 | 9.3 |
| 0.1000b | 2728.2 ± 133.3 | 4.8 | 4.9 |
10 μg of enzymatically hydrolysed DNA analysed on column
5 μg of enzymatically hydrolysed DNA analysed on column
the ± error represents the standard deviation (n = 3)
n = 3
Discussion
In the present study we have described the development of an online column-switching LC-ESI-MS/MS SRM method that is suitable for the routine detection and quantification of PhIP-derived DNA adducts formed in vivo. Mass spectrometry offers great potential when applied to the detection and quantification of DNA adducts due to its very high sensitivity and chemical specificity, which allows the identification of specific DNA adducts in complex biological matrices. The advantage of using online column-switching LC is that an enzymatically hydrolysed DNA sample can be analysed directly without the requirement for off-line pre-purification such as solid phase extraction of the DNA adduct, from the vast excess of unmodified 2′-deoxynucleosides that could potentially interfere with the analysis. The PhIP-C8-dG adduct is retained on a trap (enrichment) column while unmodified 2′-deoxynucleosides are eluted to waste. Following elution of the unmodified 2′-deoxynucleosides as well as any matrix impurities that may cause concomitant ionisation suppression, the switching valve diverts the flow from the trap column into the analytical column, which is connected to the mass spectrometer. We have previously applied a similar approach for the determination of DNA adducts derived from reactive oxygen species, acetaldehyde and 3-nitrobenzanthrone [28,34,35]. Interferences from the matrix may result in poor sensitivity by competition for charge, or increased droplet viscosity and surface tension from high concentrations of co-eluting interfering compounds for the formation of gas phase ions in the electrospray source [36]. The addition of [13C10]PhIP-C8-dG internal standard prior to enzymatic hydrolysis of the DNA samples allowed for the accurate quantification of the adduct and also provided confirmation of the identity of the analyte peak since it eluted at the identical retention time as the unlabelled PhIP-C8-dG. The 13C-labelled stable isotope internal standard affords the advantage, when compared to deuterium labelled internal standards, that it is not subject to isotope (eg. deuterium-hydrogen) exchange. Furthermore the fragmentation properties of deuterated compounds may be different from the corresponding natural isotope abundance containing compounds due to the more stable nature of the C-D covalent bond in relation to the C-H bond. Therefore, the accurate quantitation of the analyte may require the determination of a response factor to correct for this difference in fragmentation [37]. For both the PhIP-C8-dG adduct and the corresponding stable isotope internal standard SRM transitions were used for the [M+H]+ ion to adducted base product ion [B+H2]+ formed by the cleavage of the glycosidic bond. SRM offers the greatest sensitivity due to decreased solvent and matrix interferences, and increased specificity due to the monitoring of a characteristic fragmentation following CID of the compound being investigated. Initial method validation was performed by the construction of calibration curves following the spiking of PhIP-C8-dG into calf thymus DNA within a range of 2.5 to 4000 fmol. The method presented good statistical performance with average intra- and inter-assay coefficients of variation of 4.9 and 5.6%, respectively. The estimated LOD and LOQ was 2.5 and 10 fmol on column for PhIP-C8-dG, respectively. These values correspond to a LOD and LOQ of 1.5 and 6.2 PhIP-C8-dG adducts per 108 deoxynucleosides in a 50 μg DNA sample, respectively.
In order to develop the online column-switching LC-ESI-MS/MS method for the detection and quantification of PhIP derived DNA adducts formed in vivo, salmon testis DNA samples were treated with different concentrations of the reactive metabolite N-acetoxy-PhIP ranging from 0.0001 to 0.1 mg/mL. A dose-dependent increase was observed for PhIP-C8-dG adducts following reaction of salmon testis DNA with N-acetoxy-PhIP. The levels ranged from 5.5 to 2728.2 PhIP-C8-dG adducts per 106 2′-deoxynucleosides. The average intra- and inter-assay coefficients of variation for the analysis of these samples were 3.3 and 5.3%, respectively. Analysis of DNA samples isolated from colon tissue of mice treated by oral gavage daily for 5 days with 50mg/kg body weight of PhIP resulted in the detection of an average level of 14.8 ± 3.7 PhIP-C8-dG adducts per 106 2′-deoxynucleosides. No PhIP-C8-dG adducts were detected in control animals dosed with corn oil alone. Previous studies have shown higher levels of PhIP-C8-dG adducts are detected in colon tissue when compared to the liver, which is consistent with the colon being the target tissue for tumour development [29,30].
In the past detection and quantification of PhIP DNA adducts has relied to a large extent on the 32P-postlabelling technique [16-18]. The limitations of 32P-postlabelling are that it does not provide structural confirmation of the adduct being detected and lacks the incorporation of an internal standard to account for adduct recovery and labelling efficiencies. Furthermore 32P-postlabelling of HAA-DNA adducts has resulted in considerable inter-laboratory variation in the patterns of adduct spots detected following TLC separation making the interpretation of the results very difficult. It has been suggested that the majority of the additional spots observed correspond to adducted oligonucleotides as consequence of partial enzymatic hydrolysis of the DNA [16]. The online column-switching LC-ESI-MS/MS SRM method described here would require higher amounts of DNA for the analysis of human samples exposed to dietary levels of PhIP and is generally less sensitive when compared to 32P-postlabelling methods. However, it presents the clear advantages of providing accurate quantitation with information on the chemical identity of the adduct and constitutes a more automated and faster analytical method. Presently accelerator mass spectrometry represents the most sensitive method for the detection of DNA adducts at levels normally encountered in human biomonitoring studies and allows dosing with HAAs at dose levels comparable to those found in the diet [23-25]. However the technique is disadvantaged by the requirement of dosing with 3H- or 14C-labelled carcinogens which is not amenable for general human population based studies and does not provide any structural information [23-25]. The use of capillary- or nano-LC coupled to micro- or nanoelectrospray ionisation mass spectrometry in theory should provide for improvements in sensitivity and allow the detection of PhIP-C8-dG adducts in animal and human samples following dietary levels of exposure to PhIP.
In conclusion, we have developed an online column-switching LC-ESI-MS/MS SRM method with sufficient sensitivity and precision for the analysis of PhIP-C8-dG adducts formed in in-vitro experiments and in-vivo animal studies.
Acknowledgements
The authors acknowledge financial support from the European Union Network of Excellence ECNIS, Type B project (Environmental Cancer Risk, Nutrition and Individual Susceptibility, www.ecnis.org, Contract No. FOOD-CT-2005-513943) and from Cancer Research UK (CRUK project grant C6048/A10896). This work was supported in part by a research grant from Fundação para a Ciência e a Tecnologia (FCT), Portugal and FEDER (PPCDT/QUI/57110/2004). The views presented in this article do not necessarily reflect those of the US Food and Drug Administration.
Abbreviations
- HAA
Heterocyclic aromatic amine
- PhIP
2-amino-1-methyl-6-phenylimidazo[4,5-b]pyridine
- PhIP-C8-dG
N-(deoxyguanosin-8-yl)-2-amino-1-methyl-6-phenylimidazo[4,5-b]pyridine
- ESI
electrospray ionization
- LC-MS/MS
liquid chromatography-tandem mass spectrometry (mass spectrometry/mass spectrometry)
- SRM
selected reaction monitoring
- CID
collision induced dissociation
References
- [1].Schut HAJ, Snyderwine EG. Carcinogenesis. 1999;20:353. doi: 10.1093/carcin/20.3.353. [DOI] [PubMed] [Google Scholar]
- [2].Sugimura T, Wakabayashi K, Nakagama H, Nagao M. Cancer Sci. 2004;95:290. doi: 10.1111/j.1349-7006.2004.tb03205.x. [DOI] [PMC free article] [PubMed] [Google Scholar]
- [3].Gooderham NJ, Zhu H, Lauber S, Boyce A, Creton S. Mutat. Res. 2002;506-507:91. doi: 10.1016/s0027-5107(02)00155-0. [DOI] [PubMed] [Google Scholar]
- [4].Knize MG, Felton JS. Nutr. Rev. 2005;63:158. doi: 10.1111/j.1753-4887.2005.tb00133.x. [DOI] [PubMed] [Google Scholar]
- [5].Turesky RJ. Toxicol. Lett. 2007;168:219. doi: 10.1016/j.toxlet.2006.10.018. [DOI] [PubMed] [Google Scholar]
- [6].Wakabayashi K, Nagao M, Esumi H, Sugimura T. Cancer Res. 1992;52 [PubMed] [Google Scholar]
- [7].Zhu J, Chang P, Bondy ML, Sahin AA, Singletary SE, Takahashi S, Shirai T, Li D. Cancer Epidemiol. Biomarkers Prev. 2003;12:830. [PubMed] [Google Scholar]
- [8].Ito N, Hasegawa R, Sano M, Tamano S, Esumi H, Takayama S, Sugimura T. Carcinogenesis. 1991;12:1503. doi: 10.1093/carcin/12.8.1503. [DOI] [PubMed] [Google Scholar]
- [9].Tang D, Liu JJ, Rundle A, Neslund-Dudas C, Savera AT, Bock CH, Nock NL, Yang JJ, Rybicki BA. Cancer Epidemiol. Biomarkers Prevent. 2007;16:803. doi: 10.1158/1055-9965.EPI-06-0973. [DOI] [PMC free article] [PubMed] [Google Scholar]
- [10].International Agency for Research on Cancer (IARC) IARC Monographs on the Evaluation of Carcinogenic Risk to Humans. Vol. 56. Lyon: 1993. Some naturally occurring substances: food items and constituents, heterocyclic aromatic amines and mycotoxins. [Google Scholar]
- [11].Zhao K, Murray S, Davies DS, Boobis AR, Gooderham NJ. Carcinogenesis. 1994;15:1285. doi: 10.1093/carcin/15.6.1285. [DOI] [PubMed] [Google Scholar]
- [12].Crofts FG, Sutter TR, Strickland PT. Carcinogenesis. 1998;19:1969. doi: 10.1093/carcin/19.11.1969. [DOI] [PubMed] [Google Scholar]
- [13].Buonarati MH, Felton JS. Carcinogenesis. 1990;11:1133. doi: 10.1093/carcin/11.7.1133. [DOI] [PubMed] [Google Scholar]
- [14].Frandsen H, Grivas S, Andersson R, Dragsted L, Larsen JC. Carcinogenesis. 1992;13:629. doi: 10.1093/carcin/13.4.629. [DOI] [PubMed] [Google Scholar]
- [15].Lin D, Kaderlik KR, Turesky RJ, Miller DW, Lay JO, Jr, Kadlubar FF. Chem. Res. Toxicol. 1992;5:691. doi: 10.1021/tx00029a016. [DOI] [PubMed] [Google Scholar]
- [16].Pfau W, Brockstedt U, Sohren KD, Marquardt H. Carcinogenesis. 1994;15:877. doi: 10.1093/carcin/15.5.877. [DOI] [PubMed] [Google Scholar]
- [17].Fukutome K, Ochiai M, Wakabayashi K, Watanabe S, Sugimura T, Nagao M. Japn. J. Cancer Res. 1994;85:113. doi: 10.1111/j.1349-7006.1994.tb02068.x. [DOI] [PMC free article] [PubMed] [Google Scholar]
- [18].Mauthe RJ, Marsch GA, Turteltaub KW. J. Chromatogr. B. 1996;679:91. doi: 10.1016/0378-4347(96)00010-2. [DOI] [PubMed] [Google Scholar]
- [19].Turesky RJ, Vouros P. J. Chromatogr. B. 2004;802:155. doi: 10.1016/j.jchromb.2003.10.053. [DOI] [PubMed] [Google Scholar]
- [20].Rindgen D, Turesky RJ, Vouros P. Chem. Res. Toxicol. 1995;8:1005. doi: 10.1021/tx00050a003. [DOI] [PubMed] [Google Scholar]
- [21].Friesen MD, Kaderlik K, Lin D, Garren L, Bartsch H, Lang NP, Kadlubar FF. Chem. Res. Toxicol. 1994;7:733. doi: 10.1021/tx00042a004. [DOI] [PubMed] [Google Scholar]
- [22].Crosbie SJ, Murray S, Boobis AR, Gooderham NJ. J. Chromatogr. B. 2000;744:55. doi: 10.1016/s0378-4347(00)00227-9. [DOI] [PubMed] [Google Scholar]
- [23].Dingley KH, Curtis KD, Nowell S, Felton JS, Lang NP, Turteltaub KW. Cancer Epidemiol. Biomarkers Prev. 1999;8:507. [PubMed] [Google Scholar]
- [24].Lightfoot TJ, Coxhead JM, Cupid BC, Nicholson S, Garner RC. Mutat. Res. 2000;472:119. doi: 10.1016/s1383-5718(00)00134-0. [DOI] [PubMed] [Google Scholar]
- [25].Turteltaub KW, Dingley KH, Curtis KD, Malfatti MA, Turesky RJ, Colin Garner R, Felton JS, Lang NP. Cancer Lett. 1999;143:149. doi: 10.1016/s0304-3835(99)00116-0. [DOI] [PubMed] [Google Scholar]
- [26].Singh R, Farmer PB. Carcinogenesis. 2006;27:178. doi: 10.1093/carcin/bgi260. [DOI] [PubMed] [Google Scholar]
- [27].Singh R, Gaskell M, Le Pla RC, Kaur B, Azim-Araghi A, Roach J, Koukouves G, Souliotis VL, Kyrtopoulos SA, Farmer PB. Chem. Res. Toxicol. 2006;19:868. doi: 10.1021/tx060011r. [DOI] [PubMed] [Google Scholar]
- [28].Da Costa GG, Singh R, Arlt VM, Mirza A, Richards M, Takamura-Enya T, Schmeiser HH, Farmer PB, Phillips DH. Chem. Res. Toxicol. 2009;22:1860. doi: 10.1021/tx900264v. [DOI] [PubMed] [Google Scholar]
- [29].Goodenough AK, Schut HAJ, Turesky RJ. Chem. Res. Toxicol. 2007;20:263. doi: 10.1021/tx0601713. [DOI] [PMC free article] [PubMed] [Google Scholar]
- [30].Metry KJ, Neale JR, Bendaly J, Smith NB, Pierce WM, Jr, Hein DW. Drug Metab. Dispos. 2009;37:2123. doi: 10.1124/dmd.109.029512. [DOI] [PMC free article] [PubMed] [Google Scholar]
- [31].Neale JR, Smith NB, Pierce WM, Jr, Hein DW. Polycycl. Aromat. Compd. 2008;28:402. doi: 10.1080/10406630802377773. [DOI] [PMC free article] [PubMed] [Google Scholar]
- [32].Frandsen H, Rasmussen ES, Nielsen PA, Farmer P, Dragsted L, Larsen JC. Mutagenesis. 1991;6:93. doi: 10.1093/mutage/6.1.93. [DOI] [PubMed] [Google Scholar]
- [33].Finn RD, McLaren AW, Carrie D, Henderson CJ, Wolf CR. J. Pharmacol. Exp. Ther. 2007;322:40. doi: 10.1124/jpet.107.121780. [DOI] [PubMed] [Google Scholar]
- [34].Singh R, Teichert F, Verschoyle RD, Kaur B, Vives M, Sharma RA, Steward WP, Gescher AJ, Farmer PB. Rapid Comm. Mass Spectrom. 2009;23:151. doi: 10.1002/rcm.3866. [DOI] [PubMed] [Google Scholar]
- [35].Singh R, Sandhu J, Kaur B, Juren T, Steward WP, Segerback D, Farmer PB. Chem. Res.Toxicol. 2009;22:1181. doi: 10.1021/tx900106y. [DOI] [PubMed] [Google Scholar]
- [36].Jessome LL, Volmer DA. LC-GC North America. 2006;24:83. [Google Scholar]
- [37].Haskins NJ. Biomed. Mass Spectrom. 1982;9:269. doi: 10.1002/bms.1200090702. [DOI] [PubMed] [Google Scholar]


