

Abstract
Neurons maintained in dispersed primary culture offer a number of advantages as a model system and are particularly well-suited for studies of the intrinsic electrical properties of neurons by patch-clamp. We have characterized the immunocytochemical and electrophysiological properties of cultured rat striatal neurons as they develop in vitro in order to compare this model system to the known properties found in vivo. We found a high abundance of cells in vitro corresponding to the principal striatal output neuron, the medium spiny neuron.
Immunocytochemical studies indicate that these cells have both dopamine-1 and dopamine-2 receptors and that there is overlap in their expression within the population of neurons. Semi-quantitative analysis revealed bimodal distributions of dopamine receptor expression among the population of neurons. The principal peptide neurotransmitters substance P and enkephalin were present but at reduced levels compared to adult preparations. Other striatal markers such as calbindin, calretinin and the cannabinoid-1 receptor were abundant. An immunocytochemical survey of voltage-gated K+ channel subunits characteristic of adult tissue demonstrated the presence in vitro of Kv1.1, Kv1.4, Kv4.2, Kv4.3 and Kvβ1.1 which have been associated with the rapidly inactivating currents. Electrophysiological studies employing voltage clamp revealed that outward currents had a large inactivating (A-type) component characteristic of mature basal ganglia. Current clamp studies reveal complex spontaneous firing patterns in a subset of neurons including bursting behaviors superimposed on a slow depolarization. The inward rectifying channels Kir2.1 and Kir2.3 which are specific to particular compartments in adult striatum were present in culture.
Keywords: Striatal neurons, Dopamine receptors, Potassium channels, substance P, Enkephalin, Calcium binding proteins
Neurons derived from fetal rodent brain and maintained in primary culture have been widely employed as model systems to study developmental processes and physiology at the single-cell level (Mandel and Banker, 1996). Significant progress has been made in the study of neuronal polarity (Dotti and Banker, 1991), G protein-coupled receptors (Vilchis et al., 2002; Morris et al., 2000), ion channel physiology (Sucher et al., 2000; Parak et al., 2001; Centonze et al., 2002) and inhibitory synaptic transmission (Kowalski et al., 1995) by using primary neuronal culture. Striatal neurons maintained in primary culture have been employed to study physiology of the NMDA receptors (Popp et al., 1998), opioid receptors (Vaysse et al., 1990), metabotropic glutamate receptors (Paolillo et al., 1998), and acetylcholine receptors (Tence et al., 1995). Numerous studies have investigated potential neuroprotective effects using cultured striatal neurons as a model system (for example, see Schroeter et al., 2001).
These preparations are particularly well suited for gene-transfer studies intended to manipulate electrical activity, since transduced neurons can be identified in the living state by the use of fluorescent reporter genes and their electrophysiological properties may be studied individually by patch clamp methods (Falk et al., 2003). In order to better extrapolate the results to the in vivo state, it is necessary to characterize the properties of cultured neurons under the specific growth and maintenance conditions utilized (Kessler, 1986). While cultured striatal neurons have been the subject of numerous studies, these preparations have not been comprehensively analyzed to determine which subpopulations of neurons are present and how these correspond to the mature state found in vivo.
The classical model of basal ganglia circuits divides the striatal output neurons into two classes, both of which are GABA-ergic (Herrero et al., 2002). The neurons belonging to the direct pathway are characterized by the presence of dopamine-1 (D1) receptors and utilize substance P as a peptide cotransmitter; while the neurons belonging to the indirect pathway bear dopamine-2 (D2) receptors and utilize enkephalin as a cotransmitter. Studies that assess the degree of overlap of the expression of D1 and D2 receptors have given variable results depending on the methodology used, but anatomical studies indicate that there are distinct populations present in vivo (Hersch et al., 1995; Smith and Kieval, 2000). On the other hand, a more recent study, (Lee et al., 2004; reported while this manuscript was in revision), has demonstrated functional and anatomic overlap of the D1 and D2 receptors both in vitro and in vivo.
The aim of this report is to establish the baseline time course of expression of characteristic rat striatal proteins in primary culture. We evaluate the expression in vitro of the D1 and D2 receptors, the peptide neurotransmitters substance P and enkephalin, as well as other markers known to be characteristic of basal ganglia neurons. These include glutamic acid decarboxylase (GAD), the small calcium binding proteins calbindin (CB) and calretinin (CR), selected K+ channels, and the cannabinoid-1 receptor. In addition, we present basic studies of the electrophysiological properties of cultured striatal neurons, which support their use as a model system for the study of striatal development.
EXPERIMENTAL PROCEDURES
Primary neuronal cultures
Timed-pregnant Sprague-Dawley rats were anesthetized by exposure to CO2 and sacrificed. Fetuses were removed at E17, anesthetized by cooling on ice, and decapitated. This procedure was approved by the Institutional Animal Care and Use Committee at The Univ. of Arizona and conformed to the guidelines of the National Institutes of Health (USA). Day E17 was chosen as the optimum stage at which there was still high cell viability but sufficient maturity to allow for differentiation of neuronal subtypes and completion of neuronal migration. The telencephalon was removed and bisected along the midline. The striata could then be dissected free from the cortex following a visible plane that divides the caudate-putamen neuroepithelium from the cortex and subventricular zone following an atlas of the developing rat brain (Paxinos et al., 1994: E17 coronal sections 6–9). After dissection, the striata were gently minced and triturated in Ca++-free saline containing (mM): 136 NaCl; 5.3 KCl; 0.3 Na2PO4; 0.2 KH2PO4; 33.2 glucose and 43.8 sucrose; pH 7.4), then plated on 35 mm tissue culture dishes coated with poly-D-lysine (20 µg/ml, Sigma-Aldrich, St. Louis MO), in Minimum Essential Medium (MEM) with 10% (v/v) heat-inactivated horse and 10% (v/v) fetal bovine serum. Enzymatic treatment with trypsin was not used, as it was found to decrease cell viability in initial experiments. Rather, a serial process of trituration was used. Tissue was first triturated 25 times with a Pasteur pipette in 2 ml of volume. Larger pieces of tissue were allowed to settle briefly (1 min) by gravity and the supernatant was transferred to another tube. This process was then repeated twice using fire-polished Pasteur pipettes of decreasing tip caliber. Cells were plated at a density of 5·105 viable cells (e.g., excluded trypan blue)/30mm culture dish. Tissue culture media and sera were obtained from Gibco BRL, Grand Island NY. The cultures, containing both glia and neurons, were incubated at 37°C in a humidified 5% CO2 incubator. From days 4–7 the cultures were treated with 0.02 mg/ml 5-fluorodeoxyuridine to inhibit the growth of mitotic cells. Subsequently, the cultures were maintained in MEM with 10% (v/v) horse serum, changed every 4 days.
Immunocytochemical Methods
Cultures were fixed on day 14 in a MEM/HEPES (pH 7.0) solution containing 4% sucrose and 4% paraformaldehyde. After fixation, the cells were washed in a PBS permeation buffer (pH 7.4) containing 0.05% Triton X-100 and 1% BSA (three times for five minutes each). The fixed cells were incubated in primary antiserum solution (1:100–1:5000 dilution depending on antibody used) in permeation buffer supplemented with 3% donkey serum for 24 hr at room temperature. After primary incubation, the cell cultures were then washed with permeation buffer (3 times for 5 min each). To allow visualization under fluorescent light, cultures were incubated in a biotinylated secondary antibody solution (1:1000 donkey anti-rabbit immunoglobulin G) for 1 hr at room temperature. Murine monoclonal antibodies were visualized with goat antimouse antibodies conjugated with fluorescein for direct visualization when used in double-label experiments. The cells were washed as previously described, and incubated in solution of fluor-conjugated streptavidin (1:100,000 AlexaFluor555, Molecular Probes, Eugene OR) for 1 hr at room temperature. The cells were washed and PBS solution (pH 7.4) was applied for microscopic visualization and storage. In order to determine the optimum conditions for immmunocytochemistry, initial studies were carried out with a range of dilutions of the primary antibody from 1:10,000 to 1:50. Controls included cultures in which the primary antibody, secondary antibody, or both were omitted with application of AlexaFluor555 to determine the degree of non-specific background binding and fluorescence of the various elements of the antibody complex. When available controls also included block with the antigenic peptide (antibodies for Kvβ1.1, Kv4.2, Kv4.3, Kv1.1, and Kv1.4). Other antibodies (D1 and D2 receptor, 1:2000; choline acetyl transferase, 1:2000; calbindin, 1:10,000; calretinin, 1:10,000; substance P 1:500, enkephalin 1:2000) were also tested in slices of adult rat brain using standard immunochemical methods with diaminobenzidine visualization (Sloviter et al., 2001) in order to verify that the expected high level of staining in the striatum was present. Fluorescent images were acquired digitally on an Olympus IX70 inverted microscope and camera using Olympus MagnaFire software. All images were captured using a 20× objective. Antibodies were obtained from the following sources: Rabbit anti-D1 receptor, Calbiochem (San Diego CA); rabbit anti-GAD67, Santa Cruz Biotechnology (Santa Cruz, CA); murine monoclonal anti-calbindin D28, Sigma-Aldrich (St. Louis, MO). All other antibodies were obtained from Chemicon, Temecula CA.
Semi-quantitative analysis of immunoreactivity was carried using Scion Image software (Scion Corp, Frederick MD) to measure the brightness of the fluorescent signal. The exposure was adjusted to ensure that the region of interest (neuronal soma) was within the gray scale values and not saturated. Once the proper exposure time was determined, this was used as a fixed parameter for all data acquisition of a particular neurochemical marker throughout the developmental time course. Generally exposure times were 1 to 2 sec. The region of interest was the largest rectangle that was contained within the interior of the soma. The mean value of brightness of the region of interest was used after subtracting the background measured from an adjacent region not containing neuronal elements. Neurons that appeared to be apoptotic or necrotic based on the phase contrast morphology (small round cells with retracted neurites) were excluded from all numerical analyses. Statistical analysis was carried out using Matlab v6.0 (Mathworks, Natick MA) and Arena v6.0 (IBM Rational Rose, White Plains, NY) to generate normal distributions fit to histograms. The fit was evaluated using least sum of squares method. A program was written to vary the mean, standard deviation, and weighting of two normal distributions until the sum of squares was minimized.
Electrophysiology
Perforated patch clamp was performed using the whole cell patch clamp configuration as previously described (Falk et al., 2001a). The external recording solution contained (mM): 140 NaCl, 3.5 KCl, 2.2 CaCl2, 2 MgSO4, 1.25 NaH2PO4, 0.4 KH2PO4, 10 HEPES, 10 glucose, pH 7.3 @37°C. For voltage clamp, 0.5 µM tetrodotoxin was added to block voltage-gated Na+ currents. The intracellular (pipette) solution consisted of (mM): 154 K-gluconate, 6 NaCl, 0.85 CaCl2, 2 MgCl2, 10 HEPES, 10 glucose and 1 EGTA; pH 7.3 @37°C. The membrane under the cell-attached patch was permeabilized by nystatin (0.1 µg/µl), providing electrical access. Patch clamp was carried out using an AxoPatch 200A amplifier (Axon Instruments, Foster City CA); signals were digitized and stored on a computer hard drive for off-line analysis. Recordings were performed at 37° C, using an electric stage heater (Fryer A-50, Fryer Company, Inc, Huntley IL) calibrated to maintain the fluid in the culture dish at the desired temperature. Baseline inactivation of K+ channels was prevented by using a holding potential of −80 mV. This voltage was determined to be sufficient to remove baseline inactivation because pre-pulse conditioning at more negative potentials (down to −110 mV for 100 ms) did not enhance peak outward current amplitude, or alter rates of inactivation as compared with results obtained from a holding potential of −80mV. Current clamp was used to induce repetitive firing employing current injection (0.1 nA increment over 600 ms). A small holding current was employed to keep the baseline membrane potential (Vm) at −70 mV for current clamp only (no holding current was applied for measurement of spontaneous activity).
Data analysis and statistical methods
The voltage clamp data were digitized and analyzed using pCLAMP v6.0 software (Axon Instruments). The first 100 ms of the falling phase of the current was fit using the Chebyshev method with 5000 iterations to a single exponential equation: C + Ae−(t−K)/τ where K represents the time of the peak current. The fast time constant of inactivation (τin) was determined for current traces at +40 mV evoked from a holding potential of −80 mV. The peak current amplitude was considered the maximum measured value of the record. The steady-state current amplitude was defined as the current at the end of the voltage clamp trace.
Statistical tests were applied to the data using an α=0.05 level of significance to reject the Null Hypothesis. All t-tests assumed unequal variance and were two-tailed.
RESULTS
GLUTAMIC ACID DECARBOXYLASE IMMUNOCYTOCHEMISTRY
The majority of neurons in the adult striatum are GABA-ergic, with the notable exception of cholinergic interneurons. The enzyme glutamic acid decarboxylase (GAD) has been widely used as surrogate marker for identifying GABA-ergic neurons because immunocytochemical detection of GABA is less reliable (Sloviter et al., 2001). There are two isoforms of GAD which are generally co-expressed in GABA-ergic neurons (Martin and Barke, 1998). Consistent with the adult striatum, greater than 90% of the cultured striatal neurons were strongly immunoreactive for both isoforms (Fig. 1). Also conforming to the findings in adult brain, the distribution of GAD65 immunoreactivity was largely confined to the neurites (Fig. 1B); while GAD67 staining was stronger in the soma with less pronounced staining in the neurites (Fig. 1D).
Figure 1.
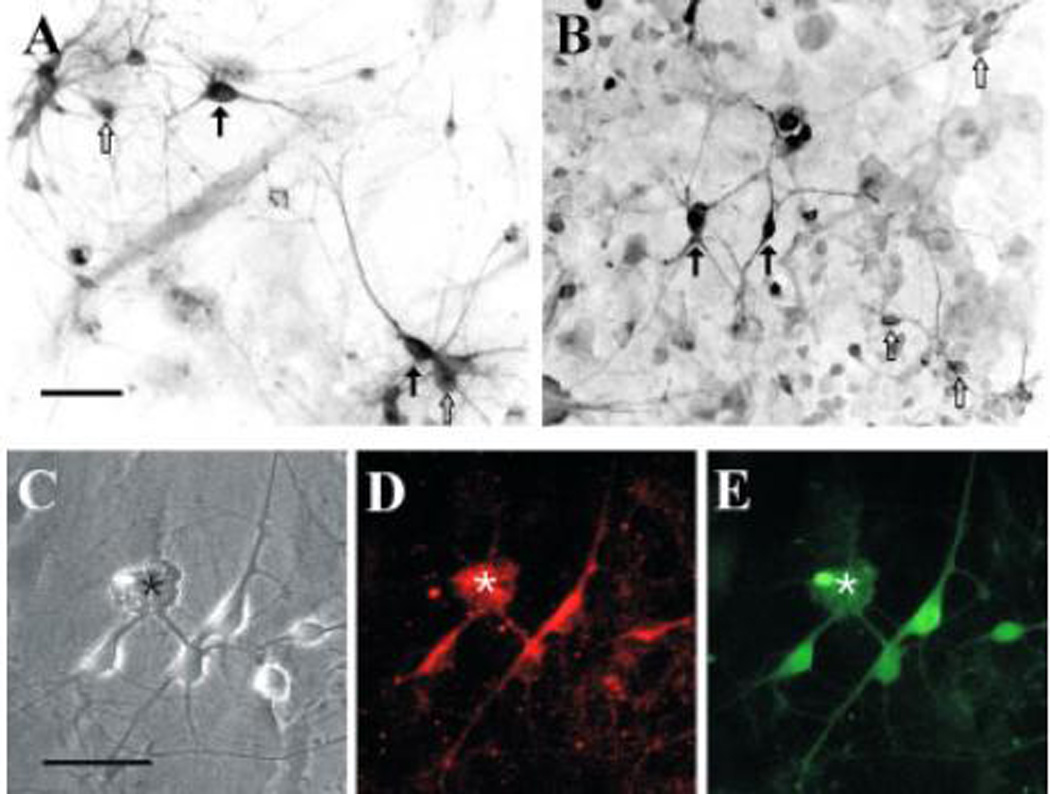
Glutamic acid decarboxylase immunoreactivity in striatal neurons at DIV 12. Striatal neurons were double labeled for MAP-2 using a fluorescein conjugated secondary antibody (A) and GAD65 visualized with Alexafluor (B). Two views of the same field are shown using different filter sets. The majority of neurons (88±2.3%, n=8) are strongly immunoreactive for GAD65 (filled arrowheads). Large neurons that display no GAD reactivity were rarely observed (open arrowhead) and are similar in size and morphology to rare neurons displaying immunoreactivity for choline acetyl-transferase (C) suggesting that they may correspond to the aspiny cholinergic interneurons found in vivo. The neuron shown in panel C is from a separate preparation. In (D) an example for GAD67 immunoreactivity is shown. Scale: 50 µm.
DISTRIBUTION OF D1 AND D2 RECEPTORS
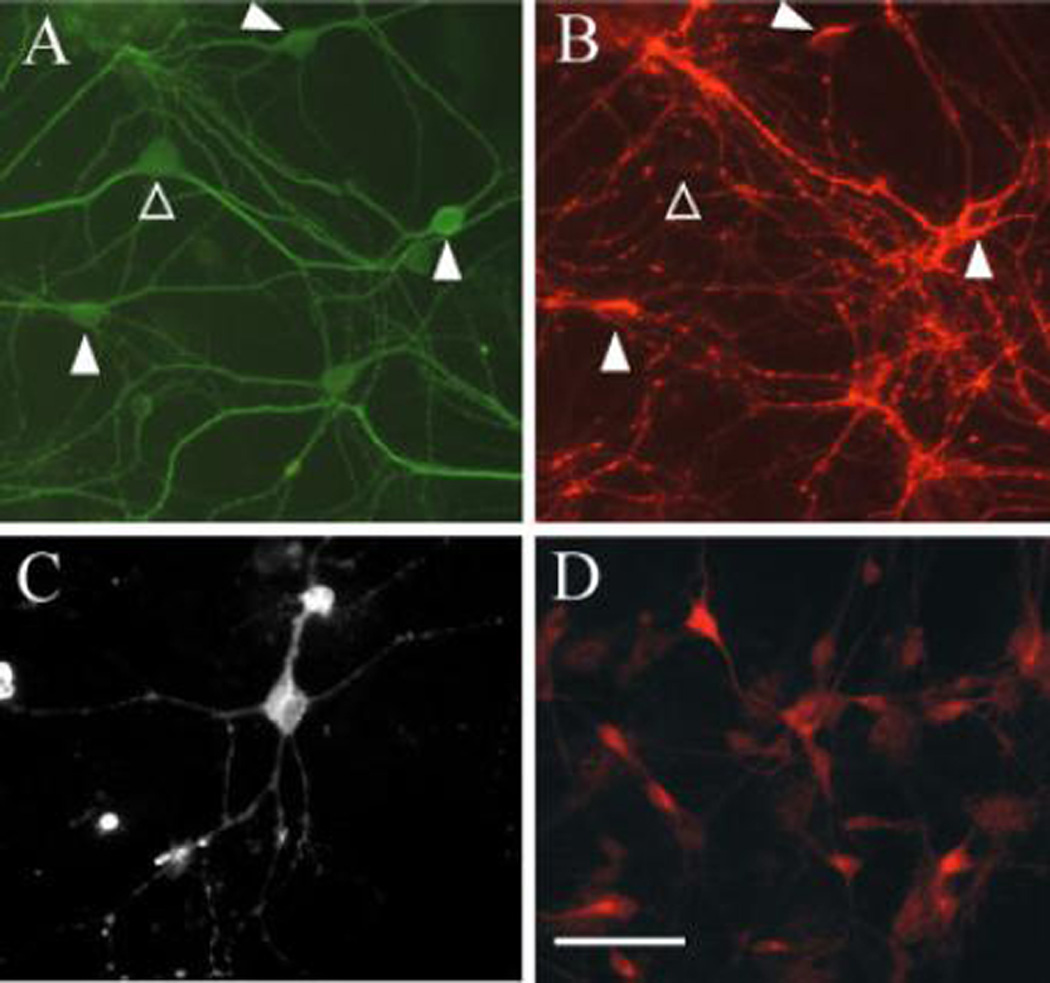
Immunocytochemical analysis of D1 and D2 receptors was carried out using cultured striatal neurons maintained in culture from 4 to 18 d (Fig. 2–3) utilizing a rabbit polyclonal antibody and a fluorescent secondary label. The D1 receptor-immunoreactivity was present in the majority (92%) of the neurons to varying degrees although some neurons did not have levels above the background staining present in glial cells. We did not detect any correspondence between the level of immunoreactivity and cell morphology. The neurons varied both in the size of the soma and the pattern of neurite outgrowth which included bipolar, stellate, and pyramidal forms. Immunostaining for the D2 receptor was generally more robust than for the D1 receptor, but similar in that most neurons (92%) displayed some level of immunoreactivity. Given the fact that the majority of striatal neurons were immunoreactive for both D1 and D2 receptors, there must be overlap of expression of both receptor subtypes in some neurons. We carried out double labeling with D1 and D2 receptor antibodies in some experiments (Fig. 2C–E). The majority of cells displayed immunoreactivity to both receptors subtypes, although the pattern of staining was distributed differently over the soma. The D1 receptor immunoreactivity was patchy and usually confined to one side of the soma, while D2 receptor immunoreactivity was uniformly distributed over the soma. Both D1 and D2 immunoreactivity was found in the neurites. There was no correlation between the levels of immunoreactivity of the two receptor subtypes (R<0.2, n=100).
Figure 2.
Dopamine receptor immunoreactivity in cultured striatal neurons. Cultured neurons were processed for (A) D1 receptor immunoreactivity or (B) D2 receptor immunoreactivity and visualized using a fluorescent secondary antibody. The photomicrographs show a digitally inverted black and white image, in which the highest staining intensity is represented by black. There is a heterogeneous population of neurons with some displaying a relatively robust staining (solid arrows) and others displaying a level just above the background staining (open arrows). Most neurons exhibited coexpression of the D1 and D2 receptors, as determined by double-labeling: (C) phase contrast view showing several neurons and a small explant of tissue, marked with an asterisk; (D) the same field showing D1 receptor immunoreactivity (E) D2 receptor immunoreactivity. Scale: 50 µm.
Figure 3.
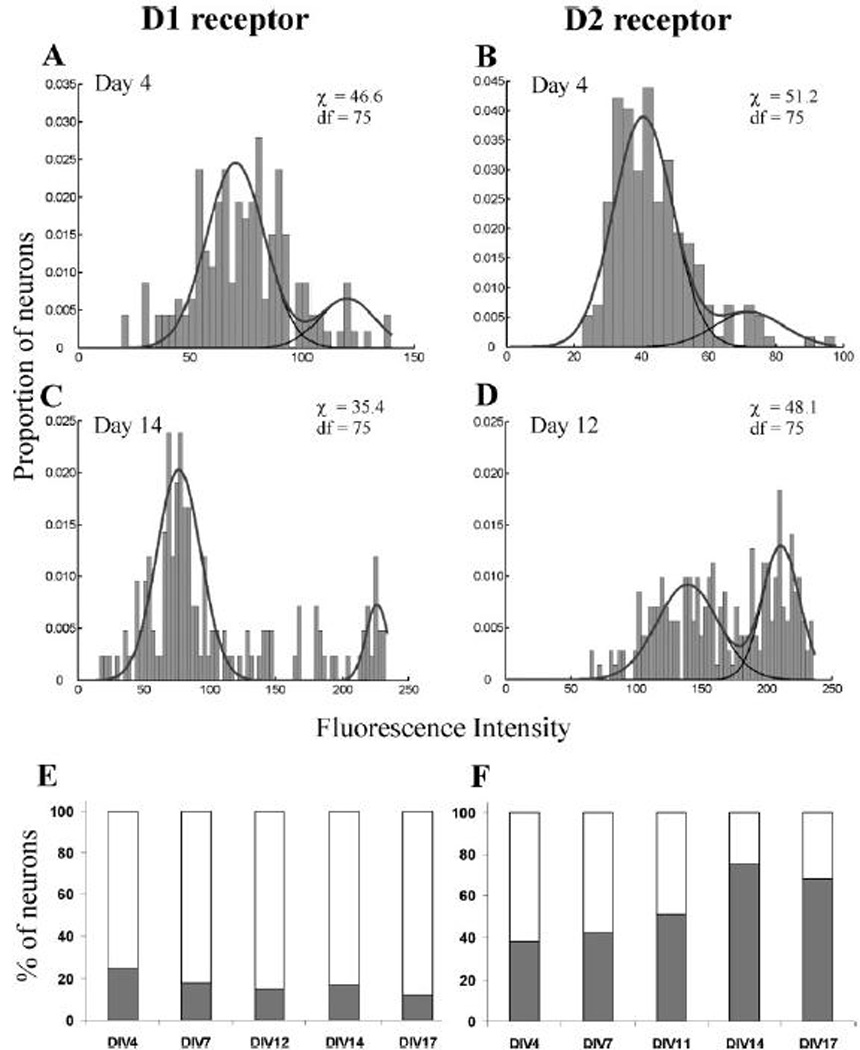
Semi-quantitative analysis of dopamine receptor expression. The level of dopamine-receptor immunoreactivity was quantified from photomicrographs using gray-scale analysis of regions of interest within the neuronal soma. Photomicrographs used for quantitative analysis were taken at a shorter exposure than the examples shown in Fig. 2, in order to ensure that the brightest neurons did not reach saturation of the gray scale (D1 receptor: 2.1 s, D2 receptor 1.6 s). The cultures were studied over the first three weeks of development in vitro. Examples of the histograms that were constructed are shown at the earliest time point (DIV 4) for the D1 receptor (A) and the D2 receptor (B) and later time points studied (DIV 14) for the D1 receptor (C) and (DIV 12) for the D2 receptor (D). The histograms were best fit by the sum of two normally distributed populations, shown by the gray line in panels A–D. The component sub-populations are shown in black. In all cases the data were best fit by two, rather than one, Gaussian population. The binned data were compared to the sum of the two normal distributions using the χ2 goodness-of-fit test. In each case the χ2 values were less than critical value calculated using degrees of freedom (dF) shown at a significance level of α=0.05. The best fit with a single normal distribution (data not shown) led to χ2 values larger than the critical value. In (E–F) we graph the proportion of neurons belonging to each sub-population as a function of developmental age in vitro. There was a highly evident trend for neurons to switch from the lower to higher expression levels of D2 receptors as development proceeds. Conversely, the distribution of the D1 receptor expression showed a trend toward a shift to the population with the lower expression level.
We also explored the possibility that there were separate subpopulation of neurons with different levels of dopamine receptor expression. A semi-quantitative analysis of the level of immunoreactivity was performed on a large sample of the neuronal population, at several times during the period of development in vitro. As shown in Fig. 3, histograms were constructed that show the distribution of immuno-intensity and then statistically analyzed by fitting the data to normal distributions. At all times, there was a poor fit assuming the presence of a single population and a much better fit assuming the presence of two distinct populations with different mean intensities. In Fig. 3A–D, the best fit to the component subpopulations and the sum of these two distributions is superimposed on the data. These data indicate that at least two different sub-populations were present (with higher and lower levels of immunoreactivity). The histograms of the D2 receptor immunoreactivity showed the most clear separation of the two populations (Fig. 3B,D). There was a shift between these two populations over the course of development (Fig. 3F), with more neurons displaying a higher level of immunoreactivity as the cultures matured. The distribution of D1 receptors (Fig. 3A,C) showed a less clear separation of the two populations, yet the data could still not be well fit by a single Gaussian distribution. The D1 receptor expression showed an opposite trend compared to the D2 receptor (Fig 3E). The distribution tended to narrow over the developmental time course studied and there was a trend toward lower levels of D1 receptor expression. It is tempting to construe these data as indicating that there is a phenotypic shift from neurons displaying a predominantly D1 phenotype to a predominantly D2 phenotype; however, the data were derived from single antibody studies for each receptor subtype, and therefore other scenarios are equally plausible. We could not find a correlation between the D1 and D2 receptor immuno-intensities in the double-label experiments shown in Fig. 2, however this technique was not as well-suited for the quantitative measures employed in the single label studies.
The data shown in Fig. 3 were derived from experiments utilizing alexafluor staining and primary antibody at a dilution of 1:500. Care was exercised to ensure that the conditions used (antibody dilutions and camera exposure) led to a full range of fluorescence intensities without saturation of the response. Nevertheless, these results must be considered semi-quantitative since it is not possible to construct a standard curve using known amounts of the antigen. In order to confirm the basic findings, additional experiments were performed that utilized a range of dilutions of the rabbit polyclonal primary antibody (1:500 to 1:2000) and subsequently stained with either alexafluor or fluorescein (data not shown). In each case, we found a broad distribution best fit by a two-population statistical model, indicating that this finding was not an artifact of a particular immunocytochemical technique. In addition, we studied the distribution of immuno-intensities using a separate mouse monoclonal antibody (1:100 dilution) for the D1 receptor. Although the staining was not as intense as with the rabbit polyclonal primary antibody, the results were consistent; the distribution was best fit by the sum of two normal distributions (data not shown). We also studied hippocampal cultures maintained under the same culture conditions as the striatal cultures and processed identically for immunocytochemistry. In these cultures, we rarely found neurons that had levels of dopamine receptor immunoreactivity as intense as found in the striatal cultures (data not shown). This result, in addition to their initial validation using brain tissue slices, supports the specificity of the antibodies used as applied to immunocytochemical analysis in dispersed culture.
These results indicate that cultured striatal neurons mimic the adult brain in displaying a relatively high level of dopamine receptors compared to other brain regions. We found evidence for two distinct populations of neurons in the culture system based on dopamine receptor immunoreactivity. We did not however find an exact correspondence to the classical model that posits two populations of neurons with either D1 or D2 receptor expression (but no overlap). The developmental trend of a shift in the proportion of neurons assigned to the two sub-populations is of uncertain significance, but could indicate progression to an adult state in which there is more clear separation of neuronal subtypes that more closely conform to the classical model.
PRESENCE OF PEPTIDE NEUROTRANSMITTERS: ENKEPHALIN AND SUBSTANCE P
Anatomical studies from adult striatum have indicated that neurons of the direct and indirect pathway may be distinguished by the presence of the peptide cotransmitters substance P and met-enkephalin. We tested for immunoreactivity of these two peptides in cultured striatal neurons. Substance P immunoreactivity was generally weaker than that for the other neurochemical markers studied. Patches of immunostaining were noted on the somata ~50% of the neurons (Fig. 4A). There was no correlation between the intensity of D1-immunoreactivity and the presence of substance P immunoreactivity (R=0.55). Immunostaining for enkephalin revealed a smaller but strikingly bright subset of neurons with robust immunoreactivity in the neurites that clearly distinguished them from the majority using visual observation without the need for quantitative techniques (Fig. 4B). Immunoreactivity in the soma was more variable and absent in some neurons with intense immunoreactivity in the neurites. This population was a small fraction (3.1±0.8%) of the total neuronal population determined by neuron-specific markers MAP-2 and NeuN and ranged between 1–4 % of total neurons in the 8 preparations studied. In adult brain, anatomical studies have indicated that enkephalinergic neurons belong to the indirect pathway, which is enriched in D2 receptor. We double-stained cultured striatal neurons for enkephalin and the D2 receptor in order to determine if there was any correlation between enkephalin and D2 receptor immunoreactivity, but found no correspondence upon quantitative analysis. Enkephalin-positive neurons had a mean D2 receptor intensity (fluorescence intensity determined by a 256 unit gray scale) of 130.1 ± 27.9 compared to 125.7 ± 13.2 for enkephalin negative neurons (p=0.577, t-test). The presence of a subset of enkephalinergic neurons is similar to the situation in the adult brain; however, the percentage is much less than that found in vivo, which is estimated at approximately 50%. It is most likely that this represents a relatively undifferentiated state of the culture system, although we have not excluded the possibility that the survival of enkephalinergic neurons is selectively diminished in culture.
Figure 4.
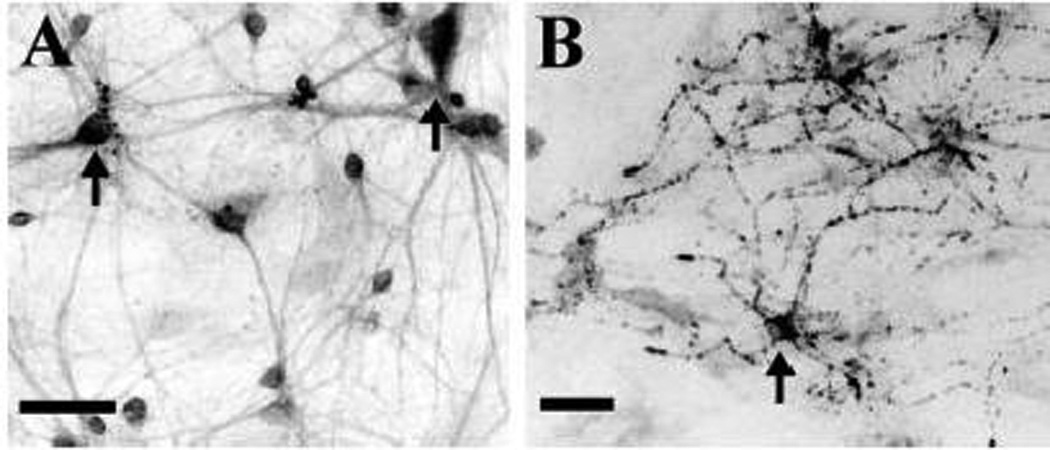
Presence of neuropeptide cotransmitters in cultured striatal neurons. (A) Immunoreactivity for Substance P was found in most neurons. In some neurons, high intensity staining was present in patches over the somata (arrows). (B) Strong met-enkephalin immunoreactivity was prominent in the neurites and to a lesser extent in the somata (arrows) of a small population of neurons. Images shown are digitally inverted. Scale: 50 µm.
CALCIUM BINDING PROTEINS
The small Ca++-binding proteins calbindin (CB), calretinin (CR) and parvalbumin (PV) have been used as markers of neuronal sub-populations in a variety of brain regions (Schwaller et al., 2002; Ulfig, 2002). In adult striatum, the medium spiny projection neurons express CB (Parent et al., 1996) and thus the majority of neurons are found to have CB immunoreactivity. On the other hand, CR and PV are found in small sub-populations that are thought to correspond to non-cholinergic, GABA-ergic interneurons. We tested for the presence of CB, CR, and PV in cultured striatal neurons in order to determine the correspondence to the mature brain studied in vivo. As expected, the majority (75–82%) of the neurons displayed CB immunoreactivity (Fig. 5A). An unexpected result was the relatively abundant presence CR-immunoreactive neurons (8–32%, mean 12±8.2, n=10) found in cultures (Fig. 5B). Unlike the widespread distribution of CR and CB found in culture, PV-immunoreactive neurons were extremely rare and weakly stained (data not shown).
Figure 5.
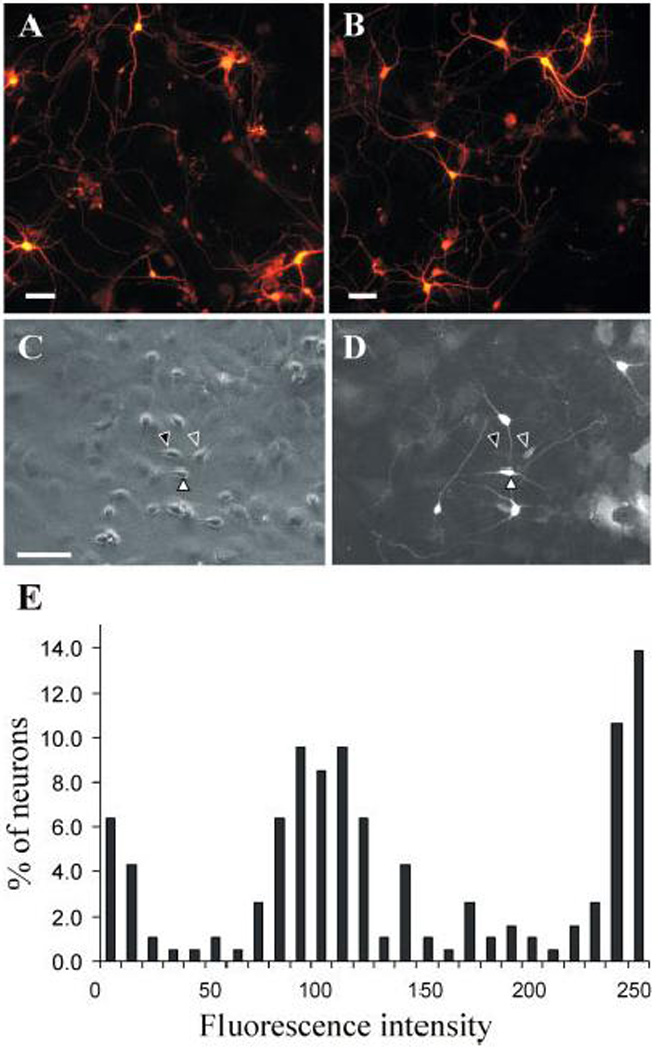
Calcium binding protein expression in striatal neurons. Neurons were stained for (A) CB or (B) CR under conditions that revealed all immunoreactive neurons by producing intense immunofluorescence. Two separate populations of calbindin positive neurons could be resolved under slightly different conditions as described in the text. Panel (C) shows a phase contrast view of a field of neurons. Panel (D) shows the same field with fluorescent optics to visualize calbindin immunoreactivity. Some neurons displayed intense immunoreactivity (filled white arrowheads), other neurons displayed a lower level immunoreactivity (open arrowheads), and third population displayed no immunoreactivity above background (filled black arrowheads in Panel C). Two neurons of each type are marked with arrowheads; however other examples are evident in the figure but have been not been marked to avoid obscuring the image. In particular, there are adjacent neurons with very different staining characteristics indicating that the different levels of immunoreactivity are not due to non-specific variations in staining characteristics in different areas of the culture dishes. Glial cells with relatively high calbindin immunoreactivity (lower right, panel D) were occasionally noted, but most glial cells had more modest immunoreactivity similar to the background staining. Panel E shows a histogram of the intensity of immunoreactivity among a large population of neurons (n=200). This histogram reflects the three sub-populations of neurons described above. All examples are from cultures at DIV 10. Scale: 50 µm.
In order to ensure that results of the CR and CB-antibody binding were not spurious, we analyzed immunoreactivity of the antibodies in cultured hippocampal and cerebellar neurons where particular neuronal subtypes with known expression of calcium-binding proteins can be morphologically identified. As expected, in cerebellar cultures, Purkinje neurons alone were positive for CB and no abundant CR-positive neurons were found. Similarly in hippocampal cultures only a subset of interneurons was positive for calretinin. In the studies shown in Fig. 5A–B, conditions were optimized to detect all neurons positive for CB or CR (anti-CB and anti-CR polyclonal rabbit primary antibodies were used at 1:500 dilution, with secondary antibodies at 1:250 dilution, and visualized with Alexafluor at 1:10,000). In order to minimize the chance of false positive errors we also carried staining under a range of conditions with more dilute primary and secondary antibody concentrations. Although staining was less intense, the proportion of CR-positive neurons occurred over a similar range (7–22%, mean 9.4±4.2, n=6).
When studied quantitatively using less intense staining conditions (rabbit polyclonal anti-CB, 1:5000; secondary antibody 1:200), we were able to resolve the CB-positive population to two different sub-populations (Fig. 5C–D). Under these conditions of reduced antibody concentrations, one class of neurons continued to demonstrate very bright immunostaining, whereas other neurons were clearly immunoreactive but at considerably lower level. This lower level of staining does not appear to be artifact, as there are other neurons in the same field (Fig. 5C) that are clearly negative with staining that is only at the barely visible background level. A quantitative analysis similar to that undertaken for the dopamine receptor expression analysis (Fig. 5E) demonstrates 3 sub-populations: negative, low immunoreactivity, and intense immunoreactivity. The separation of the low and high CB-expressing populations was greater than that found for the dopamine receptors and it was not possible to quantify both populations using a single exposure, as the digitally-acquired images became saturated at exposures long enough to resolve the less-intensely stained population. Therefore, in the histogram shown in Fig. 5E, the high-end is truncated (1.8 s exposure). In a separate quantification using a shorter exposure (0.6 s), this highly CB-immunoreactive population was found to consist of a single sub-population.
Given the results obtained by staining separately for CR and CB, it is apparent that some neurons must express both CB and CR. Since coexpression of CB and CR has not been reported in rat or primate studies, we directly confirmed this overlap of expression using double-labeling for CB and CR. We confirmed the presence of some neurons that stained intensely for both CB and CR (Fig. 6). The double-labeling technique reduced the overall degree of immunoreactivity compared to separate staining for each antigen. Therefore, the degree of coexpression of CB and CR may have been underestimated by this technique.
Figure 6.
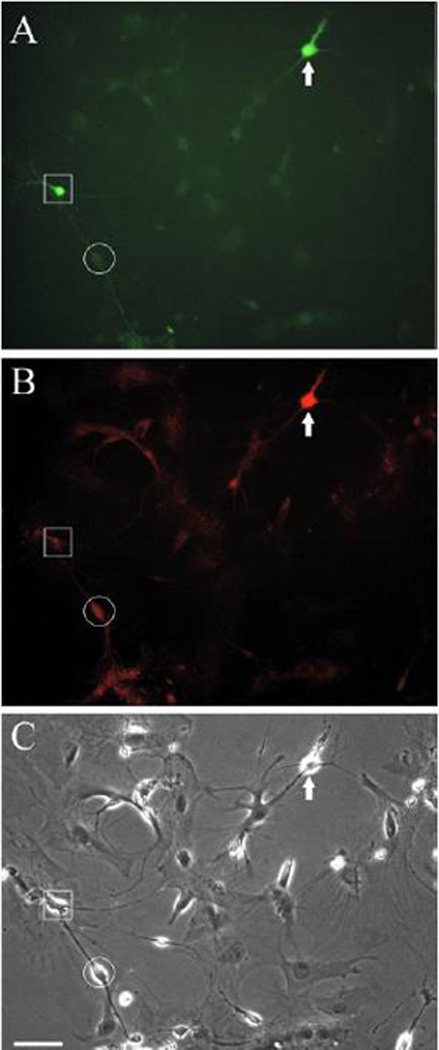
Coexpression of calbindin and calretinin. Cultures of neurons were double-labeled with mouse monoclonal anti-CB and rabbit polyclonal anti-CR. Appropriate secondary labels were employed (fluorescein-conjugated goat antimouse, and biotinylated donkey antirabbit, secondarily labeled with the red alexafluor). Panel (A) shows CB immunoreactivity using a fluorescein filter, (B) shows CR-immunoreactivity in the same field using a red filter and (C) shows the field in phase contrast. The photomicrograph was chosen since it clearly displays a neuron with robust labeling to both CB and CR antibodies (white arrow). An example of more typical neurons that display strong immunoreactivity to only one of the Ca++-binding proteins are also visible in this field. The neuron identified by the square shows a predominance of CB-immunoreactivity while the neuron identified by the circle shows a moderate degree of CR-immunoreactivity with the fluorescein signal shown in panel A is the same as the glial background staining. Some neurons visible in phase contrast display little if any CB or CR immunoreactivity. Scale: 50 µm.
We considered the possibility that the ratio of CR+/CB+ neurons could reflect the immature status of the cultured neurons. A time course was carried out to study the relative expression of CR and CB (Fig. 7). At the earliest time point studied (DIV 3, where neuronal morphology was first clearly evident), CR+ and CB+ neurons were found and the proportion of these did not change appreciably over the first two weeks in vitro. A small proportion of neurons that co-expressed CB and CR was present at all times studied. This finding indicates that the calcium binding protein phenotype of neurons has already been determined E17 when the cultures were prepared and is stable under culture conditions.
Figure 7.
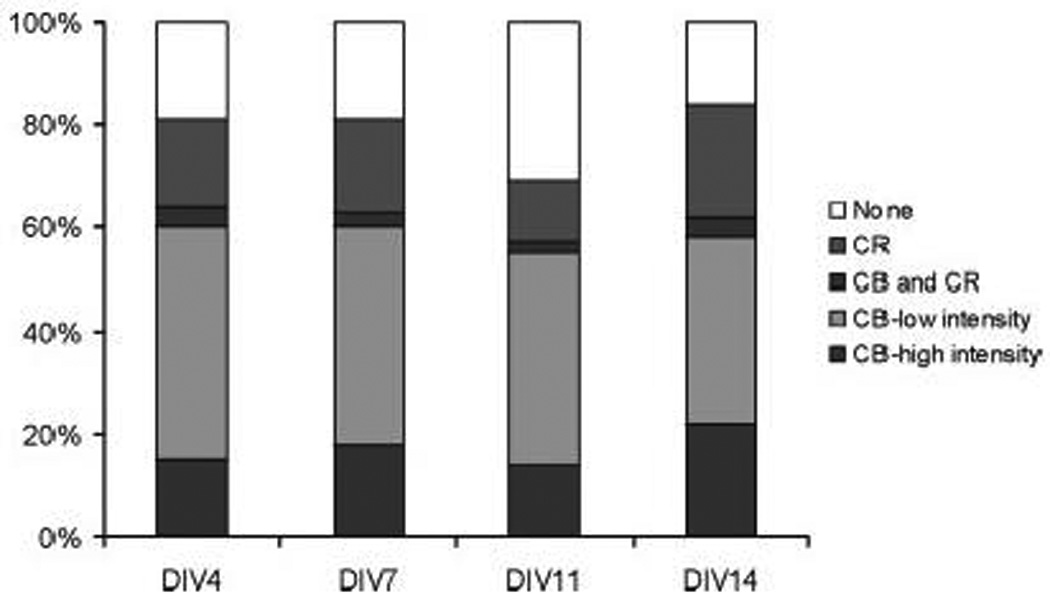
Developmental expression of calcium binding proteins. A detailed time course of calcium binding protein expression was performed over a range of days in vitro (DIV4–14). The two different levels of CB expression were determined as shown in Fig. 5C–D. Double-labeling studies similar to those shown in Fig. 6 were used to determine the percentage of the population co-expressing both CB and CR. Cultures first stained and analyzed for CR immunoreactivity were then stained for CB immunoreactivity.
CANNABINOID RECEPTORS
Cannabinoid receptors are widespread throughout the central nervous system, but are particularly enriched in the basal ganglia (Brotchie, 2003; Julian et al., 2003). In this respect, the cultured striatal neurons are a faithful model of the situation in vivo, as we found widespread and relatively intense immunoreactivity for the cannabinoid-1 receptor (Fig. 8). Immunoreactivity was present in nearly all neurons without much variation in the staining intensity. Overall the immunoreactivity was markedly higher than that found in hippocampal or cerebellar cultures (data not shown).
Figure 8.
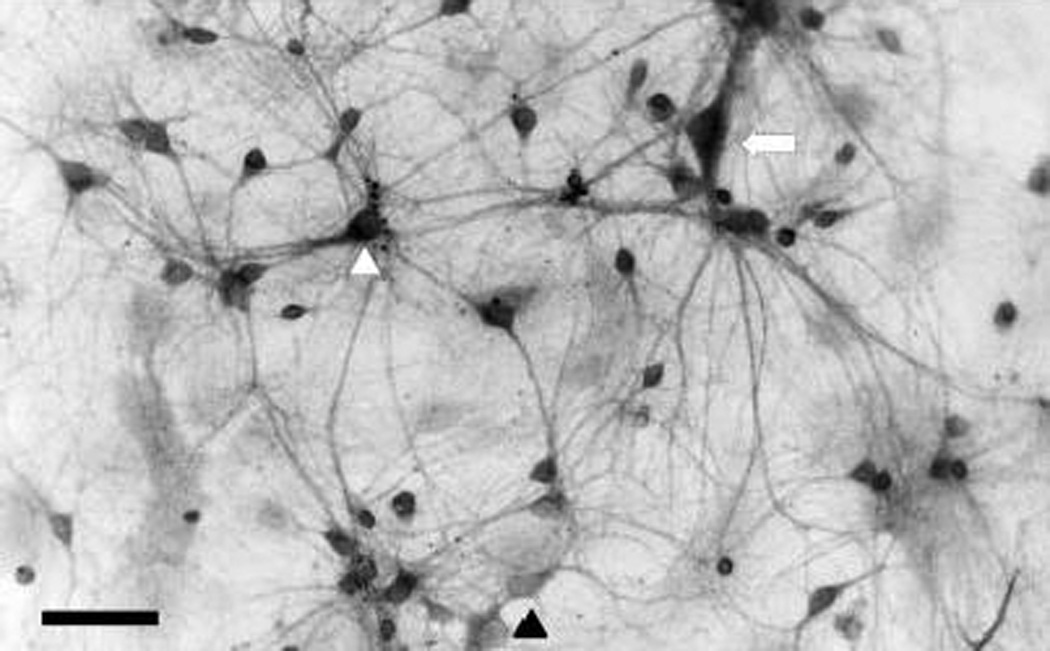
Cannabinoid-1 receptor immunoreactivity in cultured striatal neurons. A photomicrograph of striatal neurons demonstrates prominent immunoreactivity for the cannabinoid-1 receptor in the majority of neurons. The image shown has been digitally inverted. Glial elements showed a low level of staining not different from background levels found with controls using the secondary antibody alone. There is a slight degree of heterogeneity among the neurons with some staining more heavily (for example see white arrowhead) than others (black arrowhead). Large neurons that correspond to a rare subset that is cholinergic (see Fig.1) also demonstrated intense staining (see arrow) for the cannabinoid-1 receptor. Scale: 50 µm.
POTASSIUM CHANNELS
Potassium channels are a highly diverse group of ionic channels that are important for the regulation of electrical excitability of neurons and maintenance of the resting membrane potential (Hille, 2002). In general, several molecular species may underlie electrical currents and different classes of neurons may each express a unique mix of K+ channel subtypes. It is outside the scope of this report to fully describe the expression of all of the known K+ channel subtypes. We have instead focused on K+ channel species that are likely to underlie the A-type K+ current which is prominent in striatum (Surmeier et al., 1989; Xu, 1995), as well as the inward rectifier (Kir) subtypes which have specific distributions in the matrix versus patch compartments of the striatum (Pruess et al., 2003), and differential expression in the direct and indirect pathways (Mermelstein et al., 1998). These channel subtypes are of particular interest to potential strategies of modifying striatal physiology using genetic manipulation of ion channel function (see Discussion).
The A-type current is characterized by rapid inactivation. Two members of the Kv1 family of pore-forming α-subunits (Kv1.1, Kv1.4) are known to associate with the Kvβ1 auxiliary subunit, which confers fast inactivation to the channel complex (Rettig et al., 1994). In some regions of the basal ganglia, single-cell PCR studies indicate that members of the Kv4 family underlie an A-type current (Liss et al., 2001). We probed for immunoreactivity to each of these subunits (Fig. 9A–H). Neurons displayed immunoreactivity for all of the Kv subunits studied. Comparison of immunoreactivity to the different Kv antibodies is constrained by the possibility of differing affinities to the antigenic epitope; however, we optimized the dilution of each antibody to give a similar ratio of neuronal brightness to background staining. We found that immunoreactivity could be ranked as Kv4.3>Kv4.2>Kv1.4>Kv1.1. Immunoreactivity to Kv4.3 had a distinct pattern, staining neurites with intensity equal to the soma. Immunoreactivity to Kv1.1 and Kv1.4 was most intense over the soma. Immunoreactivity to Kv4.2 showed somewhat greater intensity over the soma compared to the neurites. As expected, inward rectifying K+ channels were also found to be present. Kir2.1 (Kubo et al., 1993) was more prominent than Kir2.3 (Falk et al., 1995). Immunoreactivity for Kir2.3 was less uniform then for Kir2.1 with some neurons displaying a very low level of staining intensity (Fig. 9I–L). This is in keeping with the more generic and widespread distribution of Kir2.1 in the adult striatum (Pruess et al., 2003). Immunoreactivity for Kvβ1.1 was similar in pattern to that found in primary cultures of hippocampal neurons (Falk et al., 2003), staining both soma and neurites. A range of intensities of Kvβ1.1 immunoreactivity was encountered. In general the pyramidal shaped neurons demonstrated somewhat lower immunoreactivity than neurons with a multipolar morphology (Fig. 9M). Antibodies to the K+ channels cross-reacted with nuclear elements in some glial cells. This was most notable for Kv1.1, Kv4.2 and Kir2.3 (see arrows in Fig. 9L). This glial immunoreactivity is non-specific since it was not appreciably blocked by the antigen peptide included in controls; whereas, neuronal immunoreactivity was reduced to very low background comparable to that seen with the secondary antibody alone.
Figure 9.
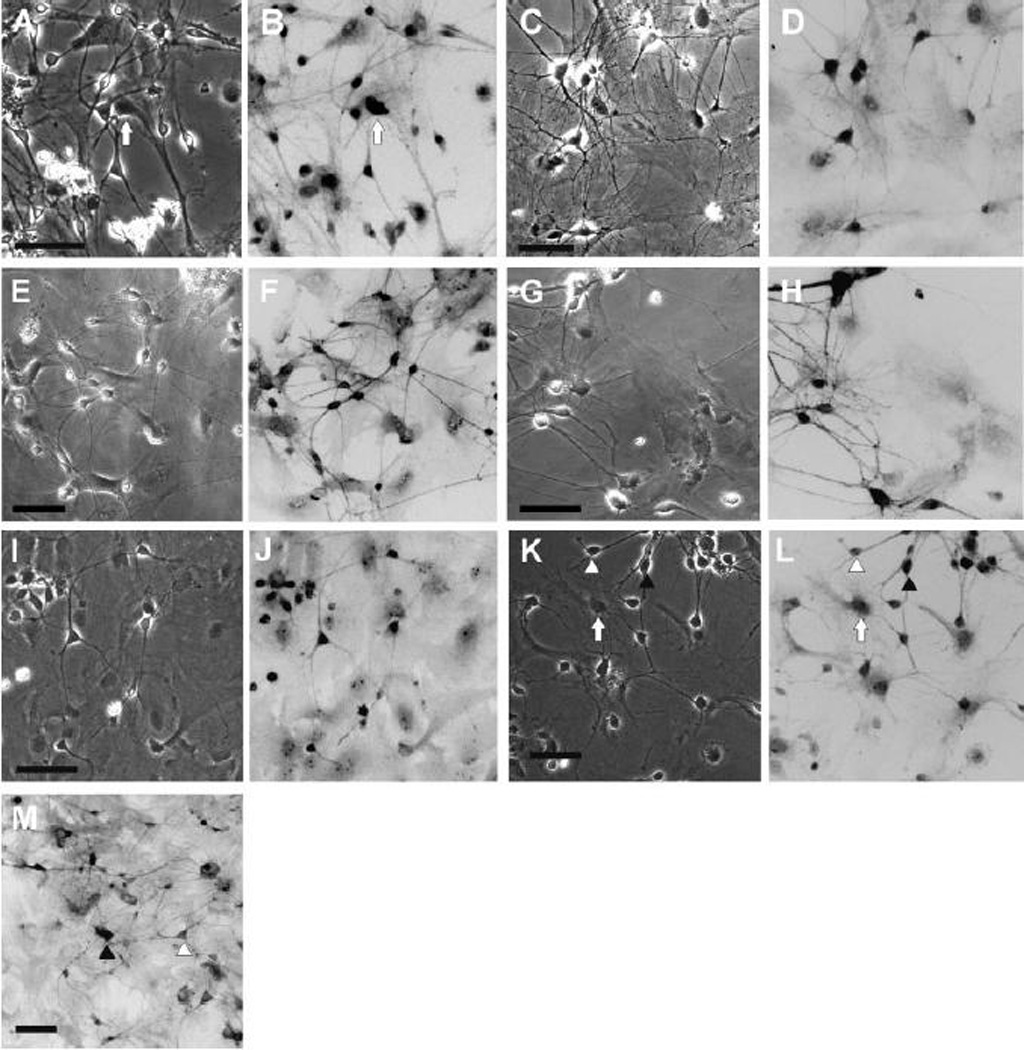
(A–H) Presence of selected Kv channel-subunit immunoreactivity. Immunocytochemistry was performed using rabbit polyclonal antibodies, secondarily labeled with a biotinylated anti-rabbit visualized with alexafluor. A pair of panels is shown for each antibody with the same field viewed under phase contrast (A, C, E, G) or fluorescent optics (B, D, F, H) Immunoreactivity was detected for K+ channel subunits associated with fast inactivation: (A, B) Kv1.1; (C, D) Kv1.4; (E, F) Kv4.3; (G, H) Kv4.2. The arrows (A, B) indicate an example of glial cells that displayed apparent immunoreactivity over the region of the nucleus (see text for discussion). (I–L) Presence of selected Kir immunoreactivity. Immunocytochemistry was performed using rabbit polyclonal antibodies, secondarily labeled with a biotinylated anti-rabbit visualized with alexafluor. A pair of panels is shown for each antibody with the same field viewed under phase contrast (I, K) or fluorescent optics (J, L). The inward rectifier channels Kir2.1 (I, J) and Kir2.3 (K, L) were detected. The arrows (K, L) indicate examples of glial cells that displayed apparent immunoreactivity over the region of the nucleus (see text for discussion). (M) Presence of Kvβ1.1 immunoreactivity. Immunocytochemistry was performed using a rabbit polyclonal antibody, secondarily labeled with a biotinylated anti-rabbit visualized with alexafluor. The image shown has been digitally inverted. Neurons with a multipolar morphology (closed arrowhead) had more intense staining than neurons with a pyramidal morphology (open arrowhead). Scale: 50 µm.
ELECTROPHYSIOLOGICAL PROPERTIES: K+ CURRENTS AND FIRING PATTERNS
Cultured striatal neurons were studied by single cell patch clamp methods in order to compare their electrophysiological properties with studies performed in vivo or in slice preparations. Whole cell outward K+ currents were studied in the presence of tetrodotoxin to block voltage-gated Na+ currents and K+ channel inactivation was removed by holding cells at −80 mV (Fig. 10). All neurons studied showed fast inactivation characteristic of the A-type current. In the majority of neurons (8 out of 10) the A-type current constituted over 60% of the total K+ current (Fig. 10A). This A-type current was even more prominent than that found in similar cultures obtained from rat hippocampus (Falk et al., 2003). The remaining 2 neurons showed a smaller A-type current (12% and 41%) reminiscent of hippocampal neurons in culture. When cells were stepped from −80 to +40 mV, the mean time constant of inactivation (τ) was 17.1±1.74 (mean±S.E.M., n=10) and this inactivating current accounted for 58% of the total K+ current at the calculated steady state. The mean peak K+ current at +40mV was 3.65±0.42 nA (mean±S.E.M., n=10), the mean steady state K+ current at +40 mV was 1.54±0.15 nA. The current-voltage relationship as depicted in an IV plot (Fig. 10B) shows strong outward rectification. The currents activate at voltages more positive than −50mV. These values are similar to those found in adult rat striatum (Nisenbaum and Wilson, 1995).
Figure 10.
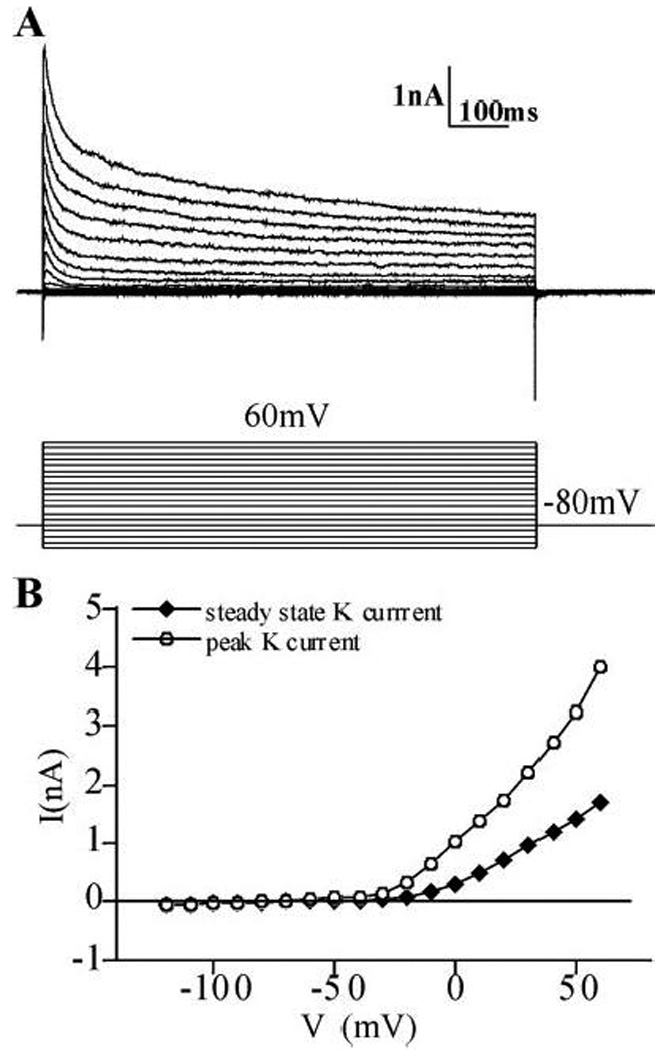
Electrophysiological properties of cultured striatal neurons. Whole cell patch clamp was performed in neurons maintained in culture for 8–10 days. Voltage clamp recording were carried out in the presence of TTX to block Na+ currents. The neuron was held at a membrane potential of −80mV and then K+ currents were evoked by a series of 800ms voltage steps from +60 to −120mV in 10mV increments. The example in (A) shows a very prominent inactivation of outward currents characteristic of the A-type current. The I–V plot of the same neuron (B) shows strong outward rectification.
The firing pattern of cultured striatal neurons was also studied in current clamp recordings (Fig. 11). Different patterns of spontaneous activity were noted. Few neurons were quiescent (10.5%) over the course of 5 min, although evoked responses could be obtained. A larger number of neurons displayed a continuous firing pattern (42.1%, Fig. 11A) ranging in frequency from 0.11 to 1.56 Hz. The largest subset of neurons displayed bursting activity (47.4%, Fig. 11B). The term bursting is used loosely since the clusters of action potentials (see Fig. 11A, expanded time scale) did not reach the high frequency or organized pattern classically associated with hippocampal or thalamic neurons in vivo. The overall frequency ranged from 0.05 to 0.98 Hz. In these neurons there were clusters of action potentials superimposed on a slow depolarization reminiscent of Ca++ currents that are responsible for bursting activity prominent in the thalamus and hippocampus (Sherman and Guillery, 2001). The VM was −55±1.4 mV (mean±S.E.M., n=38). The bursting neurons had a more negative resting potential as compared to ones showing single action potentials (Table 1). There was no statistical significant difference in the overall firing frequency of bursting neurons and single spiking neurons (Table 1). We also evoked responses by stepwise current injection (0.1 pA) to depolarize the neurons from a resting potential that was adjusted to −70mV with a small holding current. We found that most neurons responded with a graded increase in firing rate until depolarization block ensued at more depolarized potentials (Fig. 11C). The firing threshold for inducing a pair of action potentials ranged from 0.1 to 0.7nA. There was no statistical significant difference in the mean evoked threshold between neurons showing spontaneous bursting or separate single action potentials (Table 1).
Figure 11.
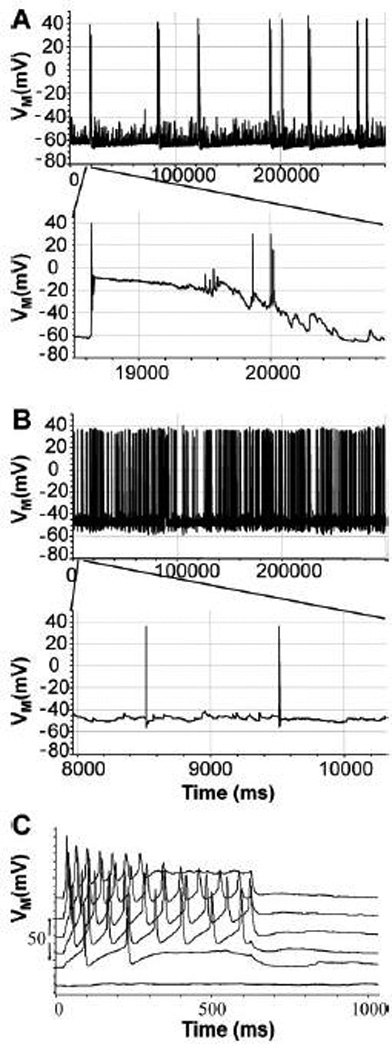
When spontaneous electrical activity was sampled in current clamp recordings over 5 min, different firing patterns were observed. Some neurons displayed a bursting type behavior (A) with long-duration slow potentials and superimposed fast action potentials. Other neurons displayed a fast and regular firing frequency without slow potentials (B). In addition in the same neurons a step protocol was employed with increasing current injection to elucidate the firing threshold. The example in (C) shows the membrane voltage response due to increased current injection in 0.2 pA steps of 600 ms duration. For this protocol, the VM was initially maintained at −70mV using a small baseline current injection. The voltage traces are vertically separated by 20mV for clarity.
TABLE 1.
Electrophysiology Properties of Bursting versus Continuously Firing Striatal Neurons.
| Bursting behavior | Continuous firing | ||
|---|---|---|---|
| VM(mV) | −58 ± 1.900(±SEM, n = 18) | −51.3 ± 2.100(±SEM, n = 16) | P = 0.022 |
| AP frequency (Hz) | 0.374 ± 0.072(±SEM, n = 15) | 0.681 ± 0.210(±SEM, n = 9) | P = 0.231 |
| AP threshold (nA) | 0.43 ± 0.050(±SEM, n = 16) | 0.57 ± 0.120(±SEM, n = 15) | P = 0.362 |
DISCUSSION
Cultured striatal neurons have been used extensively in the general study of neuronal physiology and serve as a specific model of basal ganglia function. We have undertaken a detailed developmental study of some of the salient neurochemical features of cultured striatal neurons in order to further characterize their utility as a model system. The cultures were obtained at E17, a relatively late stage of development in order to maximize the degree of differentiation of the neurons prior to removal. While some neurons in the region dissected may have been destined to migrate to adjacent cortical areas, our results suggest that most neurons in the culture develop the expected features of striatal neurons.
The principal neuron of the dorsal striatum (caudate-putamen) is the medium spiny neuron, which is a GABA-ergic projection neuron receiving afferents from cortical and subcortical regions including the substantia nigra. Anatomic and physiological studies of the basal ganglia have generated the classical scheme of connections that has had great heuristic value in the treatment of Parkinson’s disease and other movement disorders (Herrero et al., 2002). The principal feature of the classical model is that striatal neurons are subdivided into two classes, which give rise to either the direct or the indirect pathway, classified according to their connections with other portions of the basal ganglia. Dopaminergic innervation has opposing effects on these two pathways, augmenting activity in the direct pathway via the excitatory D1 receptor and decreasing activity in the indirect pathway via the inhibitory D2 receptor.
Despite the general acceptance of the classical model as a basic framework, there are a number of inconsistencies that indicate it is an oversimplification of a complex physiology (Parent et al., 2000). For example, the issue of whether there is overlap of D1 and D2 receptor expression in striatal neurons has not been completely resolved. Most anatomic studies employing in situ mRNA hybridization (Gerfen, 1992 and Gerfen et al.1995) or electron microscopic analysis of immunocytochemistry (Hersch et al., 1995) have supported segregation of dopamine receptor subtype expression according the classical model. However, other studies have found significant coexpression of D1 and D2 receptors in some (Meador-Woodruff et al., 1991), if not all striatal neurons (Ohno et al., 1987; Surmeier, 1993)
Our results are one of the first the first to employ dopamine receptor immunocytochemistry in cultured striatal neurons. Using specific antibodies for each receptor subtype, we have demonstrated that these neurons have robust immunoreactivity for both D1 and D2 receptors. Semi-quantitative analysis of intensity of immunoreactivity among a population of neurons indicates a broad range of the level of receptor expression and the presence of at least two sub-populations with different levels of dopamine receptor expression. Differing from the standard model of the basal ganglia, we could not demonstrate clearly defined populations selectively expressing only one receptor subtype. In fact, double-labeling experiments demonstrated coexpression of both D1 and D2 receptors. It is possible that coexpression of dopamine receptors is more prominent at early developmental stages. During the developmental maturation that occurred in vivo, there was as trend toward more clear separation of the two sub-populations. Nevertheless our findings support the argument that individual striatal neurons can express more than one type of dopamine receptor. During the review of this manuscript, Lee et al. (2004) showed that D1 receptors and D2 receptors are co-expressed in individual striatal neurons, both in vivo and in vitro and are part of a single heteromeric protein complex. These heteromeric D1–D2 receptors activate a novel phosopholipase C-mediated Ca2+ signal that is not activated by either D1 or D2 receptors alone, showing a functional relevance for co-expression of D1 and D2 receptors in the same cell. It is possible that dopamine receptor expression is not so clear cut as implied by the standard model, which assumes an either-or expression of D1 versus D2 receptor subtypes. Rather, neurons may express a predominance of one receptor subtype over the other, shaping the pharmacological response, but still maintain a functional link between the two receptor sub-types. The presence of the two sub-populations described in this report, is consistent with this formulation.
Our findings based on immunocytochemical methods complements earlier studies that employed pharmacological ligands. Prior work has utilized receptor subtype-selective antagonists to detect presence of classes of dopamine receptors in cultured striatal neurons. Hoyt and Reynolds (1996) used a fluorescent-tagged D1 receptor antagonist (bodipy-SCH23390) to label living striatal neurons maintained in primary culture and constructed population histograms (similar to Fig. 3). They also found a broad distribution of fluorescent intensity with over 70% of the neurons demonstrating specific binding. Mesco et al. (1992), utilizing autoradiography with D1 and D2 receptor-specific ligands ([3 H]-SCH23390 and [3 H]-spiperone) found that the proportion of neurons bearing dopamine receptors increased over time in culture; at day 20, 24% were positive for the D1 receptor and 35% were positive for D2 receptor; by day 30 in vitro over 90% of the neurons expressed either the D1 or D2 receptor. The issue of overlapping expression was not studied directly, but separate populations were implied by the selective neurotoxic effects of kainic acid on the D2 receptor bearing population. The difference between this result and ours may reflect our use of quantitative techniques to measure the extent of immunoreactivity in neuronal populations. Several studies have indirectly demonstrated the presence of D1 receptors in cultured striatal neurons by measuring downstream effects on cAMP signaling cascades (Cole et al., 1994; Price et al., 1999). There have not been reports of D2-receptor activity in cultured striatal neurons. Given the recent findings of Lee et al. (2004) described above, it may necessary to re-explore the effect of D2 agonists in combination with D1-agonists in cultured striatal neurons.
Modulation of basal ganglia function by peptide neurotransmitters is another important area in need of further research. The direct pathway utilizes substance P and dynorphin as a cotransmitter, while the indirect pathway utilizes enkephalin (Lee et al., 1997). The precise physiological role of these neuromodulators has not been elucidated, but several lines of evidence indicate that enkephalinergic transmission becomes disordered in advancing Parkinson’s disease (Calon, 2002; Henry et al., 2003). In this report, we demonstrate the presence of a subset of enkephalinergic neurons maintained in vitro. Prior studies have measured the level of preproenkephalin (Mao and Wang, 2001) and proenkephalin (Schwartz, 1998) mRNA transcripts in cultured striatal neurons, but have not demonstrated the presence of peptides directly. Since enkephalin expression is dependent on extensive post-translational processing of precursor proteins, the immunocytochemical results presented here provide direct evidence that a subset of cultured neurons exhibits an enkephalinergic phenotype.
We also studied the distribution of calcium binding proteins and cannabinoid receptors. As expected most neurons express CB, in keeping with immunocytochemical studies performed in adult tissue (Morel et al., 2002). Surprisingly, there was also a high abundance of CR-immunoreactive cells, which are a small minority of the population in the adult striatum and thought to represent an inhibitory GABA-ergic local circuit neuron (Figueredo-Cardenas et al., 1996). Since little is known about the physiology of this population, the large abundance present in culture provides a model system for their study. The reason for this unexpectedly high proportion of CR-immunoreactive neurons is unclear. It is possible that during differentiation, immature neurons in the striatum undergo a phenotypic switch. The presence of cells co-expressing both CB and CR is consistent with this idea. Cannabinoid receptors play an important physiological role in the basal ganglia (Julian et al., 2003). The endocannabinoid system is a powerful modulator of motor activity, and drugs active at the cannabinoid-1 receptor may be of use in movement disorders (Ferrer et al., 2003). In adult rodent brain, cannabinoid-1 receptors have been most readily detected at the projection target (GPi and substantia nigra pars reticulata) of the medium spiny neurons indicating a location on axonal terminals. On the other hand, pharmacological and anatomical evidence indicates that cannabinoid receptors are also present on the medium spiny neuron soma and dendrites within the striatum, although their physiological role has not been determined. The presence of cannabinoid-1 receptors in cultured striatal neurons should prove useful in studies of the pharmacology of the striatal endocannabinoid system.
We surveyed the expression of some of the key K+ channel subunits typical of the striatum. Consistent with findings in adult tissue (Chung et al., 2000), members of the Kv1 class of voltage gated K+ were present in cultured striatal neurons. The genetic manipulation of voltage-gated K+ channels as a means of altering electrical has been explored by our laboratory (Falk et al., 2001; 2003) and others (White et al., 2001). This technique will be particularly important to the development of therapeutic strategies designed to modify brain circuits with abnormal activity due to neurological disease. Neuronal promoters may confer cell-type specificity allowing the targeted modification of particular neuronal elements within basal ganglia circuits. For example, a viral vector targeting elements of the direct versus the indirect pathway could be anatomically localized to the motor control regions of the striatum and directed to a specific pathway using cell-type specific promoters. If successful this strategy would have applications to a number of movement disorders in which these pathways become unbalanced and expand gene therapy options now under development (During et al., 2001; Luo et al., 2002).
The use of cultured striatal neurons as a model system will facilitate the screening of candidate promoters and ion channel constructs that may be suitable for further testing in vivo. In this report we demonstrate the presence of Kir2 and Kvβ1.1 subunits, both of which may be useful targets for therapeutic manipulation. The neurons of the basal ganglia have a prominent A-type current and pacemaker currents that play a role in the regulation of electrical activity (Surmeier et al., 1989; Xu, 1995). The A-type current is regulated by the presence of Kvβ1 subunits and viral-mediated antisense knockdown of Kvβ1.1 decreases neuronal firing rate (Falk et al., 2003). The inward rectifier K+ channels (Kir) are differentially expressed in basal ganglia sub-circuits (Pruess et al., 2003) and regulate the expression of pacemaker activity in some tissues. Dominant negative knockdown and overexpression of Kir channels has been used to influence cellular electrical activity and thus present a potential target for therapeutic manipulation (Ehrengruber, et al., 1997; Nadeau et al., 2000).
We also report the characteristics of whole cell K+ currents and firing patterns of cultured basal ganglia neurons using patch clamp. We have extended the results of a single report that demonstrated the presence of the A-type current in cultured striatal neurons (Hamon et al., 1997). Parak et al. 2001 studied the developmental changes of the combined voltage-gated inward and outward currents of striatal neurons grown on different substrates and found an increase during the second week of culture. Since the Na+ currents were not blocked in their preparation the maximal K+ current amplitude and the τ of inactivation could not be directly compared to our data. While further pharmacological and electrophysiological dissection of the currents is beyond the scope of this report, these results indicate that cultured striatal neurons display complex spontaneous and evoked firing patterns. The molecular species underlying these electrical behaviors likely involve multiple channel subtypes. The immunocytochemical survey of K+ channel subtypes indicates the presence of several candidate molecular species (Kvβ1.1, Kv1.1, Kv1.4, Kv4.2, Kv4.3) that could contribute to the A-type current. The culture system will be amenable to molecular dissection of these currents using antisense or RNA interference techniques.
The electrophysiological analysis of the cultured striatal neurons demonstrates several features consistent with published data for recordings performed in vitro (Kowalski et al., 1995). The relative paucity of spontaneous activity and slow firing frequencies we found in cultured neurons is similar to the notoriously quiescent pattern observed in vivo, even in awake behaving animals (Wilson, 1998). Similarly, the clustering or bursting of activity of striatal neurons that has been described during the onset and offset of rewarded motor tasks is similar to the spontaneous bursting activity prevalent in our cultured neuronal population. As reviewed by Wilson (1998), the low level of electrical activity found in vivo reflects the intrinsic properties of striatal neurons rather high tonic inhibitory input. In this regard, cultured striatal neurons appear to be a faithful model of these intrinsic ionic currents. Our preparation is partially deafferented, but likely contains many synaptic connections between developing neurons. Thus, the differing firing patterns observed among the sample of neurons studied (see Fig.12) may result from the development of neuronal circuits in vitro rather than reflecting separate neuronal subtypes (Kowalski et al., 1995).
The present analysis of immunocytochemical and electrophysiological properties of cultured striatal neurons demonstrate that this preparation is a useful model system for the detailed study of basal ganglia physiology. Cultured neurons display many of the major neurochemical markers found in vivo, including dopamine receptors, GAD, calcium binding proteins, cannabinoid receptors, and K+ channels subtypes that contribute to the A-type and inward rectifier currents. Cultured striatal neurons also demonstrate co-expression of dopamine receptor subtypes and will find utility in dissecting the complex modulatory effects of dopamine at the single neuron level.
Acknowledgements
We would like to thank Dr. A.J. Yool for comments, A. Kumar for assistance with statistical modeling and J.W. Worrell, J. Kennedy, and P. Patel for technical assistance. This work was supported by NINDS grant R21 NSO43724-02 to S.J.S.
Supporting Grant: The research was supported by NIH Research Grant R21 NSO43724-02 to S.J.S.
Literature Cited
- Brotchie JM. CB1 cannabinoid receptor signaling in Parkinson's disease. Curr Opin Pharmacol. 2003;3:54–61. doi: 10.1016/s1471-4892(02)00011-5. [DOI] [PubMed] [Google Scholar]
- Calon F, Birdi S, Rajput AH, Hornykiewicz O, Bedard PJ, Di PT. Increase of preproenkephalin mRNA levels in the putamen of Parkinson disease patients with levodopa-induced dyskinesias. J Neuropathol Exper Neurol. 2002;61:186–196. doi: 10.1093/jnen/61.2.186. [DOI] [PubMed] [Google Scholar]
- Chung YH, Shin CM, Kim MJ, Cha CI. Immunohistochemical study on the distribution of six members of the Kv1 channel subunits in the rat basal ganglia. Brain Res. 2000;875:164–170. doi: 10.1016/s0006-8993(00)02586-5. [DOI] [PubMed] [Google Scholar]
- Centonze D, Bracci E, Pisani A, Gubellini P, Bernardi G, Calabresi P. Activation of dopamine D1-like receptors excites LTS interneurons of the striatum. Eur J Neurosci. 2002;15:2049–2052. doi: 10.1046/j.1460-9568.2002.02052.x. [DOI] [PubMed] [Google Scholar]
- Cole DG, Kobierski LA, Konradi C, Hyman SE. 6-Hydroxydopamine lesions of rat substantia nigra up-regulate dopamine-induced phosphorylation of the cAMP-response element-binding protein in striatal neurons. Proc Natl Acad Sci USA. 1994;91:9631–9635. doi: 10.1073/pnas.91.20.9631. [DOI] [PMC free article] [PubMed] [Google Scholar]
- Dotti CG, Banker G. Intracellular organization of hippocampal neurons during the development of neuronal polarity. J Cell Sci. 1991;15 Supp:75–84. doi: 10.1242/jcs.1991.supplement_15.11. [DOI] [PubMed] [Google Scholar]
- During MJ, Kaplitt MG, Stern MB, Eidelberg D. Subthalamic GAD gene transfer in Parkinson disease patients who are candidates for deep brain stimulation. Human Gene Ther. 2001;12:1589–1591. [PubMed] [Google Scholar]
- Ehrengruber MU, Doupnik CA, Xu Y, Garvey J, Jasek MC, Lester HA, Davidson N. Activation of heteromeric G protein-gated inward rectifier K+ channels overexpressed by adenovirus gene transfer inhibits the excitability of hippocampal neurons. Proc Natl Acad Sci USA. 1997;94:7070–7075. doi: 10.1073/pnas.94.13.7070. [DOI] [PMC free article] [PubMed] [Google Scholar]
- Falk T, Meyerhof W, Corrette BJ, Schafer J, Bauer CK, Schwarz JR, Richter D. Cloning, functional expression and mRNA distribution of an inwardly rectifying potassium channel protein. FEBS Lett. 1995;367:127–131. doi: 10.1016/0014-5793(95)00527-g. [DOI] [PubMed] [Google Scholar]
- Falk T, Kilani RK, Yool AJ, Sherman SJ. Viral vector-mediated expression of K+ channels regulates electrical excitability in skeletal muscle. Gene Ther. 2001;8:1372–1379. doi: 10.1038/sj.gt.3301539. [DOI] [PubMed] [Google Scholar]
- Falk T, Kilani RK, Strazdas LA, Borders RS, Steidl JV, Yool AJ, Sherman SJ. Developmental regulation of the A-type potassium-channel current in hippocampal neurons: role of the Kvβ 1.1 subunit. Neurosci. 2003;120:387–404. doi: 10.1016/s0306-4522(03)00044-7. [DOI] [PubMed] [Google Scholar]
- Ferrer B, Asbrock N, Kathuria S, Piomelli D, Giuffrida A. Effects of levodopa on endocannabinoid levels in rat basal ganglia: implications for the treatment of levodopa-induced dyskinesias. Europ J Neurosci. 2003;18:1607–1614. doi: 10.1046/j.1460-9568.2003.02896.x. [DOI] [PubMed] [Google Scholar]
- Figueredo-Cardenas G, Medina L, Reiner A. Calretinin is a largely localized to a unique population of striatal interneurons in rats. Brain Res. 1996;709:145–150. doi: 10.1016/0006-8993(95)01392-x. [DOI] [PubMed] [Google Scholar]
- Gerfen CR. The neostriatal mosaic: multiple levels of compartmental organization. J Neural Transmiss. 1992;S36:43–59. doi: 10.1007/978-3-7091-9211-5_4. [DOI] [PubMed] [Google Scholar]
- Gerfen CR, Keefe KA, Gauda EB. D1 and D2 dopamine receptor function in the striatum: coactivation of D1- and D2-dopamine receptors on separate populations of neurons results in potentiated immediate early gene response in D1-containing neurons. J Neurosci. 1995;15:8167–8176. doi: 10.1523/JNEUROSCI.15-12-08167.1995. [DOI] [PMC free article] [PubMed] [Google Scholar]
- Hamon B, Glowinski J, Giaume C. Nicotine inhibits slowly inactivating K+ currents in rat cultured striatal neurons. Pflugers Archiv - Europ J Physiol. 1997;434:642–645. doi: 10.1007/s004240050447. [DOI] [PubMed] [Google Scholar]
- Hersch SM, Ciliax BJ, Gutekunst CA, Rees HD, Heilman CJ, Yung KK, Bolam JP, Ince E, Yi H, Levey AI. Electron microscopic analysis of D1 and D2 dopamine receptor proteins in the dorsal striatum and their synaptic relationships with motor corticostriatal afferents. J Neurosci. 1995;15:5222–5237. doi: 10.1523/JNEUROSCI.15-07-05222.1995. [DOI] [PMC free article] [PubMed] [Google Scholar]
- Herrero MT, Barcia C, Navarro JM. Functional anatomy of thalamus and basal ganglia. Childs Nervous System. 2002;18:386–404. doi: 10.1007/s00381-002-0604-1. [DOI] [PubMed] [Google Scholar]
- Hille B. Ionic Channels of Excitable Membranes. Third Edition. Sunderland MA: Sinauer; 2002. [Google Scholar]
- Henry B, Duty S, Fox SH, Crossman AR, Brotchie JM. Increased striatal pre-proenkephalin B expression is associated with dyskinesia in Parkinson's disease. Exp Neurol. 2003;18:458–468. doi: 10.1016/s0014-4886(03)00064-5. [DOI] [PubMed] [Google Scholar]
- Hoyt KR, Reynolds IJ. Localization of D1 dopamine receptors on live cultured striatal neurons by quantitative fluorescence microscopy. Brain Res. 1996;731:21–30. doi: 10.1016/0006-8993(96)00436-2. [DOI] [PubMed] [Google Scholar]
- Julian MD, Martin AB, Cuellar B, Rodriguez De Fonseca F, Navarro M, Moratalla R, Garcia-Segura LM. Neuroanatomical relationship between type 1 cannabinoid receptors and dopaminergic systems in the rat basal ganglia. Neurosci. 2003;119:309–318. doi: 10.1016/s0306-4522(03)00070-8. [DOI] [PubMed] [Google Scholar]
- Kessler JA. Differential regulation of cholinergic and peptidergic development in the rat striatum in culture. Develop Biol. 1986;113:77–89. doi: 10.1016/0012-1606(86)90109-0. [DOI] [PubMed] [Google Scholar]
- Kowalski C, Crest M, Vuillet J, Pin T, Gola M, Nieoullon A. Emergence of a synaptic neuronal network within primary striatal cultures seeded in serum-free medium. Neurosci. 1995;64(4):979–993. doi: 10.1016/0306-4522(94)00453-c. [DOI] [PubMed] [Google Scholar]
- Kubo Y, Baldwin TJ, Jan YN, Jan LY. Primary structure and functional expression of a mouse inward rectifier potassium channel. Nature. 1993;362:127–133. doi: 10.1038/362127a0. [DOI] [PubMed] [Google Scholar]
- Lee T, Kaneko T, Taki K, Mizuno N. Preprodynorphin-, preproenkephalin-, and preprotachykinin-expressing neurons in the rat neostriatum: an analysis by immunocytochemistry and retrograde tracing. J Comp Neurol. 1997;386:229–244. doi: 10.1002/(sici)1096-9861(19970922)386:2<229::aid-cne5>3.0.co;2-3. [DOI] [PubMed] [Google Scholar]
- Lee SP, So CH, Rashid AJ, Varghese G, Cheng R, Lanca AJ, O'Dowd BF, George SR. Dopamine D1 and D2 receptor Co-activation generates a novel phospholipase C-mediated calcium signal. J Biol Chem. 2004;279:35671–35678. doi: 10.1074/jbc.M401923200. [DOI] [PubMed] [Google Scholar]
- Liss B, Franz O, Sewing S, Bruns R, Neuhoff H, Roeper J. Tuning pacemaker frequency of individual dopaminergic neurons by Kv4.3L and KChip3.1 transcription. EMBO J. 2001;20:5715–5724. doi: 10.1093/emboj/20.20.5715. [DOI] [PMC free article] [PubMed] [Google Scholar]
- Luo J, Kaplitt MG, Fitzsimons HL, Zuzga DS, Liu Y, Oshinsky ML, During MJ. Subthalamic GAD gene therapy in a Parkinson's disease rat model. Science. 2002;298:425–429. doi: 10.1126/science.1074549. [DOI] [PubMed] [Google Scholar]
- Mandell JW, Banker GA. Microtubule-associated proteins, phosphorylation gradients, and the establishment of neuronal polarity. Persp Develop Neurobiol. 1996;4:125–135. [PubMed] [Google Scholar]
- Martin DL, Barke KE. Are GAD65 and GAD67 associated with specific pools of GABA in brain? Persp Develop Neurobiol. 1998;5:119–129. [PubMed] [Google Scholar]
- Mao L, Wang JQ. Upregulation of preprodynorphin and preproenkephalin mRNA expression by selective activation of group I metabotropic glutamate receptors in characterized primary cultures of rat striatal neurons. Brain Res Mol Brain Res. 2001;86:125–137. doi: 10.1016/s0169-328x(00)00276-x. [DOI] [PubMed] [Google Scholar]
- Meador-Woodruff JH, Mansour A, Healy DJ, Kuehn R, Zhou QY, Bunzow JR, Akil H, Civelli O, Watson SJ., Jr. Comparison of the distributions of D1 and D2 dopamine receptor mRNAs in rat brain. Neuropsychopharmacol. 1991;5:231–242. [PubMed] [Google Scholar]
- Mesco ER, Joseph JA, Roth GS. Selective susceptibility of cultured striatal neurons to kainic acid. J Neurosc Res. 1992;31:341–345. doi: 10.1002/jnr.490310216. [DOI] [PubMed] [Google Scholar]
- Mermelstein PG, Song WJ, Tkatch T, Yan Z, Surmeier DJ. Inwardly rectifying potassium (IRK) currents are correlated with IRK subunit expression in rat nucleus accumbens medium spiny neurons. J Neurosci. 1998;18:6650–6661. doi: 10.1523/JNEUROSCI.18-17-06650.1998. [DOI] [PMC free article] [PubMed] [Google Scholar]
- Morel A, Loup F, Magnin M, Jeanmonod D. Neurochemical organization of the human basal ganglia: anatomofunctional territories defined by the distribution of calcium-binding proteins and SMI-32. J Comp Neurol. 2002;443:86–103. doi: 10.1002/cne.10096. [DOI] [PubMed] [Google Scholar]
- Morris BJ, Newman-Tancredi A, Audinot V, Simpson CS, Millan MJ. Activation of dopamine D(3) receptors induces c-fos expression in primary cultures of rat striatal neurons. J Neurosci Res. 2000;59(6):740–749. doi: 10.1002/(SICI)1097-4547(20000315)59:6<740::AID-JNR6>3.0.CO;2-F. [DOI] [PubMed] [Google Scholar]
- Nadeau H, McKinney S, Anderson DJ, Lester HA. ROMK1 (Kir1.1) causes apoptosis and chronic silencing of hippocampal neurons. J Neurophysiol. 2000;84(2):1062–1075. doi: 10.1152/jn.2000.84.2.1062. [DOI] [PubMed] [Google Scholar]
- Nisenbaum ES, Wilson CJ. Potassium currents responsible for inward and outward rectification in rat neostriatal spiny projection neurons. J Neurosci. 1995;15:4449–4463. doi: 10.1523/JNEUROSCI.15-06-04449.1995. [DOI] [PMC free article] [PubMed] [Google Scholar]
- Ohno Y, Sasa M, Takaori S. Coexistence of inhibitory dopamine D-1 and excitatory D-2 receptors on the same caudate nucleus neurons. Life Sci. 1987;40:1937–1945. doi: 10.1016/0024-3205(87)90054-3. [DOI] [PubMed] [Google Scholar]
- Paolillo M, Montecucco A, Zanassi P, Schinelli S. Potentiation of dopamine-induced cAMP formation by group I metabotropic glutamate receptors via protein kinase C in cultured striatal neurons. Europ J Neurosci. 1998;10:1937–1945. doi: 10.1046/j.1460-9568.1998.00203.x. [DOI] [PubMed] [Google Scholar]
- Parak WJ, George M, Kudera M, Gaub HE, Behrends JC. Effects of semiconductor substrate and glia-free culture on the development of voltage-dependent currents in rat striatal neurons. Eur Biophys J. 2001;29(8):607–620. doi: 10.1007/s002490000109. [DOI] [PubMed] [Google Scholar]
- Parent A, Fortin M, Cote PY, Cichetti F. Calcium-binding proteins in primate basal ganglia. Neurosci Res. 1996;25:309–334. doi: 10.1016/0168-0102(96)01065-6. [DOI] [PubMed] [Google Scholar]
- Parent A, Sato F, Wu Y, Gauthier J, Levesque M, Parent M. Organization of the basal ganglia: the importance of axonal collateralization. Trends Neurosci. 2000;23(10 Suppl):S20–S27. doi: 10.1016/s1471-1931(00)00022-7. [DOI] [PubMed] [Google Scholar]
- Paxinos G, Ashwell KWS, Tork I. Atlas of the developing rat nervous system. Second Edition. New York, NY: Academic Press; 1990. [Google Scholar]
- Popp RL, Lickteig R, Browning MD, Lovinger DM. Ethanol sensitivity and subunit composition of NMDA receptors in cultured striatal neurons. Neuropharmacol. 1998;37:45–56. doi: 10.1016/s0028-3908(97)00186-x. [DOI] [PubMed] [Google Scholar]
- Price CJ, Kim P, Raymond LA. D1 dopamine receptor-induced cyclic AMP-dependent protein kinase phosphorylation and potentiation of striatal glutamate receptors. J Neurochem. 1999;73:2441–2446. doi: 10.1046/j.1471-4159.1999.0732441.x. [DOI] [PubMed] [Google Scholar]
- Pruess H, Wenzel M, Eulitz D, Thomzig A, Karschin A, Veh RW. Kir2 potassium channels in rat striatum are strategically localized to control basal ganglia function. Brain Res Mol Brain Res. 2003;110:203–219. doi: 10.1016/s0169-328x(02)00649-6. [DOI] [PubMed] [Google Scholar]
- Rettig J, Heinemann SH, Wunder F, Lorra C, Parcej DN, Dolly JO, Pongs O. Inactivation properties of voltage-gated K+ channels altered by presence of beta-subunit. Nature. 1994;369:289–294. doi: 10.1038/369289a0. [DOI] [PubMed] [Google Scholar]
- Schroeter H, Spencer JP, Rice-Evans C, Williams RJ. Flavonoids protect neurons from oxidized low-density-lipoprotein-induced apoptosis involving c-Jun N-terminal kinase (JNK), c-Jun and caspase-3. Biochem J. 2001;358:547–557. doi: 10.1042/0264-6021:3580547. [DOI] [PMC free article] [PubMed] [Google Scholar]
- Schwaller B, Meyer M, Schiffmann S. 'New' functions for 'old' proteins: the role of the calcium-binding proteins calbindin D-28k, calretinin and parvalbumin, in cerebellar physiology, Studies with knockout mice. Cerebellum. 2002;1(4):241–258. doi: 10.1080/147342202320883551. [DOI] [PubMed] [Google Scholar]
- Schwartz JP, Simantov R. Developmental expression of proenkephalin mRNA in rat striatum and in striatal cultures. Brain Res. 1998;468:311–314. doi: 10.1016/0165-3806(88)90144-7. [DOI] [PubMed] [Google Scholar]
- Sherman SM, Guillery RW. Exploring the thalamus. San Diego, CA: Academic Press; 2002. Ch 4. [Google Scholar]
- Sloviter RS, Ali-Akbarian L, Horvath KD, Menkens KA. Substance P receptor expression by inhibitory interneurons of the rat hippocampus: enhanced detection using improved immunocytochemical methods for the preservation and colocalization of GABA and other neuronal markers. J Comp Neurol. 2001;430:283–305. [PubMed] [Google Scholar]
- Smith Y, Kieval JZ. Anatomy of the dopamine system in the basal ganglia. Trends Neurosci. 2000;23:S28–S33. doi: 10.1016/s1471-1931(00)00023-9. [DOI] [PubMed] [Google Scholar]
- Sucher NJ, Deitcher DL, Baro DJ, Warrick RM, Guenther E. Genes and channels: patch/voltage-clamp analysis and single-cell RT-PCR. Cell & Tissue Res. 2000;302:295–307. doi: 10.1007/s004410000289. [DOI] [PubMed] [Google Scholar]
- Surmeier DJ, Bargas J, Kitai ST. Two types of A-current differing in voltage-dependence are expressed by neurons of the rat neostriatum. Neurosci Lett. 1989;103:331–337. doi: 10.1016/0304-3940(89)90122-5. [DOI] [PubMed] [Google Scholar]
- Surmeier DJ, Reiner A, Levine M, Ariano M. Are neostraiatal dopamine receptors colocalized? Trends Neurosci. 1993;16:299–305. doi: 10.1016/0166-2236(93)90103-s. [DOI] [PubMed] [Google Scholar]
- Tence M, Murphy N, Cordier J, Premont J, Glowinski J. Synergistic effects of acetylcholine and glutamate on the release of arachidonic acid from cultured striatal neurons. J Neurochem. 1995;64:1605–1613. doi: 10.1046/j.1471-4159.1995.64041605.x. [DOI] [PubMed] [Google Scholar]
- Ulfig N. Calcium-binding proteins in the human developing brain. Adv Anat Embryol Cell Biol. 2002;165:III–IX. 1–92. [PubMed] [Google Scholar]
- Vaysse PJ, Zukin RS, Fields KL, Kessler JA. Characterization of opioid receptors in cultured neurons. J Neurochem. 1990;55:624–631. doi: 10.1111/j.1471-4159.1990.tb04179.x. [DOI] [PubMed] [Google Scholar]
- Vilchis C, Bargas J, Perez-Rosello T, Salgado H, Galarraga E. Somatostatin modulates Ca2+ currents in neostriatal neurons. Neuroscience. 2002;109(3):555–567. doi: 10.1016/s0306-4522(01)00503-6. [DOI] [PubMed] [Google Scholar]
- Wilson CJ. Basal ganglia. In: Shepherd GM, editor. The synaptic organization of the brain. 4th edition. Ch 9. New York: Oxford University Press; 1998. [Google Scholar]
- White B, Osterwalder T, Keshishian H. Molecular genetic approaches to the targeted suppression of neuronal activity. Curr Biol. 2001;11:R1041–1053. doi: 10.1016/s0960-9822(01)00621-2. [DOI] [PubMed] [Google Scholar]
- Xu ZC. Neurophysiological changes of spiny neurons in rat neostriatum after transient forebrain ischemia: an in vivo intracellular recording and staining study. Neurosci. 1995;67:823–836. doi: 10.1016/0306-4522(95)00096-2. [DOI] [PubMed] [Google Scholar]