

Abstract
Autophagy is a catabolic process where lysosomes degrade intracytoplasmic contents transported in double-membraned autophagosomes. Autophagosomes are formed by elongation and fusion of phagophores, which derive from pre-autophagosomal structures. The membrane origins of autophagosomes are unclear and may involve multiple sources, including the endoplasmic reticulum and mitochondria. Here we show in mammalian cells that clathrin heavy-chain interacts with Atg16L1, and is involved in the formation of Atg16L1-positive early autophagosome precursors. Inhibition of clathrin-mediated internalisation reduced the formation of both Atg16L1-positive precursors and mature autophagosomes, while Atg16L1 associated with clathrin-coated structures. We tested and demonstrated that the plasma membrane (PM) directly contributes to the formation of early Atg16L1-positive autophagosome precursors. This may be particularly important during periods of increased autophagosome formation, as the plasma membrane may serve as a large membrane reservoir that allows cells periods of autophagosome synthesis at levels many-fold higher than under basal conditions, without compromising other processes.
Autophagy is a highly conserved catabolic process where intracytoplasmic proteins and organelles are engulfed in double-membraned vesicles called autophagosomes and then transported to lysosomes for degradation. Autophagosomes are formed by elongation and fusion of phagophores, which are formed from pre-autophagosomal structures. The membrane origins of autophagosomes are unclear and may involve multiple sources, although contributions from the endoplasmic reticulum and mitochondria have been proposed 1-4. The biogenesis of mammalian (and yeast) autophagosomes involves two ubiquitin-like molecules, Atg12 and LC3/Atg8 5. In the first of these reactions, the C-terminal glycine of Atg12 is covalently linked to an internal lysine in Atg5. The Atg12-Atg5 conjugate then forms an 800 kDa complex with Atg16L1 6. Atg16L1 localises to the outer surface of the pre-autophagosomal structures, and dissociates from fully formed (mature) autophagosomes 5. Thus, Atg16L1-positive vesicles represent pre-autophagosomal structures. In the second ubiquitin-like reaction, LC3 is conjugated to phosphatidylethanolamine (PE) to form lipidated LC3-II, which is specifically targeted to elongating pre-autophagosomal structures and then remains on mature autophagosomes, until after fusion with lysosomes 5. Accordingly, LC3-II levels, as a function of actin/tubulin or LC3-positive vesicles, reflect autophagosome numbers in the cell. The Atg12-Atg5 complex displays an E3 ligase-like activity for LC3-PE conjugation 7. Furthermore, localisation of Atg16L1 complex is an important determinant of the site of LC3 lipidation 8. Interestingly, a recent genome-wide association study identified a variant of Atg16L1 (T300A) that is overrepresented in Crohn's disease patients 9.
Results
Atg16L1 interacts with clathrin-heavy chain
In order to understand the roles of Atg16L1, we performed mass spectrometry analysis on cell lysates immunoprecipitated with an antibody against endogenous Atg16L1, which identified clathrin-heavy chain (a major component of coated vesicles that plays a vital role in the endocytic pathway) as a novel interactor (Fig. 1A). We validated the interaction by performing co-immunoprecipitation experiments (Fig. 1B, 1C). We found that endogenous clathrin-heavy chain interacted both with endogenous or over-expressed Atg16L1, and this interaction was mediated via the N-terminal region of Atg16L1 (Fig. 1B, 1C). Since Atg5 also interacts with the N-terminal region of Atg16L1 6 (Fig. 1B), we tested if over-expression of increasing concentrations of Atg5 altered the clathrin-Atg16L1 interaction. Since we observed no obvious effect of increasing Atg5 expression on clathrin-Atg16L1 interaction, it is likely that Atg5 and clathrin either bind to different sites on Atg16L1, or even to different subsets of Atg16L1 molecules (Fig. 1D). We also noted that clathrin heavy-chain interacted with the T300A variant of Atg16L1 with a similar efficiency as the “wild-type” Atg16L1, which is not surprising since the variant site is quite far downstream from the N-terminus (Supplementary Information, Fig. S1A).
Figure 1. Atg16L1 interacts with clathrin-heavy chain.
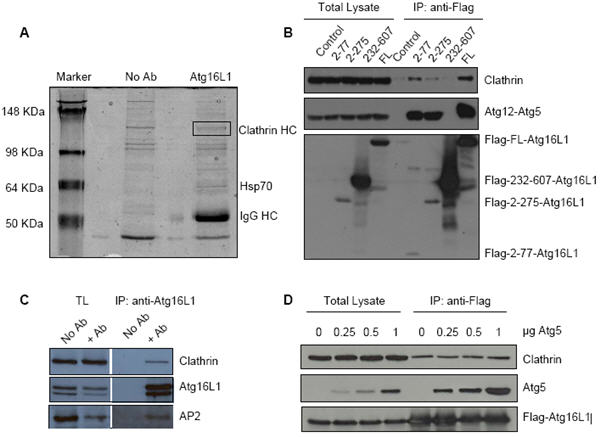
A. HeLa cell lysates were immunoprecipitated with Atg16L1 antibody (Atg16L1) or no antibody (No Ab) in control, subjected to SDS-PAGE, and proteins were stained with SimplyBlue safe stain (Invitrogen) according to manufacturer's protocol. Bands indicated in the box were cut out and digested with trypsin, and identified by MALDIToF. B. HeLa cells transfected with control vector, or wild-type or different deletion mutants (2-77, 2-275, 232-607) of Flag-Atg16L1 for 24h were immunoprecipitated with anti-Flag antibody (Atg16L1) and immunoblotted with anti-clathrin, anti-Flag and anti-Atg5 antibodies. Clathrin interacts with the N-terminus of Atg16L1, similar to Atg12-Atg5. Total lysates were run alongside as controls for protein input. C. HeLa cell lysates were immunoprecipitated (IP) with Atg16L1 antibody (+Ab) or no antibody (No Ab) and immunoblotted with anti-clathrin, anti-AP2 and anti-Atg16L1 antibodies. Total cell lysates (TL) were also blotted for input controls. Endogenous Atg16L1 interacts with clathrin-heavy chain and AP2. D. HeLa cells transfected with Flag-Atg16L1 and increasing concentrations of Atg5 for 24h were immunoprecipitated (IP) with anti-Flag antibody (Atg16L1) and immunoblotted with anti-clathrin, anti-Flag and anti-Atg5 antibodies. Atg5 overexpression neither interferes with, nor increases, clathrin-Atg16L1 binding. TL – total cell lysate.
Clathrin-mediated endocytosis regulates early stages of autophagosome formation
Having shown that clathrin-heavy chain interacted with the autophagosome precursor marker, Atg16L1, we next tested if early steps in clathrin-mediated endocytosis regulated the initial stages of autophagosome formation. (This question needs to be distinguished from the distinct process where fully formed, mature (Atg16L1-negative) autophagosomes fuse with early and late endosomes to form the hybrid organelles called amphisomes, a step which appears to be important for subsequent autophagosome-lysosome fusion 10-12). We first tested the effect of knockdown of some key components involved in early endocytosis on autophagosome formation. Changes in the steady state-levels of LC3-II can be altered due to formation and/or degradation. In order to assess changes in LC3-II (autophagosome) formation, one can assess LC3-II levels in the presence of saturating concentrations of bafilomycin A1 (BafA1). Since BafA1 inhibits LC3-II degradation and autophagosome-lysosome fusion, differences in LC3-II levels in response to particular siRNAs in the presence of saturating levels of BafA1 reflect changes in LC3-II (autophagosome) synthesis 13, 14 (Supplementary Information, Fig. S1B, S1C). siRNA knockdown of clathrin-heavy chain, epsin 1, AP2 but not AP1, inhibited the formation of new autophagosomes by about 30%, since these perturbations decreased the LC3-II levels in the presence of bafilomycin A1 (BafA1) (Fig. 2A, 2B; Supplementary Information, Fig. S1D, S1E, S1F). Epsin is an accessory protein to clathrin that induces membrane curvature, while AP2 and AP1 are clathrin adaptor proteins at the plasma membrane and Golgi, respectively. We noted that the effects of clathrin-heavy chain knockdown on LC3-II levels in the absence of BafA1 varied – this is likely because clathrin knockdown decreases LC3-II formation, which will decrease LC3-II levels in the absence of BafA1, but clathrin knockdown also decreases autophagosome-lysosome fusion/LC3-II degradation 11 (also see below), which will increase LC3-II levels in the absence of BafA1, and the net effect will depend on the relative kinetics of the two systems, which may vary according to the efficiency of knockdown or the different treatment conditions used 14. Our impression was that the effects of clathrin knockdown on synthesis were more pronounced with more effective knockdowns – e.g. two rounds of knockdown for 5 days. Such strategies are known to be required for effective clathrin knockdown, due to its long half-life 15.
Figure 2. Inhibition of clathrin-mediated endocytosis decreases autophagosome formation.
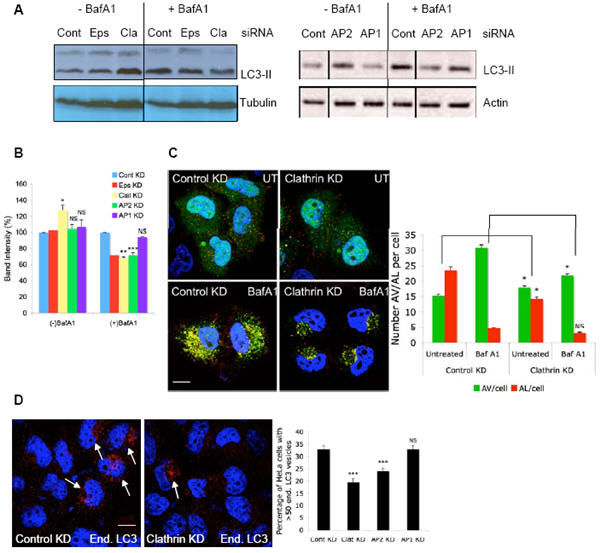
A. HeLa cells transfected with two rounds of control, epsin 1, clathrin-heavy chain, AP2 or AP1 siRNA for 5 d were either left untreated or treated with Bafilomycin A1 (+/− BafA1) for 4 h, after which they were lysed for western blot analysis with anti-LC3 and anti-tubulin antibodies. Note that LC3-I is often very faint compared to LC3-II in HeLa cells under the protein extraction conditions we use. But this is not a problem as it is advisable to relate LC3-II to tubulin/actin13, 14. B. Ratio of LC3-II to tubulin upon control, epsin, clathrin-heavy chain, AP2 or AP1 knockdown, with, or without Bafilomycin A1, is quantitated from three independent experiments (two for epsin) and represented in the graph. * - p<0.01, ** - p<0.001, *** - p<0.0001. C. HeLa cells stably expressing GFP-mRFP-LC3 17 were transfected with two rounds of control or clathrin-heavy chain siRNA for 5 d during which they were either left untreated (UT) or treated with Bafilomycin A1 (BafA1) for the last 15 h. Cells were then fixed and analysed on cellomics arrayscan system. Quantification of autophagic vacuoles (AV) or autolysosomes (AL) per cell in the different conditions is shown in the graph. * - p<0.01, NS - not significant. n = 2000 cells. D. HeLa cells transfected with control, clathrin-heavy chain, AP1 or AP2 siRNA for 4 d were grown in Hanks balanced salt solution (HBSS) for 6 h after which the cells were fixed and immunostained for endogenous LC3. The percentage of HeLa cells with more than 50 LC3-vesicles (marked with arrows) were counted as shown in the graph. *** - p<0.0001. n = 500 cells. All error bars in the graphs represent SEM.
In order to provide further support for the role of clathrin in autophagosome formation, given its additional effects that impair autophagosome maturation, we studied the effects of clathrin-heavy chain knockdown in HeLa cells stably expressing an mRFP-GFP-LC3 construct 16, 17. Due to the different pKa of the two fluorescent proteins, this construct can be used as a probe for autophagosome maturation. At physiological pH, i.e. in newly formed autophagosomes, both proteins are stable, leading to both red and green fluorescence. Upon acidification, i.e. fusion with the lysosome, green fluorescence is rapidly lost due to the high pKa of GFP and only red fluorescence remains 16, 17. Consistent with our LC3-II blotting data, clathrin-heavy chain knockdown resulted in an increase in the numbers of autophagosomes (red and green positive vesicles) and a decrease in the numbers of autolysosomes (red positive/green-negative) in the absence of BafA1 (due to decreased delivery of autophagosomes to lysosomes), but results in a decrease in the number of autophagosomes (about 30%) in the presence of BafA1 (due to impaired autophagosome formation) (Fig. 2C). As we saw with clathrin-heavy chain knockdown, AP2 knockdown also reduced autophagosome formation using this assay, while AP1 knockdown had no effect (Supplementary Information, Fig. S1G).
The effects of clathrin-heavy chain, epsin or AP2 knockdown on autophagosome formation (LC3-II levels under BafA1 conditions) were also obvious under autophagy induction conditions (trehalose treatment 18 or starvation (Supplementary Information, Fig. S2A, S2B, S2C)), where these knockdowns all reduced new autophagosome formation by about 30% (Supplementary Information, Fig. S2A, S2B, S2C). Consistent with our LC3 western blot data, we also observed a decrease in the proportion of cells with >50 endogenous LC3 vesicles under starvation conditions upon clathrin-heavy chain or AP2 knockdown (Fig. 2D). Similarly, we also saw a decrease in the proportion of cells transfected with tomato-LC3 with >50 LC3-vesicles in trehalose-treated cells with clathrin-heavy chain or epsin knockdowns or in untreated cells with AP2 knockdown (Supplementary Information, Fig. S3A, S3B, S3C).
The block in autophagic flux with clathrin-heavy chain, epsin or AP2 knockdown also correlated with an increase in aggregation of a model aggregate-prone protein, huntingtin exon-1 with 74 polyglutamine repeats (Q74) 19-21, which is a potent autophagy substrate 18, 22, 23 (Supplementary Information, Fig. S3D, S3E shows epsin 1 and AP2 data and the clathrin data were published previously 11) – since aggregation is a concentration-dependent phenomenon, the proportion of cells with these aggregates increases with a wide range of autophagy inhibitors and decreases with autophagy inducers 18, 22-24. We also found that clathrin or AP2 knockdown increased the levels of endogenous p62, another autophagy substrate (Supplementary Information, Fig. S3F, S3G). Clathrin knockdown also significantly increased the proportion of cells with endogenous p62 aggregates (Supplementary Information, Fig. S3G). However, since autophagic substrates will accumulate if there is either impaired autophagosome formation, and/or decreased delivery of autophagosomes to lysosomes, these substrate accumulation assays cannot distinguish between these scenarios.
Influence of clathrin-mediated endocytosis on Atg16L1-positive autophagosome precursors
Since the knockdown of clathrin-heavy chain, epsin or AP2 inhibited the formation of new autophagosomes, we next examined their effects on the formation of autophagosome precursors, as visualised by Atg16L1-positive structures 6, 8. Endogenous Atg16L1 shows a punctate staining pattern upon autophagy induction (e.g. starvation, rapamycin or trehalose treatments), corresponding to an increase in the formation of precursor structures (Fig. 3A, Supplementary Information, Fig. S4A, S4B and data not shown). Furthermore, endogenous Atg16L1 vesicle numbers were not increased by BafA1 (Supplementary Information, Fig. S4C), suggesting that this readout is not affected by perturbations that impair the lysosomal degradation of mature autophagosomes. We observed that knockdown of clathrin-heavy chain, epsin or AP2 (but not AP1) resulted in a ~30% decrease in the Atg16L1 vesicle formation under starvation conditions, suggesting a block in the formation of pre-autophagosomal structures (Fig. 3A, B, C, D, Supplementary Information, Fig. S4A, S4B). Knockdown of clathrin-heavy chain, epsin or AP2 also decreased the numbers of Atg16L1 structures associated with over-expressed Atg16L1 (data not shown; note that we found that low levels of Atg16L1 overexpression (400-750ng per 6 well) did not inhibit autophagosome formation, as has been reported for high-level viral overexpression 8). We found that the N-terminal deletion mutant of Atg16L1 (232-607) that did not interact with clathrin formed significantly fewer vesicles, compared to the wild-type protein or C-terminal deletion mutant that can bind clathrin (2-275) (Fig. 3E, 3F).
Figure 3. Influence of clathrin-mediated endocytosis on Atg16L1-positive autophagosome precursors.
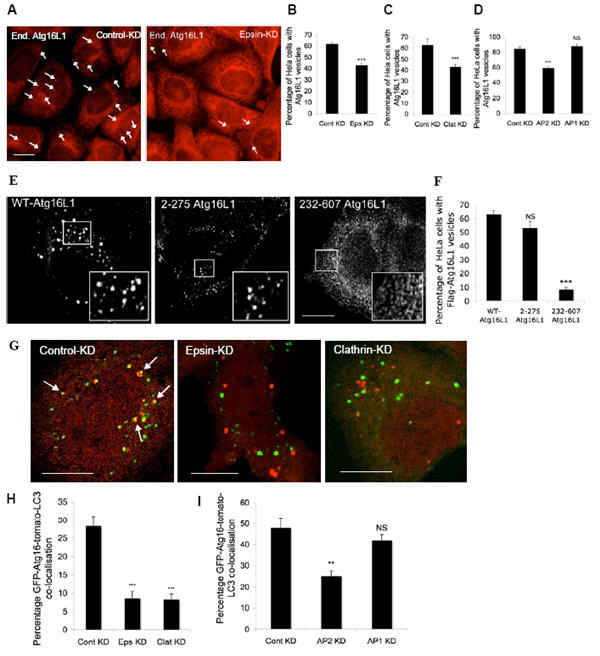
A, B, C, D. HeLa cells transfected with control, epsin 1, clathrin-heavy chain, AP2 or AP1 siRNA for 72 h were treated with Hanks balanced salt solution (to induce autophagy) for 6 h, after which they were fixed and immunostained for endogenous Atg16L1. The percentages of HeLa cells with Atg16L1 vesicles were quantitated. *** - p<0.0001. Scale bar – 10 μm. (Note that we used single siRNAs for all experiments and the effects were confirmed with two independent sequences for clathrin-heavy chain). n = 600 cells. E. F. HeLa cells transfected with Flag-tagged wild-type Atg16L1 or the Atg16L1 deletion mutants - 2-275 or 232-607 Atg16L1 for 24 h were fixed and imunostained with anti-Flag antibody and the proportion of cells with Flag-Atg16L1 vesicles were quantitated and represented in the graph. Representative images of Atg16L1 vesicles with the different mutant constructs is shown in the top panel. NS – not significant, *** - p<0.0001. n = 100 cells. G, H, I. HeLa cells transfected with control, epsin 1, clathrin-heavy chain, AP2 or AP1 siRNA, as above, were transfected with GFP-Atg16L1 and tomato-LC3 for a further 24 h, after which the cells were fixed. Percentage of GFP-Atg16L1 (green) that co-localised (yellow, marked by arrows) with tomato-LC3 vesicles (red) was quantitated as shown in the graph. n = 21 cells. *** - p<0.0001. Scale bar – 10 μm. All error bars in the graphs represent SEM.
During the autophagosome formation process, LC3-II is recruited onto the Atg16L1-positive pre-autophagosomal structures, which ultimately fuse to form autophagosomes, at which point the Atg16L1 complex is removed and recycled. We next performed co-localisation experiments with GFP-Atg16L1 and tomato-LC3 vesicles, to assess the progression of autophagosome formation from early pre-autophagosomal structures (Atg16L1-positive/LC3-negative) to maturing autophagosomes (Atg16L1-positive/LC3-positive). We found that clathrin-heavy chain, epsin or AP2 knockdown decreased the co-localisation of GFP-Atg16L1 vesicles with tomato-LC3 vesicles (Figs. 3G, 3H, 3I), which likely suggests that these proteins regulate the formation of autophagosomes at a very early stage in the pathway.
Plasma membrane contributes to autophagosome precursors
During our analyses of pre-autophagosomal structure formation, we often found Atg16L1 vesicles close to the plasma membrane (Fig. 4A). This observation was supported by TIRF microscopy (TIRFM), which enables selective visualisation of thin regions, such as the plasma membrane (and the cytoplasmic area immediately beneath it). TIRFM with GFP-Atg16L1 and mRFP-tagged GPi (glycophosphatidylinositol) protein (found in small microdomains at the plasma membrane) revealed many Atg16L1 vesicles (Fig. 4B) that also co-localised significantly with mRFP-GPi structures (Fig. 4B), suggesting that the GFP-Atg16L1 vesicles were at, or very close to, the plasma membrane. Indeed, immuno-gold electron microscopy (immuno-EM) analysis of GFP-Atg16L1-transfected cells showed Atg16L1 labelling on clathrin-coated vesicle profiles near the plasma membrane (Fig. 4C, untreated panels). These data, together with our earlier observation that autophagosome formation is impaired upon inhibition of very early endocytic trafficking, suggested that plasma membrane might be a source of membrane for the pre-autophagosomal structures.
Figure 4. Atg16L1 vesicles are found close to the plasma membrane.
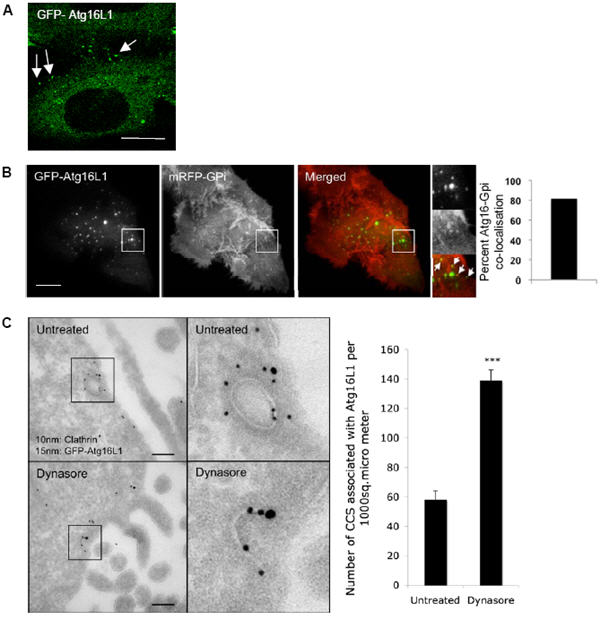
A. HeLa cells transfected with GFP-Atg16L1 for 24 h were fixed to visualise the Atg16L1 vesicles (green). Scale bar – 10 μm. B. HeLa cells transiently transfected with GFP-Atg16L1 and mRFP-GPi for 20 h were cultured in starvation medium for a further 2 h. TIRF image with GFP-Atg16L1 (green) and mRFP-GPi (red) is shown. Arrows indicate co-localization between Atg16L1 and GPi. Percentage co-localisation of GFP-Atg16L1 with mRFP-GPi is shown in the graph. n = 2. Scale bar – 5 μm. C. HeLa cells transfected with GFP-Atg16L1 for 24 h, were either left untreated or treated with 50 μM dynasore (Sigma) for 4h and processed for immuno-gold EM with anti-GFP (15 nm gold particles) and anti-clathrin (10 nm gold particles) antibodies. Co-localisation can be seen in boxed areas. Quantification of clathrin-coated structures (CCS) that were associated with Atg16L1 per 1000 μM2 is shown in the graph. *** - p<0.0001. Scale bar – 100 nm. All error bars in the graphs represent SEM.
We next used different assays to assess the role of plasma membrane as a membrane contributor for autophagosome initiation. We used the cholera toxin-subunit B internalisation assay25 to assess if the plasma membrane fused with GFP-Atg16L1 vesicles, as visualised by live-cell or fixed-cell microscopy and double-labelling immuno-EM. This assay relies on the binding of cholera toxin to the outside of the plasma membrane and its subsequent internalisation to track whether the plasma membrane is contributing to early precursor structures. Cholera toxin internalisation into HeLa cells is significantly attenuated by inhibition of clathrin-mediated endocytosis 15, 26. At very early time points, immediately after incubation with the cholera toxin, we observed clear labelling of the plasma membrane, and vesicles immediately internalising from the plasma membrane were often fused with GFP-Atg16L1 vesicles close to the plasma membrane (Fig. 5A, Supplementary Information, Fig. S5A, S5B, Movie S1). We observed many GFP-Atg16L1 vesicles close to the cell surface that co-localised with vesicles positive for cholera toxin (Fig. 5A, 5B, Supplementary Information, Fig. S5A, S5B). We noted that many of the small GFP-Atg16L1 vesicles close to the plasma membrane were LC3-negative (Fig. 5A yellow arrows on the merged panel), suggesting that they were very early precursors that later acquired the characteristics of phagophore when they were also LC3-positive (Fig. 5A blue arrows on the merged panel). The number of GFP-Atg16L1 vesicles decreased with 3-methyladenine treatment which blocks autophagosome formation (Supplementary Information, Fig. S5C). The GFP-Atg16L1 vesicles co-localised with other early autophagosomal markers like Atg5 and Atg12 (but did not co-localise with ER (BiP) or Golgi (GM130) markers (Supplementary Information, Fig. S5D, S6A, S6B, S6C), and also did not colocalise with EEA1, an early endosomal marker (Fig. 5B). This suggests that the GFP-Atg16L1-positive structures are very early autophagosome precursors that are associated with endocytic vesicles that have recently budded from the plasma membrane. These endocytic vesicles are likely not early endosomes (which are EEA1-positive) but are more analogous to the endocytic vesicle precursors that precede endosomes 27. We observed similar results when we performed the cholera toxin internalisation assay with endogenous Atg16L1 (Fig. 5C), GFP-Atg16L1 stable cells (Supplementary Information, Fig. S7A, S7B), endogenous (Fig. 5D) or overexpressed (Supplementary Information, Fig. S7C) Atg5, or endogenous Atg12 (Fig 5D). We found that vesicles containing 2-275 Atg16L1 (that binds clathrin) co-localised with cholera toxin vesicles, similar to wild-type Atg16L1, while this was not the case for 232-607 Atg16L1 (that cannot bind clathrin) (even though the cholera toxin-EEA1 co-localisation was similar for all three Atg16L1 constructs) (Fig. 6A, Supplementary Information, Fig. S7D). Immuno-EM also showed internalised vesicles close to the plasma membrane labelled with both cholera toxin and GFP-Atg16L1 (Fig. 6B, Supplementary Information, Fig. S7E) supporting the immunofluorescence data. Similar results to the cholera toxin internalisation assay was observed when we used two other plasma membrane markers, the slow internalising dye, CellMask Orange (Fig. 7A) or the fast internalising FM4-64 (Supplementary Information, Fig. S7F), which both showed that vesicles derived from the plasma membrane often fused with GFP-Atg16L1 vesicles near the plasma membrane.
Figure 5. Atg16L1 vesicles co-localise with cholera toxin-subunit B-labelled vesicles.
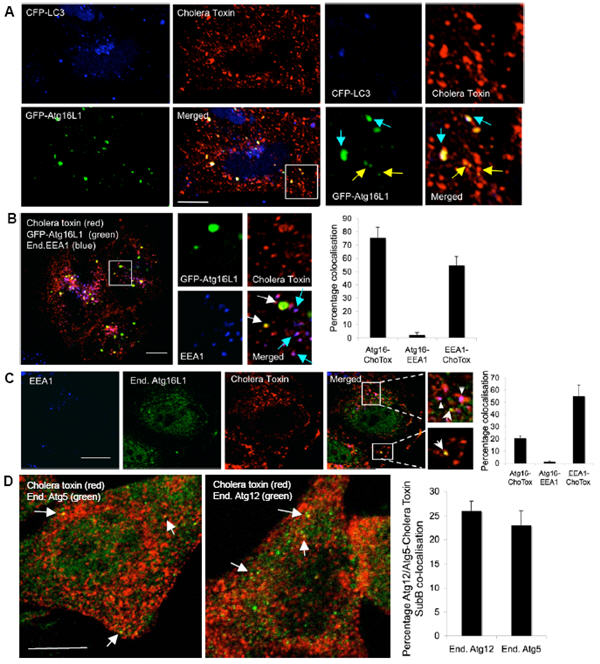
A. HeLa cells transfected for 24 h with GFP-Atg16L1 (green) and CFP-LC3 (blue) were incubated with Alexa fluor-555-conjugated cholera toxin-subunit B (red) for 15 minutes at 4°C (allowing toxin binding to the plasma membrane). Then cells were incubated at 37°C (which allows cholera toxin internalization) for 10 minutes and fixed for confocal analysis. Vesicles positive for Atg16L1 and cholera toxin are yellow (also see high magnification images). Note that the small Atg16L1 vesicles co-localising with cholera toxin are negative for LC3 (as marked with yellow arrows) and the Atg16L1 vesicles co-localising both with cholera toxin and LC3 (marked with blue arrows) are shown in the magnified panels on the right. Scale bar – 10 μm. B. HeLa cells transfected for 24 h with GFP-Atg16L1 (green) were incubated with Alexa fluor-555-conjugated cholera toxin-subunit B (red) as in A after which they were fixed, immunostained for endogenous EEA1 (blue) and analysed by confocal microscopy. Vesicles positive for Atg16L1 and cholera toxin B are yellow (white arrows) and vesicles positive for both EEA1 and cholera toxin are purple (blue arrows) and is shown in the high magnification images. Graph shows percentage co-localisation. n = 20 cells. Scale bar – 10 μm. C. HeLa cells treated with HBSS for 6 h were incubated Alexa fluor-555-labelled cholera toxin-subunit B (red) as in A. Cells were then fixed, and immunostained for endogenous Atg16L1 (green) and endogenous EEA1 (blue). Cells were analysed as in B and graph shows quantitation. Scale bar – 10 μm. Arrows show Atg16L1-cholera toxin co-localisation. Triangles show EEA1-cholera toxin co-localisation. n = 20 cells. D. HeLa cells treated with HBSS for 6 h were incubated with Alexa fluor-555-labelled cholera toxin-subunit B (red) as in A. Cells were then fixed and immunostained for endogenous Atg5 (green) or endogenous Atg12 (green). Co-localisation of the Atg5 (n = 18 cells) or Atg12 vesicles (n = 39 cells) with cholera toxin is shown in yellow (arrows) and quantitated in graph. Scale bar – 10 μm. All error bars in the graphs represent SEM.
Figure 6. Analysis of wild-type and deletion mutants of Atg16L1.
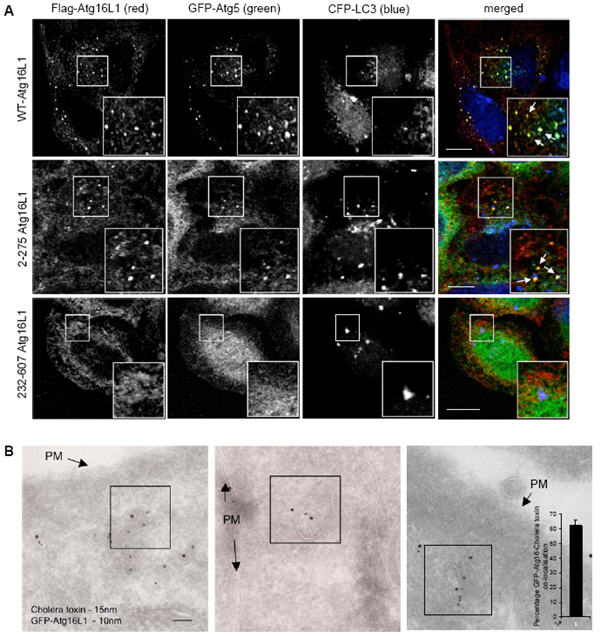
A. HeLa cells transfected for 24 h with Flag-tagged wild-type Atg16L1 or the Atg16L1 deletion mutants - 2-275 or 232-607 Atg16L1 together with GFP-Atg5 and CFP-LC3, were fixed and imunostained with anti-Flag antibody before confocal analysis. Co-localisation of wild-type or 2-275 Atg16L1 (red) with GFP-Atg5 (green) is marked by arrows in the inset. Scale bar – 10 μm. B. HeLa cells transfected for 24 h with GFP-Atg16L1 were incubated with HRP-conjugated cholera toxin-subunit B for 15 minutes at 4°C. The cells were then incubated at 37°C for 10 minutes, after which they were processed for double immuno-gold labelling with anti-HRP (15 nm gold particles) and anti-GFP (10 nm gold particles) antibodies for EM. PM – plasma membrane. Scale bar – 100 nm. Co-localisation can be seen in boxed areas. n = 49 fields. All error bars in the graphs represent SEM.
Figure 7. Plasma membrane contributes to Atg16L1-positive autophagosome precursors.
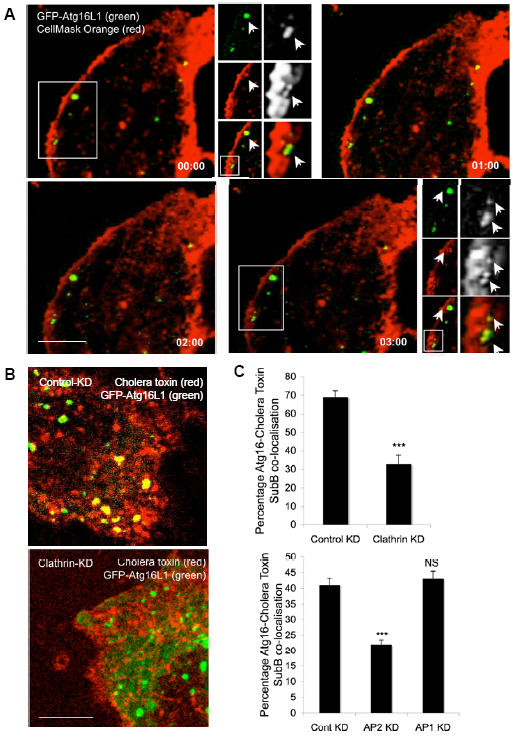
A. HeLa cells transfected for 24 h with GFP-Atg16L1 (green) were incubated with CellMask orange plasma membrane stain for 5 minutes at 37°C, after which they were then imaged immediately (in an incubated chamber at 37°C). A time series following fusion of a CellMask orange vesicle (red) with GFP-Atg16L1 vesicle (green) is shown. Scale bar – 5 μm. A higher magnification image showing co-localisation (yellow) of GFP-Atg16L1 vesicle (green) with CellMask orange-positive vesicle (red), that are marked by arrows is also shown in the top and bottom panels. B, C. HeLa cells transfected with control, clathrin-heavy chain, AP1 or AP2 siRNA for 72 h were subsequently transfected with GFP-Atg16L1 (green) together with the siRNA for the next 24 h. The cells were then incubated with Alexa fluor-555-conjugated cholera toxin-subunit B (red) for 15 minutes at 4°C, followed by further incubation at 37°C for 10 minutes, after which the cells were fixed for confocal analysis. The co-localisation (yellow) of GFP-Atg16L1 (green) with cholera toxin (red) in control or clathrin-heavy chain knockdown is shown, which is quantitated in the graph in C. n = 25 cells. *** - p=0.0002 for clathrin-heavy chain KD and <0.0001 for AP2 KD. All error bars in the graphs represent SEM. Scale bar – 5 μm.
Importantly, clathrin heavy-chain or AP2 knockdown significantly decreased the co-localisation of Atg16L1-positive vesicles with cholera toxin-labelled vesicles (Fig. 7B,C), consistent with our earlier data showing that knockdown of clathrin heavy-chain or AP2 inhibited autophagosome formation. (We tested clathrin-mediated endocytosis in our system by performing transferrin-internalisation assays and found that clathrin-heavy chain and AP2 knockdown conditions we used significantly impaired clathrin-dependent endocytosis (Supplementary Information, Fig. S8A)). The reason why the effects of clathrin heavy-chain or AP2 knockdown may not be even stronger than those we observed, is that non-clathrin-mediated endocytosis routes also contribute to the uptake of cholera toxin, and it is possible that these may also regulate autophagosome formation. Also, it is difficult to obtain strong functional knockdown with these proteins 15.
Here, we have identified for the first time a direct contribution of the plasma membrane to the formation of pre-autophagosomal structures via clathrin-mediated internalisation of vesicles derived from the plasma membrane. Our data suggest that this is mediated via the interaction of Atg16L1 and clathrin heavy chain. Since AP2 also interacted with Atg16L1 (Fig. 1C), we performed immunoprecipitation assays in cells with clathrin-heavy chain or AP2 knockdown. We observed a decrease in the Atg16L1-clathrin interaction with AP2 knockdown (but no change in the Atg16L1-AP2 interaction with clathrin-heavy chain knock down), suggesting that AP2 may mediate the Atg16L1-clathrin interaction (Fig. 8A). This is not surprising, since AP2 links clathrin to the membrane and also mediates its interactions with other key endocytic proteins. It remains to be established exactly how Atg16L1 is specifically targeted to clathrin-coated vesicles. Since AP2 knockdown did not completely abolish the Atg16L1-clathrin interaction, it is possible that other adaptor/accessory proteins might be involved in mediating the Atg16L1-clathrin interaction, identification of which is however beyond the scope of this paper.
Figure 8. Effect of endocytic vesicle scission on phagophore formation.
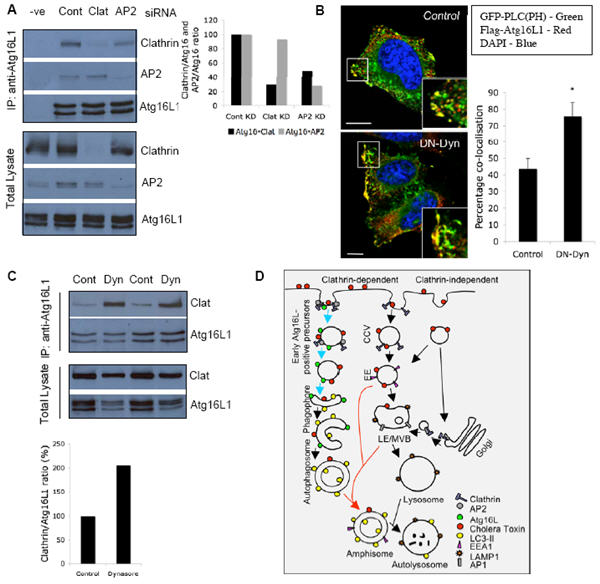
A. Hela cells transfected with two rounds of control, clathrin-heavy chain or AP2 siRNA for 4 d were collected for immunoprecipitation with anti-Atg16L1 antibody (IP). Western blot for total lysate (bottom) and IP (top) were performed using anti-Atg16L1 and anti-clathrin antibodies. Note the decrease in Atg16L1-Clathrin interaction with AP2 knockdown. Graph shows quantitation of the Atg16L1-clathrin or Atg16L1-AP2 with control, clathrin-heavy chain or AP2 knockdown from two independent experiments. B. HeLa cells transfected for 24 h with Flag-tagged wild-type Atg16L1, GFP-PLC(PH) together with empty vector (Control) or dominant-negative dynamin-II mutant (K44A Dynamin; DN-Dyn) were fixed and analysed by confocal microscopy. Note co-localisation of Atg16L1 with PLC(PH) at the plasma membrane which is quantified in the graph. * - p<0.01. Scale bar – 5 μm. n = 20 cells. C. Hela cells treated with HBSS alone or HBSS with 80 μM dynasore for 5 h were collected for immunoprecipitation with anti-Atg16L1 antibody (IP). Western blot analyses for total lysate (TL) and IP were performed using anti-Atg16L1 and anti clathrin antibodies. Note the strong Atg16L1-Clathrin interaction with dynasore treatment. Graph shows quantitation from two independent experiments. All error bars in the graphs represent SEM. D. Representation of plasma membrane contribution to autophagosome precursor formation. Cholera toxin is internalized by clathrin-dependent and clathrin-independent endocytosis. Clathrin knockdown significantly decreases cholera toxin uptake 15, 26. Clathrin-coated vesicles (CCV) budding immediately from the plasma membrane (EEA1-negative) are precursors to early endosomes (EE) 27 (EEA1-positive). Previous studies showed that delivery of fully formed autophagosomes to lysosomes requires fusion of such autophagosomes with early or late endosomes/multi vesicular bodies (LE/MVB) to form amphisomes, which are Atg16L1-negative, LC3-positive and positive for endosomal markers 11, 12 (red arrows). We show here that inhibition of clathrin-dependent internalization inhibits formation of early Atg16L1-positive precursors that mature to form phagophores and later autophagosomes (blue arrows). These Atg16L1-vesicles were positive for other early autophagosomal markers (Atg5 and Atg12), but not early endosomal markers (EEA1). AP2 is a clathrin adaptor at the plasma membrane while AP1 localises to TGN and endosomes.
Effect of endocytic vesicle scission on phagophore formation
In order to further characterise the importance of endocytosis in phagophore formation, we inhibited endocytic vesicle scission with dominant-negative (DN) dynamin-II (K44A dynamin-II) and observed a decrease in the number of Atg16L1 vesicles, similar to clathrin-heavy chain or AP2 KD (Supplementary Information, Fig. S8B). DN-dynamin treatment of cells analysed for cholera toxin-Atg16L1 vesicle co-localisation resulted in the formation of tubular morphologies with the cholera toxin, consistent with previous findings, and Atg16L1 was seen on these structures (Supplementary Information, Fig. S8C). The DN-dynamin II also redistributed Atg16L1 close to the inner surface of the plasma membrane, as judged by significantly enhanced Atg16L1-PtdIns(4,5)P2 colocalisation by confocal microscopy (Fig. 8B, Supplementary Information, Fig. S8D). Phosphatidylinositol 4,5-biphosphate (PtdIns(4,5)P2) is a well-recognised plasma membrane lipid, which is frequently used as a plasma membrane marker 28, and the PH domain of phospholipase Cδ fused to GFP (PLC(PH)-GFP) is routinely used to recognise PtdIns(4,5)P2 in this context 29. Consistent with these observations, dynasore, a cell permeable dynamin inhibitor, caused a marked increase in the Atg16L1-clathrin interaction (Fig. 8C), which correlated with a dramatic accumulation of Atg16L1 in clathrin-coated structures close to the plasma membrane at the EM level (Fig. 4C). Thus, it is likely that Atg16L1 localises to the clathrin-coated endocytic vesicles close to the plasma membrane prior to scission, and our data are compatible with a requirement for vesicle scission for phagophore maturation.
Discussion
The membrane origin(s) of autophagosomes is one of the critical questions in the autophagy field 30. While contributions from multiple membrane sources are widely acknowledged to be a likely possibility, the mechanism by which they give rise to mature autophagosomes is largely unknown. Our data suggest that plasma membrane contributes to early autophagosomal precursor structures, a phenomenon that is dependent on the association of . Atg16L1-positive vesicles with the plasma membrane via Atg16L1-AP2/clathrin heavy chain interactions. Subsequent scission of the Atg16L1/clathrin/AP2-associated structures, leading to the formation of early endosomal-like intermediates is a crucial step that enables the liberation and maturation of these Atg16L1 vesicles into autophagosomes. These autophagosome precursors we see may be membrane structures that precede the phagophores, and these represent an even earlier stage in autophagosome assembly (Fig. 8D). The ability of plasma membrane to contribute to autophagosome formation may be particularly important during periods of increased autophagy, as the large surface area of the plasma membrane may serve as a large membrane reservoir that allows cells periods of autophagosome synthesis at levels many-fold higher than under basal conditions, without compromising other processes.
Material and methods
Mammalian cell culture
HeLa cells were grown in Dulbecco's Modified Eagle Medium (DMEM, Sigma) supplemented with 10% Fetal Bovine Serum (FBS), 100 U/ml Penicillin/Streptomycin, 2mM L-Glutamine and 1mM Sodium Pyruvate at 37°C, 5% Carbon dioxide. HeLa cells stably expressing the GFP-mRFP-LC3 were cultured in DMEM containing 10% FBS, 2mM L-glutamine, 100 U/ml Penicillin/Streptomycin and 500 μg/ml G418 (Sigma) 17. The cells were seeded at 1–2×10⁵ per well in 6-well plates and transfection was performed using LipofectAMINE (for DNA) or LipofectAMINE 2000 (for siRNA and double transfections with DNA and siRNA) reagents (Invitrogen) using the manufacturer's protocol. Pre-designed single siRNA were ordered from Applied Biosystems (siRNA IDs: Clathrin-heavy chain – 107565, s223262, epsin 1 – s26714, AP2-A1 – 16708, AP1 μ1 - 138606).
Immunocytochemistry
Immunocytochemistry was performed in HeLa cells fixed with 4% paraformaldehyde or methanol (for endogenous Atg16L1, endogenous Atg5 and endogenous Atg12 staining). Primary antibodies: anti-HA (Covance), anti-EEA1 (Abcam, Cell Signaling), anti-Atg12 (Cell Signalling), anti-Atg5 (Sigma), anti-Atg16L1 (MBL International, CosmoBio), anti-gm130 (BD biosciences), anti-grp78 (BiP, Abcam) and anti-Flag M2 (Sigma Aldrich). Co-localisation analysis was performed on confocal images using Image J RG2B plugin. 15-20 cells were analysed for each experiment. Automatic counting of LC3 vesicles from HeLa cells stably expressing GFP-mRFP-LC3 was performed using the Thermo Scientific Cellomics ArrayScan VTI HCS Reader and the Spot Detector Bioapplication protocole version 3 17.
Plasmid construction
Full-length human Atg16L1 (NM_030803) without the start codon was previously cloned into a modified pCMV-HA vector (BD Bioscience), i.e. the HA-tag had been replaced by a 3xFlag-tag using ApaI and EcoRI (Rioux et al., 2007). Deletion constructs were generated by PCR cloning from the full-length construct (2-77 (5′-GAC AAG CGA ATT CTT TCG TCG-3′, 5′-TAA TGC GGC CGC TCA CCA TGT TCC ATC-3′), 2-275 (5′-GAC AAG CGA ATT CTT TCG TCG-3′, 5′- TAA TGC GGC CGC TCA AAG GCC TCC AGC -3′), 232-607 (5′-CGA ATT CTT CTA CCA GTC GAA-3′, 5′-TAA TGC GGC CGC TCA GTA CTG T-3′), digested with EcoRI and NotI (both NEB), and finally subcloned into the original vector in frame with the Flag-tag. The T300A mutant was generated by site-directed mutagenesis (Stratagene QuikChange site-directed mutagenesis kit) using the wild-type construct as template and the following primers: 5′-GAC AAT GTG GAT GCT CAT CCT GGT TCT G-3′, 5′-C AGA ACC AGG ATG AGC ATC CAC ATT GTC-3′.
Live cell Imaging
For live-cell imaging, HeLa cells were seeded on 42mm glass cover slips (PeCon, GmbH, Germany) at a density of approximately 1.5×10⁵ cells per cover slip. Cells were transfected with GFP-Atg16L1 for 24h, after which the cover slips were mounted in a POC chamber (PeCon GmbH), rinsed once with ice-cold HBSS and stained with 2.5μg/ml Alexa Fluor-555-tagged cholera toxin subunit B (Molecular Probes) for 15 minutes at 4°C or with 5μg/ml FM4-64 (Molecular Probes) for 1 minute at 4°C, or with 2.5μg/ml CellMask orange (Invitrogen) at 37°C for 10 minutes, after which they were imaged immediately at 37°C. Imaging was performed on a Zeiss Axiovert 200M microscope with a LSM 510 confocal attachment using a x63 1.4 NA Plan Apochromat oil-immersion lens. Laser lines at 488 nm (GFP-Atg16L1) and 543 nm (FM4-64, Alexa Fluor-555 tagged Cholera toxin, subunit-B, CellMask orange) were used. Band pass (505-530nm) and long pass (560nm) filters were used to separate wavelengths. Laser power was kept at a minimum to minimize photobleaching and photocytotoxicity.
TIRF microscopy
HeLa cells were seeded on 35mm MatTek glass-bottom petri dish (USA) at a density of approximately 1.5×10⁵ cells per cover slip. Cells were transfected with mRFP-GPi and GFP-Atg16L1 for 20h following which they were cultured in Hank's balanced salt solution for a further 2h. Imaging was performed on Zeiss TIRF (Total Internal Reflection Fluorescence) 3 system using a αPlan-FLuAR 100x/1.45 Oil under the control of the AxioVision software. Laser lines 488 nm and 561 nm has been used for the GFP-Atg16L1 and mRFP-GPi excitation respectively.
Western Blot Analysis
Western blot analysis was performed using standard techniques with ECL detection kit (GE Healthcare) or using the direct infrared fluorescence detection on the Odyssey Infrared Imaging System. The primary antibodies used include anti-Epsin (Santa Cruz Biotechnology), anti-clathrin (BD Bioscience), anti-Atg16L1 (MBL International Corporation), anti-actin (Sigma Aldrich), anti-tubulin (Sigma Aldrich), anti-Atg5 (Sigma Aldrich), anti-Flag M2 (Sigma Aldrich), anti-AP1-A1 (abcam), anti-AP1-μ1 (Proteintech Europe) and anti-LC3 (Novus Biologicals). Immunoprecipitation experiments were performed using standard protocol. For dynasore experiment cells were treated with 80μM dynasore (Sigma) for 5h before collecting cells for immunoprecipitation.
Immuno-gold electron microscopy
HeLa cells transfected with GFP-Atg16L1 for 24h, were incubated with 2.5μg/ml HRP-cholera toxin subunit B (Molecular Probes) for 15 minutes at 4°C, after which they were incubated at 37°C for 10 minutes. For the dynasore experiment cells were treated with 50μM dynasore (Sigma) for 4h before fixation. The cells were then fixed with a mixture of 2% paraformaldehyde and 0.2% glutaraldehyde in PBS for 2h, at room temperature. Cells were then prepared for ultrathin cryosectioning and immunogold labeled according to protocol previously described 31. Briefly, fixed cells were washed once in PBS/0.02 M glycine, after which cells were scraped in 12% gelatin in PBS and embedded in the same solution. The cell-gelatin was cut into 1mm blocks, infiltrated with 2.3 M sucrose at 4°C, mounted on aluminum pins and frozen in liquid nitrogen. Ultrathin cryosections were picked up in a mixture of 50% sucrose and 50% methyl cellulose and incubated with anti-HRP or anti-clathrin and anti-GFP and revealed with 10nm and 15nm protein A gold (Utrecht).
Transferrin uptake assay
Cells were collected and resuspended in ice-cold serum-free CO2-independent medium (SFM) containing 10 mg/ml BSA and centrifuged at 1,200g for 2 min at 4°C following which they were resuspended in 300μl SFM/BSA containing Alexa-488 transferrin (Molecular Probes) and incubated on ice for 5 minutes for pre-binding. They were then incubated for 5 minutes at 37° to allow internalisation. The cells were chilled on ice, spun, and washed once with 700μl SFM/BSA. The pellet was then resuspended in 300μl acid wash solution (0.1M Gly, 150mM NaCl, pH 3), incubated for 4 minutes on ice, centrifuged, and repeated again. The pellet was then resuspended in chilled PBS/BSA and analysed by FACS.
Statistics
Significance levels for comparisons between groups were determined with T tests, repeated measure or factorial ANOVA using the STATVIEW software, version 4.53 (Abacus Concepts, Berkeley, CA).
Supplementary Material
Acknowledgements
We are grateful to P Luzio, V Korolchuk, F Menzies and S Sarkar, Cambridge Institute for Medical Research, Cambridge for helpful comments, and for funding from a Wellcome Trust Senior Clinical Research Fellowship (DCR), a MRC Programme grant (DCR), Cancer Research UK (CP). We thank M Mizuguchi, Toyama Medical and Pharmaceutical University, Toyama for hLC3B, R Tsien, University of California, San Diego for tdTomato, R Xavier, Massachusetts General Hospital, Boston for 3xFlag-Atg16L1, T Yoshimori, Osaka University, Osaka for CFP-LC3, GFP-Atg5, B Beaumelle, Universite Montpellier 2, France for dominant-negative Dynamin-II, T Meyer, Stanford University Medical Center, Stanford for PLC(PH) and M Harbour, CIMR, Cambridge for help with MALDIToF.
References
- 1.Hailey DW, et al. Mitochondria supply membranes for autophagosome biogenesis during starvation. Cell. 2010;141:656–67. doi: 10.1016/j.cell.2010.04.009. [DOI] [PMC free article] [PubMed] [Google Scholar]
- 2.Axe EL, et al. Autophagosome formation from membrane compartments enriched in phosphatidylinositol 3-phosphate and dynamically connected to the endoplasmic reticulum. J Cell Biol. 2008;182:685–701. doi: 10.1083/jcb.200803137. [DOI] [PMC free article] [PubMed] [Google Scholar]
- 3.Hayashi-Nishino M, et al. A subdomain of the endoplasmic reticulum forms a cradle for autophagosome formation. Nat Cell Biol. 2009 doi: 10.1038/ncb1991. [DOI] [PubMed] [Google Scholar]
- 4.Yla-Anttila P, Vihinen H, Jokitalo E, Eskelinen EL. 3D tomography reveals connections between the phagophore and endoplasmic reticulum. Autophagy. 2009;5 doi: 10.4161/auto.5.8.10274. [DOI] [PubMed] [Google Scholar]
- 5.Ohsumi Y, Mizushima N. Two ubiquitin-like conjugation systems essential for autophagy. Semin Cell Dev Biol. 2004;15:231–6. doi: 10.1016/j.semcdb.2003.12.004. [DOI] [PubMed] [Google Scholar]
- 6.Mizushima N, et al. Mouse Apg16L, a novel WD-repeat protein, targets to the autophagic isolation membrane with the Apg12-Apg5 conjugate. J Cell Sci. 2003;116:1679–88. doi: 10.1242/jcs.00381. [DOI] [PubMed] [Google Scholar]
- 7.Hanada T, et al. The Atg12-Atg5 conjugate has a novel E3-like activity for protein lipidation in autophagy. J Biol Chem. 2007;282:37298–302. doi: 10.1074/jbc.C700195200. [DOI] [PubMed] [Google Scholar]
- 8.Fujita N, et al. The Atg16L complex specifies the site of LC3 lipidation for membrane biogenesis in autophagy. Mol Biol Cell. 2008;19:2092–100. doi: 10.1091/mbc.E07-12-1257. [DOI] [PMC free article] [PubMed] [Google Scholar]
- 9.Rioux JD, et al. Genome-wide association study identifies new susceptibility loci for Crohn disease and implicates autophagy in disease pathogenesis. Nat Genet. 2007;39:596–604. doi: 10.1038/ng2032. [DOI] [PMC free article] [PubMed] [Google Scholar]
- 10.Eskelinen EL. Maturation of autophagic vacuoles in Mammalian cells. Autophagy. 2005;1:1–10. doi: 10.4161/auto.1.1.1270. [DOI] [PubMed] [Google Scholar]
- 11.Ravikumar B, Imarisio S, Sarkar S, O'Kane CJ, Rubinsztein DC. Rab5 modulates aggregation and toxicity of mutant huntingtin through macroautophagy in cell and fly models of Huntington disease. J Cell Sci. 2008;121:1649–60. doi: 10.1242/jcs.025726. [DOI] [PMC free article] [PubMed] [Google Scholar]
- 12.Razi M, Chan EY, Tooze SA. Early endosomes and endosomal coatomer are required for autophagy. J Cell Biol. 2009;185:305–21. doi: 10.1083/jcb.200810098. [DOI] [PMC free article] [PubMed] [Google Scholar]
- 13.Klionsky DJ, et al. Guidelines for the use and interpretation of assays for monitoring autophagy in higher eukaryotes. Autophagy. 2008;4:151–75. doi: 10.4161/auto.5338. [DOI] [PMC free article] [PubMed] [Google Scholar]
- 14.Rubinsztein DC, et al. In search of an “autophagomometer”. Autophagy. 2009;5:585–9. doi: 10.4161/auto.5.5.8823. [DOI] [PubMed] [Google Scholar]
- 15.Doherty GJ, McMahon HT. Mechanisms of endocytosis. Annu Rev Biochem. 2009;78:857–902. doi: 10.1146/annurev.biochem.78.081307.110540. [DOI] [PubMed] [Google Scholar]
- 16.Kimura S, Noda T, Yoshimori T. Dissection of the autophagosome maturation process by a novel reporter protein, tandem fluorescent-tagged LC3. Autophagy. 2007;3:452–60. doi: 10.4161/auto.4451. [DOI] [PubMed] [Google Scholar]
- 17.Sarkar S, Korolchuk V, Renna M, Winslow A, Rubinsztein DC. Methodological considerations for assessing autophagy modulators: a study with calcium phosphate precipitates. Autophagy. 2009;5:307–13. doi: 10.4161/auto.5.3.7664. [DOI] [PubMed] [Google Scholar]
- 18.Sarkar S, Davies JE, Huang Z, Tunnacliffe A, Rubinsztein DC. Trehalose, a novel mTOR-independent autophagy enhancer, accelerates the clearance of mutant huntingtin and alpha-synuclein. J Biol Chem. 2007;282:5641–52. doi: 10.1074/jbc.M609532200. [DOI] [PubMed] [Google Scholar]
- 19.Cooper JK, et al. Truncated N-terminal fragments of huntingtin with expanded glutamine repeats form nuclear and cytoplasmic aggregates in cell culture. Hum Mol Genet. 1998;7:783–90. doi: 10.1093/hmg/7.5.783. [DOI] [PubMed] [Google Scholar]
- 20.Lunkes A, Mandel JL. A cellular model that recapitulates major pathogenic steps of Huntington's disease. Hum Mol Genet. 1998;7:1355–61. doi: 10.1093/hmg/7.9.1355. [DOI] [PubMed] [Google Scholar]
- 21.Wyttenbach A, et al. Effects of heat shock, heat shock protein 40 (HDJ-2), and proteasome inhibition on protein aggregation in cellular models of Huntington's disease. Proc Natl Acad Sci U S A. 2000;97:2898–903. doi: 10.1073/pnas.97.6.2898. [DOI] [PMC free article] [PubMed] [Google Scholar]
- 22.Ravikumar B, Duden R, Rubinsztein DC. Aggregate-prone proteins with polyglutamine and polyalanine expansions are degraded by autophagy. Hum Mol Genet. 2002;11:1107–17. doi: 10.1093/hmg/11.9.1107. [DOI] [PubMed] [Google Scholar]
- 23.Sarkar S, et al. Lithium induces autophagy by inhibiting inositol monophosphatase. J Cell Biol. 2005;170:1101–11. doi: 10.1083/jcb.200504035. [DOI] [PMC free article] [PubMed] [Google Scholar]
- 24.Williams A, et al. Novel targets for Huntington's disease in an mTOR-independent autophagy pathway. Nat Chem Biol. 2008;4:295–305. doi: 10.1038/nchembio.79. [DOI] [PMC free article] [PubMed] [Google Scholar]
- 25.Bastiaens PI, Majoul IV, Verveer PJ, Soling HD, Jovin TM. Imaging the intracellular trafficking and state of the AB5 quaternary structure of cholera toxin. Embo J. 1996;15:4246–53. [PMC free article] [PubMed] [Google Scholar]
- 26.Puri C, et al. Relationships between EGFR signaling-competent and endocytosis-competent membrane microdomains. Mol Biol Cell. 2005;16:2704–18. doi: 10.1091/mbc.E04-07-0596. [DOI] [PMC free article] [PubMed] [Google Scholar]
- 27.Zoncu R, et al. A phosphoinositide switch controls the maturation and signaling properties of APPL endosomes. Cell. 2009;136:1110–21. doi: 10.1016/j.cell.2009.01.032. [DOI] [PMC free article] [PubMed] [Google Scholar]
- 28.Di Paolo G, De Camilli P. Phosphoinositides in cell regulation and membrane dynamics. Nature. 2006;443:651–7. doi: 10.1038/nature05185. [DOI] [PubMed] [Google Scholar]
- 29.Varnai P, Balla T. Visualization of phosphoinositides that bind pleckstrin homology domains: calcium- and agonist-induced dynamic changes and relationship to myo-[3H]inositol-labeled phosphoinositide pools. J Cell Biol. 1998;143:501–10. doi: 10.1083/jcb.143.2.501. [DOI] [PMC free article] [PubMed] [Google Scholar]
- 30.Juhasz G, Neufeld TP. Autophagy: a forty-year search for a missing membrane source. PLoS Biol. 2006;4:e36. doi: 10.1371/journal.pbio.0040036. [DOI] [PMC free article] [PubMed] [Google Scholar]
- 31.Sigismund S, et al. Clathrin-independent endocytosis of ubiquitinated cargos. Proc Natl Acad Sci U S A. 2005;102:2760–5. doi: 10.1073/pnas.0409817102. [DOI] [PMC free article] [PubMed] [Google Scholar]
Associated Data
This section collects any data citations, data availability statements, or supplementary materials included in this article.