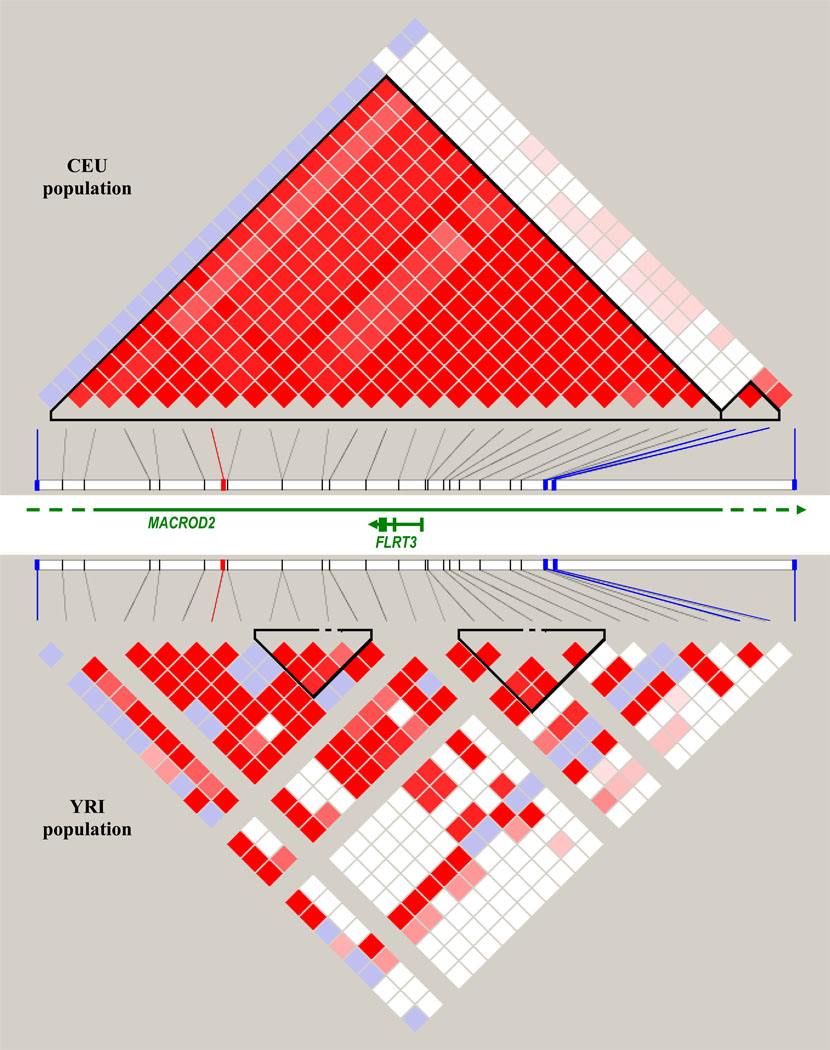
Figure 4.
Linkage disequilibrium (LD) plot of region in MACROD2 including top hit (rs2208454), 22 other SNPs with p<10−5 in meta-analysis, and 4 SNPs with p<0.05 in African-American sample, using HapMap release 22. Plot on top depicts LD in European population (CEU) while plot on bottom depicts LD in African population (YRI). The color scheme is white for D’<1 and LOD<2, blue for D’=1 and LOD<2, shades of pink and red for D’<1 and LOD≥2, and bright red for D’=1 and LOD≥2. The SNP marked in red is rs2208454, the 4 SNPs marked in blue are SNPs with p<0.05 in African-American sample, from left to right: rs7268327, rs1998237, rs4464346, rs8116105. LD could not be measured for 3 SNPs in the YRI population because of a minor allele frequency <0.001 (rs6135125, rs6110247, rs12624446). Green lines represent genes in region.

