

Abstract
Background
Low packing density of glial cells, possibly astrocytes, has been described in the prefrontal cortex and hippocampus of “uncomplicated” alcoholics. Astrocytes perform crucial support functions in the processing of neurotransmitters and transfer of energy substrates from blood to cortical neurons. It is still unknown whether attrition in the numbers of astrocytes is only a consequence of prolonged alcohol abuse or also predates the exposure to alcohol in subjects at risk for alcohol dependence.
Methods
We used alcohol-preferring (P) rats exposed ad libitum for 2 or 6 months to either water only or 10% ethanol and alcohol-nonpreferring (NP) rats and nonselected Wistar rats exposed only to water for 2 months. Sections through the rat frontal cortex were immunostained for glial fibrillary acidic protein (GFAP), a specific marker of astrocytes. The packing density of GFAP-immunoreactive (IR) astrocytes and the area fraction of GFAP immunoreactivity were measured in the prelimbic cortex (PLC) using the dissector probe and analysis of binary images of GFAP immunostaining, respectively.
Results
The packing density of GFAP-IR astrocytes was significantly lower in both alcohol-naive and alcohol-exposed P rats than in NP rats or Wistar rats. The area fraction of GFAP immunoreactivity was significantly lower in the alcohol-exposed P rats than in NP rats, Wistar rats, and alcohol-naive P rats.
Conclusion
These results suggest that low density of GFAP-IR astrocytes in the PLC of P rats predates the exposure to alcohol and might be a factor contributing to the increased risk for alcohol dependence. In addition, prolonged free-choice alcohol drinking may reduce the extent of GFAP-IR processes in the PLC of P rats.
Keywords: Alcoholism, Prefrontal, Glia, Dependence, Immunohistochemical Analysis
In chronic alcohol abusers without major neuropathology or neurological deficits, glial cells in the cerebral cortex are significantly affected (Korbo, 1999; Miguel-Hidalgo and Rajkowska, 2003; Miguel-Hidalgo et al., 2002). However, these alterations differ from the gliosis typical of neurodegenerative diseases. In the hippocampus, the dorsolateral prefrontal cortex (PFC), and the orbitofrontal cortex, alcohol dependence is associated with a reduction in the packing density of glial cells, many probably astrocytes (Korbo, 1999; Miguel-Hidalgo and Rajkowska, 2003; Miguel-Hidalgo et al., 2002). More recently, gene microarray studies have shown that mRNA levels of the astrocytic marker glial fibrillary acidic protein (GFAP) are lower in the brains of alcoholics than in matched controls (Hoffman et al., 2003; Lewohl et al., 2000, 2001; Mayfield et al., 2002). Alterations in the number, the morphology, or the functions of astrocytes are important because they perform functions that provide critical support to neuronal activity: promoting the transfer of nutrient to neurons, maintenance of synaptic transmission by uptake and recycling of neurotransmitters, ionic homeostasis of the neuropil, and the support of cerebral glucose metabolism (Coyle and Schwarcz, 2000; Magistretti and Pellerin, 1999; Magistretti et al., 1999). In brain regions like the PFC, known to be involved in the regulation of behaviors directly relevant to drug and alcohol addiction, alteration in the number of astrocytes, in the extent of their processes, or in those astrocytic functions might be an important factor contributing to alcohol abuse and dependence.
Lower numbers of astrocytes in the hippocampus and PFC of relatively young alcoholics suggest that alcohol abuse may cause astrocyte depletion or that in individuals at risk for alcoholism there might be a pre-existing deficit in the numbers of glial cells. In chronic alcoholic subjects, alcohol-induced reductions in astrocytes or their markers are consistent with the presence in those subjects of degenerating GFAP-immunoreactive (IR) astrocytes detected with terminal deoxynucleotidyltransferase–mediated dUTP nick end labeling (Ikegami et al., 2003). Depletion of GFAP-IR astrocytes may be associated as well with brain injury. For instance, in the hours immediately after traumatic brain injury in the rat, there is a significant decrease in GFAP-IR astrocytes (Zhao et al., 2003).
Alternatively, in regions like the PFC, which heavily influence behaviors of alcohol abuse and dependence (Volkow and Fowler, 2000; Volkow et al., 1992), lower numbers of astrocytes and GFAP levels may precede alcohol abuse and dependence in subjects at risk. In mood disorders (which, like alcoholism, have a significantly heritable component), lower density of glial cells, GFAP-IR astrocytes, and GFAP levels in the PFC of relatively young subjects has been described (Cotter et al., 2002; Miguel-Hidalgo et al., 2000; Öngür et al., 1998; Rajkowska et al., 1999, 2001, 2002; Si et al., 2004).
Several lines of alcohol-preferring (P) rats with an inherited risk for the acquisition of alcohol abuse and dependence have been selected at various laboratories (McBride and Li, 1998; Rodd et al., 2004). In the same laboratories, other researchers also selected lines of alcohol-nonpreferring (NP) rats. These animals drink significantly less ethanol than non-selected or P rats and hardly become alcohol dependent. Among those lines of rats, P and NP rats from Indiana University were obtained by repeated selection for alcohol preference in a stock of Wistar rats (Li et al., 1979; McBride et al., 1986). The levels of several neuronal proteins and other neurochemical characteristics differentiate P rats from NP and Wistar rats (McBride and Li, 1998). It is unknown, however, whether the packing density of glial cells and, in particular, of GFAP-IR astrocytes is lower in the PFC of alcohol-naive P rats than in that of NP rats or Wistar rats (which is not the result of a selection related to alcohol preference) and whether prolonged alcohol exposure affects GFAP-IR astrocytes in P rats.
The present study aimed to determine whether the packing density of GFAP-IR astrocytes and the area fraction of GFAP-IR structures in the prelimbic cortex (PLC) of the rat PFC are lower in alcohol-naive P rats than in alcohol-naive NP and Wistar rats. We also examined whether the same parameters are altered in P rats after prolonged free-choice consumption of 10% ethanol.
Methods
Male inbred P and inbred NP rats between 60 and 70 days of age were obtained from the Alcohol Research Center of Indiana University. These P rats were generated in the Alcohol Research Center of Indiana University by selecting them from a stock of Wistar rats. The P rats were from the 40th and 41st generation and were evenly distributed across the assigned groups in this study. The NP rats were from the 44th generation. Male outbred Wistar rats with comparable ages were purchased from Harlan Sprague Dawley, Inc. (Indianapolis, IN). Experimental rats were divided into six groups. Four groups were dedicated to 2-month treatments: NP rats on water only for 2 months (group 1, n = 6), Wistar rats on water only for 2 months (group 2, n = 6), alcohol-naive P rats on water only for 2 months (group 3, n = 10), and P rats on 10% ethanol for 2 months (group 4, n = 10). Two additional groups of P rats were subjected to 6-month treatments: P rats in group 5 (n = 6) drunk only water and remained alcohol naive for 6 months, while P rats in group 6 (n = 9) had access to 10% ethanol for 6 months. The body weight was matched between groups within 10 g so that there was no significant difference between groups. After 1 week of acclimation, all rats were singly caged. Each rat in groups 4 and 6 had two drinking bottles for 4 days: one of the bottles contained only water and the other contained 10% ethanol diluted in water (v/v). In these two groups, the water-containing bottle was withdrawn and only returned 7 days later. These rats continued with the two bottles until the end of the 2 or 6 months of survival. The position of the bottles was shifted at every change, and the drinking spouts were changed every week. All rats in groups 4 and 6 showed a preference for 10% ethanol. For rats in groups 1, 2, 3, and 5, both bottles contained only water. Liquid intake was measured twice a week. After the 2- or 6-month period, rats were perfused through the heart with 50 ml of phosphate-buffered saline solution and 250 ml of 4% paraformaldehyde. Dissected brains were postfixed overnight and sequentially submerged into 10% and 30% sucrose for 2 days. Sections through the rat PLC were then cut in a vibratome at 30 μm and stored in an antifreeze solution at −20°C. Three coronal sections per brain through the PFC containing the PLC and separated by approximately 1 mm [corresponding approximately to levels 6, 8, and 10 of the atlas of Paxinos and Watson (1998)] were immunostained with a monoclonal antibody to GFAP (Chemicon, Temecula, CA). To minimize intergroup variability due to experimental conditions, in each immunostaining experiment equal numbers of samples from each of the four 2-month treatment groups were simultaneously processed using aliquots of the same washing, antibody, and chromogenic reaction solutions. The sections from the animals with 6 months of treatment were also processed simultaneously although at a different time from the 2-month survival experiments. In the immunostained PFC sections, the PLC was delineated aided by an adjacent section stained with cresyl violet. To recognize the PLC, cytoarchitectonic criteria described by Uylings et al. (Uylings et al., 2003; Uylings and Van Eden, 1990; Van Eden and Uylings, 1985a,b) for the rat brain were used.
Packing Density
In the sampled sections, a trapezoidal outline was centered on the PLC encompassing all cortical layers, with the parallel sides of the trapezoid perpendicular to the medial brain surface and the remaining two sides extending along the brain surface and the border between cortical layer VI and the white matter. The width of the trapezoid (distance between its parallel sides) was 1 mm. With the help of the Stereo Investigator Software (Microbrightfield, Inc., Williston, VT), we determined the packing density of GFAP astrocytes in each of the three sections per brain using the optical dissector probe. Systematic sampling was performed in the corners of a grid of constant dimensions (200 × 200 μm) and randomly oriented (for each section) against the trapezoid of PLC. After immunohistochemical analysis and placement of the coverslip, section thickness shrunk to approximately 13 μm. Accordingly, at each corner of the grid, a counting frame was defined with dimensions of 120 × 100 × 10 μm with a guard zone from the surface of the section of 1 μm. The grid typically included 25 to 28 sampling sites (counting frames) per section within the PLC. The technician counting cells worked with coded slides and was blind to both the group and the actual animal identification. To obtain an estimate of the packing density of GFAP-IR astrocytes in each of the three sections per brain, the total number of counted GFAP-IR astrocytes was divided into the total volume of the counting frames sampled. Values of packing density in the three sections were averaged, and the averages were taken as values of the packing density variable used for statistical comparisons.
Area Fraction
A trapezoid with the above-mentioned dimensions was centered in the area sampled for cell counting. Measurements were made blind to the animal identification. An image was obtained with the video camera and digitized into gray level images. GFAP-positive structures were segmented using the image analysis software ImageJ (version 1.30v; Research Services Branch (NIH), Bethesda, MD) by defining first a background level in an area of the section with no specific immunoreactivity. This background was determined by examining within the image of the section the distribution (available within the ImageJ software) of pixels by optical density. This distribution has a tail that flattens at the lowest value of optical density (within the tissue). This value was considered the background. The threshold for defining a pixel as “immunoreactive” was set at 20 gray values of optical density over the background (gray levels possible were from 0 to 255, white to black). Thus, a binary image of the area occupied by immunoreactivity was obtained that included all pixels with optical densities higher than 20 gray levels over the background. The area fraction of GFAP immunoreactivity was calculated by dividing the binarized IR area by the area occupied by the outlined trapezoid and expressed as a percentage. For all images and measurements, the microscope illumination was set to a fixed intensity, and the computer-controlled settings of the video camera attached to the microscope were also kept constant.
Volume of the Frontal Lobe
In the rats from the four groups (1 to 4) with 2-month treatments, the outline of the left frontal lobe was drawn in Nissl-stained coronal sections 360 μm apart (8-10 sections per brain) from the rostral tip of the PFC to the beginning of the corpus callosum, and the area within each outline was measured using the area measurement capabilities of the Stereo Investigator Software (Microbrightfield, Inc.). In each brain, the sum of all areas from a brain was multiplied by the distance in between measured sections (360 μm) to obtain an estimate of the volume of the frontal lobe.
Statistics
For groups (1 to 4) with a 2-month treatment, differences in the packing density of astrocytes, the area fraction of GFAP immunoreactivity, and the volume of the frontal cortex were analyzed using analysis of variance. When analysis of variance showed a significant effect of the group on any of the dependent variables, the Tukey-Kramer test was used for post hoc multiple comparisons. For comparisons of the two groups (5 and 6) with 6-month treatments, the one-tailed Student's t test was applied. In the “Results” section and in the graphs (Figs. 1-4), data are presented as mean ± SEM.
Fig. 1.
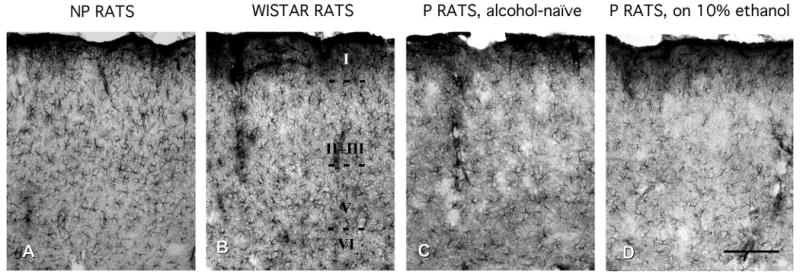
Micrographs illustrating the pattern of GFAP immunoreactivity in the PLC of NP rats (A), Wistar rats (B), alcohol-naive P rats (C), and P rats exposed to 10% ethanol for 2 months (D) show visible lower packing density of GFAP-IR astrocytes in P rats than in NP rats and Wistar rats. (B) Roman numerals (I, II, III, V, and VI) correspond to the cortical layers. (D) Calibration bar is valid for the four panels, 200 μm.
Fig. 4.

Bar graphs showing the mean values of packing density (A) and area fraction (B) of GFAP-IR astrocytes in the PLC of alcohol-naive P rats (n = 6) and P rats exposed to 10% ethanol (n = 9) for 6 months. Whiskers on the bars are SEs. *p < 0.03.
Results
In the PLC of the Wistar rat, astrocytes containing GFAP immunoreactivity are located in all cortical layers (Fig. 1). However, their packing density and the abundance of IR processes vary across cortical layers. In layer I, there is a dense mesh of GFAP-IR processes that reaches maximum density immediately underneath the pia matter. In layers II and III of the PLC, the density of astrocytes and their processes is lower than in layer I, although it is still higher than in the same layers of more lateral areas of cortex at comparable rostrocaudal levels. In layers V and VI, GFAP immunoreactivity is slightly higher than in layers II and III.
Despite a similar distribution of GFAP astrocytes in the PLC, we found that the average packing density of individual GFAP-IR astrocytes in three PLC sections per brain was significantly different among the four groups (1 to 4) with 2-month treatments [F(3,28) = 14.17, p < 0.0001] (Fig. 2A). The packing density of GFAP-IR astrocytes in alcohol-naive P rats (18.30 ± 1.74 × 10³ cells/mm3) was significantly lower by 30% (Tukey q = 4.91, p < 0.01) as compared with NP rats (26.07 ± 0.65 × 10³ cells/mm3) and by 40% (Tukey q = 7.79, p < 0.001) as compared with Wistar rats (30.60 ± 1.28 × 10³ cells/mm3). In P rats exposed to 10% ethanol, the packing density (18.66 ± 1.43 × 10³ cells/mm3) was also significantly lower by 28% as compared with NP rats (Tukey q = 4.72, p < 0.05) and by 39% as compared with Wistar rats (Tukey q = 7.61, p < 0.001). However, there was no significant difference between both groups of P rats or between NP and Wistar rats (Fig. 2A).
Fig. 2.
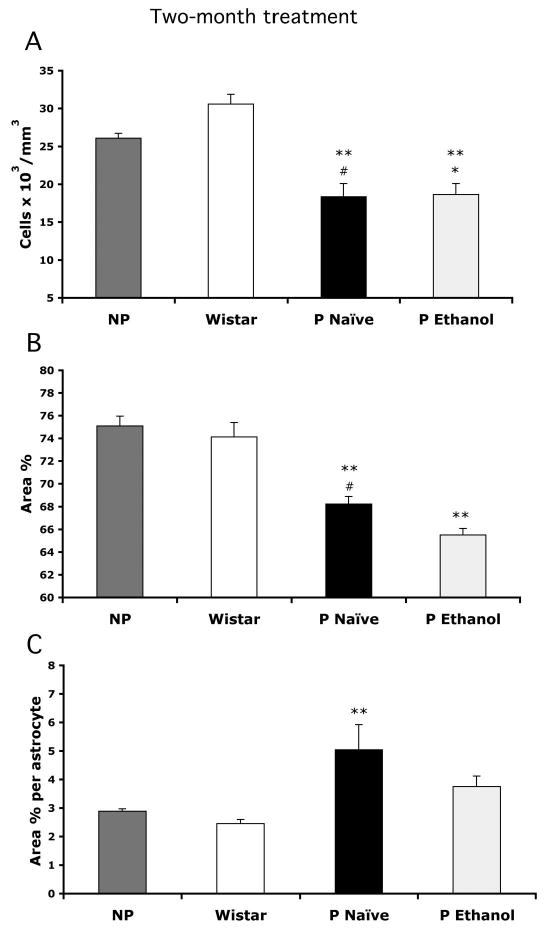
Bar graphs showing the mean values of packing density (A), area fraction (B), and area fraction per astrocyte (C) of GFAP-IR astrocytes in the PLC of NP rats (n = 6), Wistar rats (n = 6), alcohol-naive P rats (n = 10), and P rats exposed to 10% ethanol (n = 10) for 2 months. Whiskers on the bars represent SEs. (A) #p < 0.01 vs. NP rats; **p < 0.001 vs. Wistar rats; *p < 0.05 vs. NP rats. (B) **p < 0.001 vs. Wistar rats and NP rats; #p < 0.05 vs. P rats exposed to 10% ethanol. (C) **p < 0.05 vs. Wistar rats.
Because it is possible that the lower density of astrocytes in P rats was due to a larger brain volume without changes in the total number of GFAP-IR astrocytes, we estimated the volume of the frontal lobe between its rostral most tip and the beginning of the corpus callosum in rats from groups 1, 2, 3, and 4. There was not significant difference in the volume of the frontal lobe as defined above [group 1: 65.17 ± 4.11 mm3; group 2: 69.05 ± 3.31 mm3; group 3: 68.73 ± 3.37 mm3; group 4: 66.60 ± 2.40; F(3,28) = 0.276, p = 0.843] (Fig. 3).
Fig. 3.
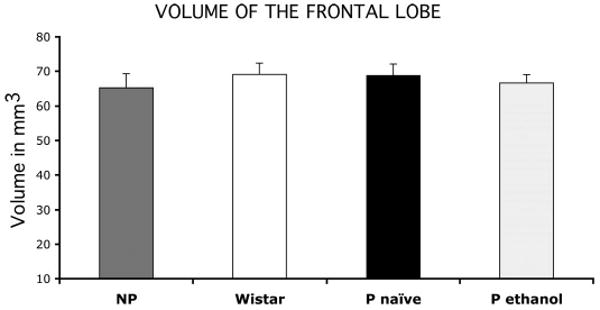
Bar graphs representing the volume of the rat frontal lobe from its rostral tip to the beginning of the corpus callosum in NP rats, Wistar rats, alcohol-naive P rats, and P rats exposed to 10% ethanol for 2 months. Whiskers on the bars represent SEs.
The packing density of the IR cell bodies of GFAP-IR astrocytes does not necessarily reflect the extent of their IR processes. In addition, the levels of GFAP in astrocytic processes may also be affected by ethanol exposure. Consequently, although the packing density of GFAP-IR astrocytes may not change, the area fraction of GFAP-IR structures may vary between groups. Accordingly, using the same sections in which determinations of packing density were performed, we estimated the area fraction of GFAP-IR structures in the rat PLC of the four experimental groups with a 2-month treatment. This area fraction represents the fraction of the bidimensional projection of GFAP immunoreactivity onto the microscope field of view and is a reflection of the spatial extent of IR structures. This fraction was significantly different among the four groups with 2-month treatments [F(3,28) = 33.23, p < 0.0001] (Fig. 2B), and post hoc Tukey-Kramer tests showed that the area fraction in the alcohol-exposed P rats (65.49 ± 0.58%) was significantly smaller than in NP rats (75.11 ± 0.84%, Tukey q = 11.85, p < 0.001), Wistar rats (74.14 ± 1.26%, q = 10.66, Tukey p < 0.001), or alcohol-naive P rats (68.23 ± 0.66%, Tukey q = 2.74, p < 0.05). When the area fraction of immunoreactivity was expressed per counted astrocyte, there was a significant difference between groups [F(3,28) = 3.58, p < 0.03] (Fig. 2C). This area was significantly higher (Tukey q = 4.16, p < 0.05) in the group of alcohol-naive P rats (5.05 ± 0.87%) than in control Wistar rats (2.45 ± 0.14%) and also higher than in the other groups, although the differences from alcohol-exposed P rats (3.76 ± 0.37%) or NP rats (2.89 ± 0.08%) were not statistically significant.
To further determine whether in P rats ethanol drinking for significantly longer than 2 months may also produce a reduction in the packing density of GFAP-IR astrocytes or in the area fraction of GFAP immunoreactivity, a group of P rats (group 6) was exposed to 10% ethanol for 6 months while another group (group 5) remained alcohol naive for the same period. At the end of the treatment, the packing density of GFAP-IR astrocytes in the PLC was not significantly different between these groups (one-tailed t test, Welch correction, t5 = 1.29, p = 0.13) (Fig. 4A). It must be noted, however, that the comparatively highest values of density were in the alcohol-naive P rats. In addition, there was a high variability in the values of density of GFAP-IR astrocytes in the group of alcohol-naive P rats as compared with the alcohol-exposed P rats. In contrast, the area fraction of GFAP immunoreactivity was significantly smaller in P rats exposed to alcohol than in alcohol-naive P rats (t 13 = 3.68, p < 0.003) (Fig. 4B).
Discussion
The present results show that there is a significantly lower packing density of GFAP-IR astrocytes in the PLC of P rats than in that of NP rats and Wistar rats. This difference is independent of free-choice alcohol intake because it was observed in both alcohol-naive and alcohol-exposed P rats. These results raise the possibility that lower numbers of glial cells, possibly astrocytes, in the PFC and hippocampus of alcohol-dependent humans might predate the onset of alcoholism, at least among subjects with inherited risk. It is also possible that in P rats there is a pre-existing deficit of GFAP expression per astrocyte contributing to lower counts of GFAP-IR astrocytes. This possibility, however, is not consistent with the average area fraction of GFAP immunoreactivity per counted astrocyte being the highest in alcohol-naive P rats and significantly higher in these rats than in Wistar rats. In addition, a causative role of ethanol intake in inhibiting expression of GFAP immunoreactivity or in reducing the extent of astrocytic processes is possible because only alcohol-exposed P rats showed a reduction in the area fraction of GFAP immunoreactivity as compared with Wistar rats, NP rats, or alcohol-naive P rats after 2 months of treatment or as compared with alcohol-naive P rats after 6 months. The area fraction of GFAP immunoreactivity naturally depends on the extent of GFAP-IR astrocytic processes. The extent of GFAP-IR astrocytic processes undergoes plastic changes as a consequence of injury or other alterations of the astrocytic environment (Bowers and Kalivas, 2003; Jones et al., 1996; Muller, 1990; Tagliaferro et al., 1997), and because alcohol affects astroglial morphology and metabolism, there is the possibility that alcohol consumption alters GFAP-IR processes without altering the number of astrocytes.
Lower density of GFAP-IR astrocytes in the PLC of P rats than in NP or Wistar rats suggests an association between lower numbers of prefrontal glial cells and the risk for alcohol dependence and abuse. This association does not necessarily imply that a deficit in astrocytes is one of the primary causes for the establishment of alcohol dependence. The deficit may be a downstream effect of anomalies in neuronal connections or neuronal metabolism, even if astrocyte pathology may still contribute to further aggravating alcohol abuse. For instance, altered metabolism or activity of neurons in the medial PFC and other areas with relevance to addiction might induce a response by astrocytes in the PLC that diminishes GFAP immunoreactivity or limits the numbers of astrocytes expressing GFAP. In fact, in some experimental paradigms, increased neuronal activity is associated with a decrease in GFAP expression, and decreased neuronal activity appears to increase the expression of GFAP (Canady et al., 1990, 1994). Activity raising levels of K+ without reaching seizure levels might down-regulate the expression of GFAP in astrocytes, rendering them less conspicuous in immunohistochemical staining (Canady et al., 1990). This possibility is consistent with the finding that alcohol-naive P rats have significantly higher local cerebral glucose utilization rates that NP rats or outbred Wistar rats (Smith et al., 2001). Some researchers suggest that higher local cerebral glucose utilization in alcohol-naive P rats is a reflection of hyperexcitability, and the attempt to bring excitability to normal levels may contribute to addiction to alcohol (Begleiter and Porjesz, 1999; Smith et al., 2001). Nevertheless, increased excitation in cortical neurons is also compatible with a primary deficit in astrocytic function or in the number of astrocytes because astrocytes are essential for the clearance of excitatory neurotransmitters. Alcohol intake may counteract the hyper-excitatory effects of reduced astroglial glutamate uptake by inhibiting NMDA receptors and possibly increasing the uptake of glutamate by astrocytes (Smith, 1997; Smith and Zsigo, 1996).
If an increased excitatory level in the PFC of P rats is causally related to a decreased number of GFAP-IR astrocytes, the mechanism involved must differ from that in seizures or pathologic hyperexcitation, where the consequences of excess extracellular glutamate are neuronal damage and increased GFAP immunostaining and size of GFAP-IR processes. Pathologically high increases of activity would rather induce tissue damage and trigger gliosis with increased GFAP-IR astrocytes (Steward et al., 1991, 1992). The present results show that although the density of astrocytes in the alcohol-naive P rats was significantly lower than that in Wistar rats and NP rats, there was a significantly higher area per astrocyte in alcohol-naive P rats than in Wistar rats. This suggests that scarce astrocytes might be compensating by extending longer processes or increasing GFAP transport to those processes. Either of these changes would have affected the measurements of area fraction obtained in the present study. More experiments are necessary to clarify this point.
The differences in GFAP-IR astrocytes between P rats and NP and Wistar rats might be related to differential behavioral and neurophysiological responses to the same or similar environments. In fact, the environment in which rats are raised significantly influences the morphology of astrocytes of the visual cortex (Jones and Greenough, 1996; Sirevaag et al., 1991; Sirevaag and Greenough, 1987). In general, enriched environments tend to increase the surface area of GFAP-IR astrocytic processes and the packing density of GFAP-positive astrocytes (Sirevaag and Greenough, 1991). By the same token, if rats from different lines and with constitutively different neurophysiological and behavioral features are confronted with the same or very similar environments (all rats in the reported experiments were equally housed and raised except for the ethanol offered to some of the rats), there is the possibility that the differential neurobehavioral and neurophysiological features result in different responses from PFC astrocytes. This explanation is consistent with individualized responses by different subjects when confronted with similar environments.
In summary, a deficit in GFAP-IR astrocytes in the rat PLC might be related to the alcohol-preferring behavior of P rats as compared with NP rats or Wistar rats. Regardless of the deficit being primary or rather secondary to alterations in neuronal physiology and connections, more research is necessary to establish how pre-existing astrocytic alterations may influence ensuing chronic alcohol abuse and dependence.
Acknowledgments
The author thanks Bouchra Koussih and Valerie Wanzo for their excellent technical assistance.
Supported by Grant RR17701 from the National Center of Research Resources.
References
- Begleiter H, Porjesz B. What is inherited in the predisposition toward alcoholism? A proposed model. Alcohol Clin Exp Res. 1999;23:1125–1135. doi: 10.1111/j.1530-0277.1999.tb04269.x. [DOI] [PubMed] [Google Scholar]
- Bowers MS, Kalivas PW. Forebrain astroglial plasticity is induced following withdrawal from repeated cocaine administration. Eur J Neurosci. 2003;17:1273–1278. doi: 10.1046/j.1460-9568.2003.02537.x. [DOI] [PubMed] [Google Scholar]
- Canady KS, Ali-Osman F, Rubel EW. Extracellular potassium influences DNA and protein syntheses and glial fibrillary acidic protein expression in cultured glial cells. Glia. 1990;3:368–374. doi: 10.1002/glia.440030508. [DOI] [PubMed] [Google Scholar]
- Canady KS, Hyson RL, Rubel EW. The astrocytic response to afferent activity blockade in chick nucleus magnocellularis is independent of synaptic activation, age, and neuronal survival. J Neurosci. 1994;14:5973–5985. doi: 10.1523/JNEUROSCI.14-10-05973.1994. [DOI] [PMC free article] [PubMed] [Google Scholar]
- Cotter D, Mackay D, Chana G, Beasley C, Landau S, Everall IP. Reduced neuronal size and glial cell density in area 9 of the dorsolateral prefrontal cortex in subjects with major depressive disorder. Cereb Cortex. 2002;12:386–394. doi: 10.1093/cercor/12.4.386. [DOI] [PubMed] [Google Scholar]
- Coyle JT, Schwarcz R. Mind glue: Implications of glial cell biology for psychiatry. Arch Gen Psychiatry. 2000;57:90–93. doi: 10.1001/archpsyc.57.1.90. [DOI] [PubMed] [Google Scholar]
- Hoffman PL, Miles M, Edenberg HJ, Sommer W, Tabakoff B, Wehner-And JM, Lewohl J. Gene expression in brain: A window on ethanol dependence, neuroadaptation, and preference. Alcohol Clin Exp Res. 2003;27:155–168. doi: 10.1097/01.ALC.0000060101.89334.11. [DOI] [PubMed] [Google Scholar]
- Ikegami Y, Goodenough S, Inoue Y, Dodd PR, Wilce PA, Matsumoto I. Increased TUNEL positive cells in human alcoholic brains. Neurosci Lett. 2003;349:201–205. doi: 10.1016/s0304-3940(03)00826-7. [DOI] [PubMed] [Google Scholar]
- Jones TA, Greenough WT. Ultrastructural evidence for increased contact between astrocytes and synapses in rats reared in a complex environment. Neurobiol Learn Mem. 1996;65:48–56. doi: 10.1006/nlme.1996.0005. [DOI] [PubMed] [Google Scholar]
- Jones TA, Hawrylak N, Greenough WT. Rapid laminar-dependent changes in GFAP immunoreactive astrocytes in the visual cortex of rats reared in a complex environment. Psychoneuroendocrinology. 1996;21:189–201. doi: 10.1016/0306-4530(95)00041-0. [DOI] [PubMed] [Google Scholar]
- Korbo L. Glial cell loss in the hippocampus of alcoholics. Alcohol Clin Exp Res. 1999;23:164–168. [PubMed] [Google Scholar]
- Lewohl JM, Dodd PR, Mayfield RD, Harris RA. Application of DNA microarrays to study human alcoholism. J Biomed Sci. 2001;8:28–36. doi: 10.1007/BF02255968. [DOI] [PubMed] [Google Scholar]
- Lewohl JM, Wang L, Miles MF, Zhang L, Dodd PR, Harris RA. Gene expression in human alcoholism: Microarray analysis of frontal cortex. Alcohol Clin Exp Res. 2000;24:1873–1882. [PubMed] [Google Scholar]
- Li TK, Lumeng L, McBride WJ, Waller MB. Progress toward a voluntary oral consumption model of alcoholism. Drug Alcohol Depend. 1979;4:45–60. doi: 10.1016/0376-8716(79)90040-1. [DOI] [PubMed] [Google Scholar]
- Magistretti PJ, Pellerin L. Cellular mechanisms of brain energy metabolism and their relevance to functional brain imaging. Philos Trans R Soc Lond B Biol Sci. 1999;354:1155–1163. doi: 10.1098/rstb.1999.0471. [DOI] [PMC free article] [PubMed] [Google Scholar]
- Magistretti PJ, Pellerin L, Rothman DL, Shulman RG. Energy on demand. Science. 1999;283:496–497. doi: 10.1126/science.283.5401.496. [DOI] [PubMed] [Google Scholar]
- Mayfield RD, Lewohl JM, Dodd PR, Herlihy A, Liu J, Harris RA. Patterns of gene expression are altered in the frontal and motor cortices of human alcoholics. J Neurochem. 2002;81:802–813. doi: 10.1046/j.1471-4159.2002.00860.x. [DOI] [PubMed] [Google Scholar]
- McBride WJ, Li TK. Animal models of alcoholism: Neurobiology of high alcohol-drinking behavior in rodents. Crit Rev Neurobiol. 1998;12:339–369. doi: 10.1615/critrevneurobiol.v12.i4.40. [DOI] [PubMed] [Google Scholar]
- McBride WJ, Murphy JM, Lumeng L, Li TK. Effects of ethanol on monoamine and amino acid release from cerebral cortical slices of the alcohol-preferring P line of rats. Alcohol Clin Exp Res. 1986;10:205–208. doi: 10.1111/j.1530-0277.1986.tb05072.x. [DOI] [PubMed] [Google Scholar]
- Miguel-Hidalgo JJ, Baucom C, Dilley G, Overholser JC, Meltzer HY, Stockmeier CA, Rajkowska G. GFAP-immunoreactivity in the prefrontal cortex distinguishes younger from older adults in major depressive disorder. Biol Psychiatry. 2000;48:860–872. doi: 10.1016/s0006-3223(00)00999-9. [DOI] [PubMed] [Google Scholar]
- Miguel-Hidalgo JJ, Rajkowska G. Comparison of prefrontal cell pathology between depression and alcohol dependence. J Psychiatr Res. 2003;37:411–420. doi: 10.1016/s0022-3956(03)00049-9. [DOI] [PMC free article] [PubMed] [Google Scholar]
- Miguel-Hidalgo JJ, Wei J, Andrew M, Overholser JC, Jurjus G, Stockmeier CA, Rajkowska G. Glia pathology in the prefrontal cortex in alcohol dependence with and without depressive symptoms. Biol Psychiatry. 2002;52:1121–1133. doi: 10.1016/s0006-3223(02)01439-7. [DOI] [PMC free article] [PubMed] [Google Scholar]
- Muller CM. Dark-rearing retards the maturation of astrocytes in restricted layers of cat visual cortex. Glia. 1990;3:487–494. doi: 10.1002/glia.440030607. [DOI] [PubMed] [Google Scholar]
- Öngür D, Drevets WC, Price JL. Glial reduction in the subgenual prefrontal cortex in mood disorders. Proc Natl Acad Sci USA. 1998;95:13290–13295. doi: 10.1073/pnas.95.22.13290. [DOI] [PMC free article] [PubMed] [Google Scholar]
- Paxinos G, Watson C. The Rat Brain in Stereotaxic Coordinates. 4th. Academic Press; San Diego: 1998. [Google Scholar]
- Rajkowska G, Halaris A, Selemon L. Reductions in neuronal and glial density characterize the dorsolateral prefrontal cortex in bipolar disorder. Biol Psychiatry. 2001;49:741–752. doi: 10.1016/s0006-3223(01)01080-0. [DOI] [PubMed] [Google Scholar]
- Rajkowska G, Miguel-Hidalgo JJ, Makkos Z, Meltzer H, Overholser J, Stockmeier C. Layer-specific reductions in GFAP-reactive astroglia in the dorsolateral prefrontal cortex in schizophrenia. Schizophr Res. 2002;57:127–138. doi: 10.1016/s0920-9964(02)00339-0. [DOI] [PubMed] [Google Scholar]
- Rajkowska G, Miguel-Hidalgo JJ, Wei J, Dilley G, Pittman SD, Meltzer HY, Overholser JC, Roth BL, Stockmeier CA. Morphometric evidence for neuronal and glial prefrontal cell pathology in major depression. Biol Psychiatry. 1999;45:1085–1098. doi: 10.1016/s0006-3223(99)00041-4. [DOI] [PubMed] [Google Scholar]
- Rodd ZA, Bell RL, Sable HJ, Murphy JM, McBride WJ. Recent advances in animal models of alcohol craving and relapse. Pharmacol Biochem Behav. 2004;79:439–450. doi: 10.1016/j.pbb.2004.08.018. [DOI] [PubMed] [Google Scholar]
- Si X, Miguel-Hidalgo JJ, O'Dwyer G, Stockmeier CA, Rajkowska G. Age-dependent reductions in the level of glial fibrillary acidic protein in the prefrontal cortex in major depression. Neuropsychopharmacology. 2004;29:2088–2096. doi: 10.1038/sj.npp.1300525. [DOI] [PMC free article] [PubMed] [Google Scholar]
- Sirevaag AM, Black JE, Greenough WT. Astrocyte hypertrophy in the dentate gyrus of young male rats reflects variation of individual stress rather than group environmental complexity manipulations. Exp Neurol. 1991;111:74–79. doi: 10.1016/0014-4886(91)90052-e. [DOI] [PubMed] [Google Scholar]
- Sirevaag AM, Greenough WT. Differential rearing effects on rat visual cortex synapses. III. Neuronal and glial nuclei, boutons, dendrites, and capillaries. Brain Res. 1987;424:320–332. doi: 10.1016/0006-8993(87)91477-6. [DOI] [PubMed] [Google Scholar]
- Sirevaag AM, Greenough WT. Plasticity of GFAP-immunoreactive astrocyte size and number in visual cortex of rats reared in complex environments. Brain Res. 1991;540:273–278. doi: 10.1016/0006-8993(91)90517-y. [DOI] [PubMed] [Google Scholar]
- Smith DG, Learn JE, McBride WJ, Lumeng L, Li TK, Murphy JM. Alcohol-naive alcohol-preferring (P) rats exhibit higher local cerebral glucose utilization than alcohol-nonpreferring (NP) and Wistar rats. Alcohol Clin Exp Res. 2001;25:1309–1316. [PubMed] [Google Scholar]
- Smith TL. Regulation of glutamate uptake in astrocytes continuously exposed to ethanol. Life Sci. 1997;61:2499–2505. doi: 10.1016/s0024-3205(97)00985-5. [DOI] [PubMed] [Google Scholar]
- Smith TL, Zsigo A. Increased Na(+)-dependent high affinity uptake of glutamate in astrocytes chronically exposed to ethanol. Neurosci Lett. 1996;218:142–144. doi: 10.1016/s0304-3940(96)13123-2. [DOI] [PubMed] [Google Scholar]
- Steward O, Torre ER, Tomasulo R, Lothman E. Neuronal activity up-regulates astroglial gene expression. Proc Natl Acad Sci USA. 1991;88:6819–6823. doi: 10.1073/pnas.88.15.6819. [DOI] [PMC free article] [PubMed] [Google Scholar]
- Steward O, Torre ER, Tomasulo R, Lothman E. Seizures and the regulation of astroglial gene expression. Epilepsy Res Suppl. 1992;7:197–209. [PubMed] [Google Scholar]
- Tagliaferro P, Ramos AJ, López EM, Pecci Saavedra J, Brusco A. Neural and astroglial effects of a chronic parachlorophenylalanine-induced serotonin synthesis inhibition. Mol Chem Neuropathol. 1997;32:195–211. doi: 10.1007/BF02815176. [DOI] [PubMed] [Google Scholar]
- Uylings HB, Groenewegen HJ, Kolb B. Do rats have a prefrontal cortex? Behav Brain Res. 2003;146:3–17. doi: 10.1016/j.bbr.2003.09.028. [DOI] [PubMed] [Google Scholar]
- Uylings HBM, Van Eden CG. Qualitative and quantitative comparison of the prefrontal cortex in rat and in primates, including humans. Prog Brain Res. 1990;85:31–62. doi: 10.1016/s0079-6123(08)62675-8. [DOI] [PubMed] [Google Scholar]
- Van Eden CG, Uylings HB. Cytoarchitectonic development of the prefrontal cortex in the rat. J Comp Neurol. 1985a;241:253–267. doi: 10.1002/cne.902410302. [DOI] [PubMed] [Google Scholar]
- Van Eden CG, Uylings HB. Postnatal volumetric development of the prefrontal cortex in the rat. J Comp Neurol. 1985b;241:268–274. doi: 10.1002/cne.902410303. [DOI] [PubMed] [Google Scholar]
- Volkow ND, Fowler JS. Addiction, a disease of compulsion and drive: Involvement of the orbitofrontal cortex. Cereb Cortex. 2000;10:318–325. doi: 10.1093/cercor/10.3.318. [DOI] [PubMed] [Google Scholar]
- Volkow ND, Hitzemann R, Wang GJ, Fowler JS, Burr G, Pascani K, Dewey SL, Wolf AP. Decreased brain metabolism in neurologically intact healthy alcoholics. Am J Psychiatry. 1992;149:1016–1022. doi: 10.1176/ajp.149.8.1016. [DOI] [PubMed] [Google Scholar]
- Zhao X, Ahram A, Berman RF, Muizelaar JP, Lyeth BG. Early loss of astrocytes after experimental traumatic brain injury. Glia. 2003;44:140–152. doi: 10.1002/glia.10283. [DOI] [PubMed] [Google Scholar]