Abstract
Eye-specific projections to the dorsal lateral geniculate nucleus (dLGN) serve as a model for exploring how precise patterns of circuitry form during development in the mammalian central nervous system. Using a combination of dual-label anterograde retinogeniculate tracing and Nissl-staining, we studied the patterns of eye-specific afferents and cellular laminae in the dLGN of the pigmented sable ferret at eight developmental timepoints between birth and adulthood. Each time point was investigated in the three standard orthogonal planes of section, allowing us to generate a complete anatomical map of eye-specific development in this species. We find that eye-specific retinal ganglion cell axon segregation varies according to location in the dLGN, with the principle contralateral (A) and ipsilateral layers (A1) maturing first, followed by the contralateral and ipsilateral C laminae. Cytoarchitectural lamination lags behind eye-specific segregation, except in the C laminae where underlying cellular layers never develop to accompany eye-specific afferent domains. The emergence of On/Off sublaminae occurs following eye-specific segregation in this species. On the basis of these findings, we constructed a three dimensional map of eye-specific channels in the developing and mature ferret dLGN.
Keywords: retinogeniculate, ferret, eye-specific segregation, cholera toxin, lateral geniculate nucleus, spontaneous retinal activity, retinal wave
Introduction
Highly specific patterns of synaptic connections are critical for normal sensory and cognitive function. In the adult mammalian visual system, axons from the two eyes project to nonoverlapping domains in the dorsal lateral geniculate nucleus (dLGN; eye-specific segregation). Within a given species, the size, shape and position of eye-specific domains are highly stereotyped. In carnivores (Guillery, 1970; Hickey and Guillery, 1974; Sanderson, 1974; Linden et al., 1981; Guillery et al., 1985) the terminal zones of eye-specific retinogeniculate projections are mirrored by cellular laminae; groups of eye-specific dLGN cells separated by cell-sparse intralaminar zones. The ferret is an important model organism for the study of retinogeniculate development as it combines the laminar complexity of the carnivore with the developmental precocity of the mouse. Ferrets are an altricial species, which at birth (P0) are at an immature stage of development with inputs from the left and right eyes commingled in the target. The postnatal development of eye-specific layers in the ferret eliminates the need to perform in utero experimental manipulations that would be necessary to study the development of visual pathways in other species with complex dLGN structure like cats or primates. Further, much work has been done previously to characterize the anatomy and physiology of the mature and developing ferret dLGN (Linden et al., 1981; Stryker and Zahs, 1983; Cucchiaro and Guillery, 1984; Guillery et al., 1985; Zahs and Stryker, 1985; Roe et al., 1989; Hutchins and Casagrande, 1990; Johnson and Casagrande, 1993; Morgan and Thompson, 1993; Thompson et al., 1993; Robson and Geisert, 1994; Cramer and Sur, 1997; Penn et al., 1998; Cook et al., 1999; Hahm et al., 1991, 1999; Weliky and Katz, 1999; Weliky, 1999; Chapman, 2000; Tavazoie and Reid, 2000; Williams and Jeffery, 2001; Stellwagen and Shatz, 2002; Williams et al., 2002; Akerman et al., 2002, 2003, 2004; Kawasaki et al., 2004; Huberman et al., 2002, 2003, 2005b, 2006; Ohshiro and Weliky, 2006).
Early studies investigating the timeline of eye-specific afferent segregation and cellular lamina development in the ferret dLGN relied on monocular anterograde anatomical labeling only, and thus were limited in their ability to resolve the timing and precision of afferent segregation within the nucleus (Linden et al., 1981). More recent experiments used dual-eye labeling with cholera toxin beta (CTβ) fragment conjugates of different colors to study the development of binocular inputs to the dLGN but focused only on the central portion of the nucleus in the horizontal plane of section and at timepoints before (P2) and after (P10) eye-specific segregation is complete (Penn et al., 1998; Huberman et al., 2002, 2003, 2005b; Stellwagen and Shatz, 2002). Given the interest in this system as a model for sensory circuit development, using modern anterograde labeling techniques to perform a complete study of the normal development of the nucleus and its retinal inputs from birth into adulthood is important for interpreting results of studies where eye-specific segregation or lamination is perturbed. Here we document the development of eye-specific and On/Off segregation in the ferret dLGN using the duallabel CTβ method, paying particular attention to differences in the timing of these events according to location in the dLGN. We also document the emergence of eyespecific cytoarchitectural lamination as a function of position in the dLGN, and provide a description of the overall morphological changes of the dLGN as these events proceed. Finally, we provide detailed threedimensional reconstructions of the structure and organization of eye-specific laminae before eye-specific segregation has begun (P2), after eye-specific segregation between layers A/A1 is complete (P10), and at full maturity (>P100).
Materials and Methods
Animals
Timed pregnant Fitch-coat jills were obtained from Marshall Farms (New Rose N.Y.). All experiments were performed in accordance with approved animal care and use protocols at the University of California Davis. Pregnant ferrets were given access to Marshall Ferret food and water ad libitum and were housed in a 16/8 hr light/dark cycle. Postnatal day zero (P0) corresponds to the date of pup birth. Litter size ranged between four and fourteen pups at the time of birth. Runts were culled on the day of birth. All pups used in this study gained weight normally across postnatal development and no gross differences in retinogeniculate or dLGN maturation were observed between animals of the same age. Ages examined in this study were P2 (N=3 sectioned horizontally/N=3 sectioned sagittally/N=2 sectioned coronally), P4 (N=2/N=2/N=3), P6 (N=3/N=2/N=3), P8 (N=2/N=3/N=2), P10 (N=4/N=2/N=3), P15 (N=2/N=3/N=2), P20 (N=5/N=3/N=5), P25 (N=2/N=2/N=4), and adult (N=2/N=2/N=2). N values reflect individual animals.
Anterograde tracing of retinal afferents
Cholera toxin-β subunit (CTβ) conjugated to Alexa Fluor 488 or Alexa Fluor 594 (Invitrogen) were used to fluorescently label retinal ganglion cell projections to the dLGN. In all animals CTβ-488 (6.25 μg/μl) was used to label projections of left-eye origin while CTβ-594 (5 μg/μL) was used to label projections of right-eye origin. The final concentrations of the injected fluorophores were adjusted to yield matching fluorescence intensity in situ. Surgical procedures and tracer injections were performed as previously described (Huberman et al., 2002). Briefly, animals were anesthetized with a mixture of oxygen and inhalant isoflurane prior to surgical exposure of the corneoscleral margin. A small hole was made at the margin to allow insertion of a 33-gauge needle attached to a 10 μL Hamilton syringe. Small volumes of cholera toxin-β subunit conjugated to either Alexa-dye 488 or 594 were injected into the left and right eyes respectively. Injection volumes varied from 2 μL at the youngest ages examined (P2) to 20 μL per eye in adult animals. One day following tracer injection, animals were administered a lethal dose of sodium pentobarbital and transcardially perfused with 0.9% saline followed by 4% paraformaldehyde. Brains were cryoprotected in 30% sucrose and sectioned on a freezing microtome at 40 μm. After imaging dLGN sections (see later), imaged sections were defatted, dehydrated, and stained with thionin (0.45%) to reveal cytoarchitecture of the developing nucleus. For each animal, the eyes were enucleated and retinae removed for flatmounting. Imaging CTβ-labeled retinae confirmed the absence of damage due to intraocular injections.
Photomicrographs
All images were digitally acquired with a CCD camera (SPOT Diagnostic) and stored using Axiovision software (Zeiss). Images were imported into Photoshop (Adobe Systems) where they were cropped, resized, and artifacts outside of the nucleus were occasionally removed for purposes of clarity. Micrographs of fluorescent-labeled afferents were rotated and aligned with those of dLGN cytoarchitecture to facilitate analysis of relationships between eye-specific domains and developing cellular laminae. Images of ipsilateral and contralateral afferents were superimposed to demonstrate spatial relationships between axons of the two eyes. Overlapping pixels (see later) were pseudocolored yellow for clarity. In a few cases, thionin-stained tissue sections corresponding to the fluorescent micrographs were damaged or acquired distracting artifacts during the thionin staining procedure. In these cases, adjacent tissue sections were used to demonstrate cytoarchitecture. In some cases, the best exemplar photomicrographs of eye-specific afferents were those in which contralateral afferents were labeled with CTβ-594 and ipsilateral with CTβ-488. These images were gray scaled and pseudocolored to match those images in which contralateral/ipsilateral projections were labeled with 488/594, respectively. For examining afferent refinement across the nucleus, 3–5 tissue sections were imaged from the dorsal, central, and ventral regions of the horizontal plane; the lateral, central, and medial regions of the sagittal plane; and the anterior, central, and posterior regions of the coronal plane. For timepoints P15 and older, several brains were hemisected and one hemisection cut coronally and the other horizontally. This control confirmed that the patchy domains of the C laminae were not an artifact of retinogeniculate afferent damage. The data for these experiments were not included in the quantification analysis because the two dLGNs were cut orthogonally relative to one another.
Threshold analysis and quantification
To examine the precise spatial relationship of eye-specific refinement across development, individual photomicrographs of contralateral and ipsilateral projections were gray scaled, thresholded, and quantified (Supporting Information Fig. 19). Threshold was defined as the point at which the background (defined as a nonretinorecipient region of the dorsal thalamus ~1 mm lateral to the midline) saturated. Subsequent to the determination of this background threshold level, images were adjusted to a range of threshold values from 20% to 70% above this background level. For each tissue section examined, contralateral and ipsilateral labels were independently evaluated for background label and then thresholded to identical values (20%–70% threshold). Absolute areas of ipsilateral/contralateral inputs were quantified using ImageJ (Rasband, 1997). Multiplying the thresholded image of each eye-specific projection with its counterpart in the same tissue section revealed pixels overlapping between contralateral and ipsilateral images. Quantification of these images was accomplished by selecting all resultant white pixels using ImageJ. For each animal, 3–5 sections through the central 120–200 μm were imaged, multithresholded, and quantified for each threshold (20%–70% above background). For statistical analysis, mean overlap values were calculated from the complete population of the aforementioned thresholded images for animals of each age, plane of section, and threshold value. In computing standard errors of the mean, N reflects the number of animals studied at each timepoint.
Three-Dimensional Reconstructions
Automated rigid body image alignments of raw fluorescent RGB images corresponding to serial sections were performed in ImageJ (Rasband, 1997) using the plugin, StackReg, that implement a pyramid approach to subpixel registration based on pixel intensity (Thevanaz et al., 1998). Intensity-based thresholds were manually applied across RGB channels of fluorescent images comprising aligned image stacks using Photoshop Extended CS3 (Adobe Systems) to generate binary images with eye-specific anterogradely transported label segmented. Three-dimensional volumetric reconstructions were performed using Isosurf, a freeware program that uses regularized marching tetrahedra for iso-surface extraction (Treece et al., 1999) and were validated against volumetric renderings of the original aligned RGB image stack using Imaris, v5 (Bitplane). Three-dimensional reconstructions, using the extracted isosurfaces, were rendered in Lightwave 3D, v9.3.1 (Newtek).
Results
Postnatal Day 2 (P2)
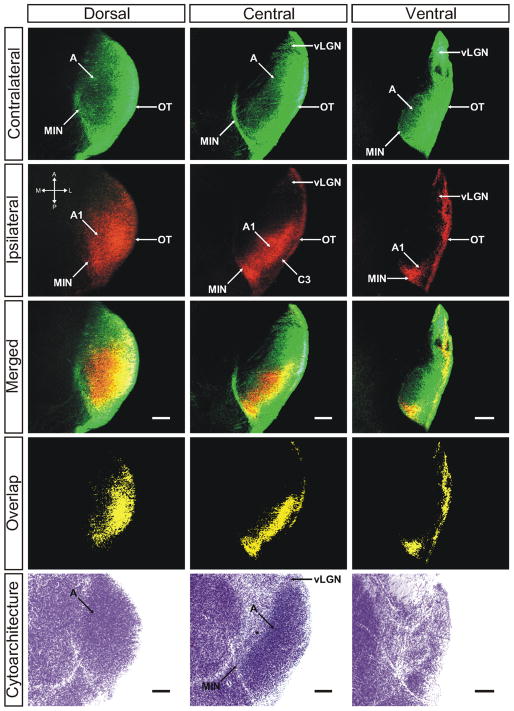
Two days following birth (P2), retinal ganglion cell (RGC) axons from the two eyes are commingled in the dorsal lateral geniculate nucleus (dLGN). Both ipsilateral (red in all photomicrographs) and contralateral (green in all photomicrographs) axons running together in the optic tract traverse the ventral aspect of the diencephalon and turn up and back along the dLGN to ensheath the dorsal and lateral limits of the nucleus. Already by P2, the earliest stage of development examined in this study, the dLGN can be visualized independently of the perigeniculate nucleus, the medial intralaminar nucleus (MIN), and ventral lateral geniculate nucleus (vLGN), each of which appears as a cell sparse region adjacent to the body of the dLGN in horizontal sections of Nissl-stained tissue (Fig. 1). Labeled contralateral axons extend medially into the MIN to form a cape that extends toward the anterior pole of the geniculate terminating at the posteromedial aspect of the perigeniculate region (Fig. 1, contralateral/central panel). The ventral lateral geniculate nucleus (vLGN) can be seen as a region of RGC innervation separated from the dLGN by a fine uninnervated region.
Figure 1.
The ferret dLGN in the horizontal plane of section at postnatal day 2. Contralateral retinal inputs are green, ipsilateral inputs are red. Dorsal, central, and ventral sections through the nucleus are shown. Overlap represents multiplication of ipsilateral and contralateral signals thresholded to 30% above background. A, contralateral lamina; A1, ipsilateral lamina; OT, optic tract; vLGN, ventral lateral geniculate nucleus; MIN, medial intralaminar nucleus; *, perigeniculate nucleus. Scale bars: 200 μM
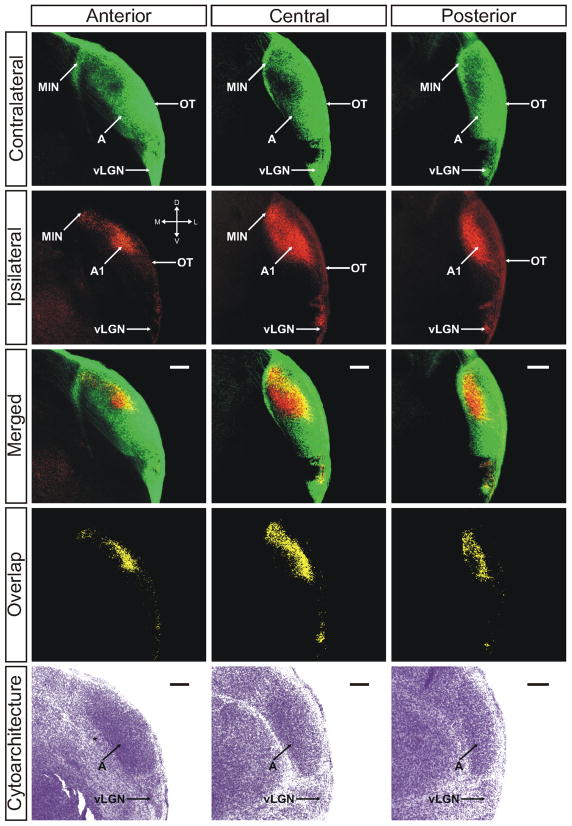
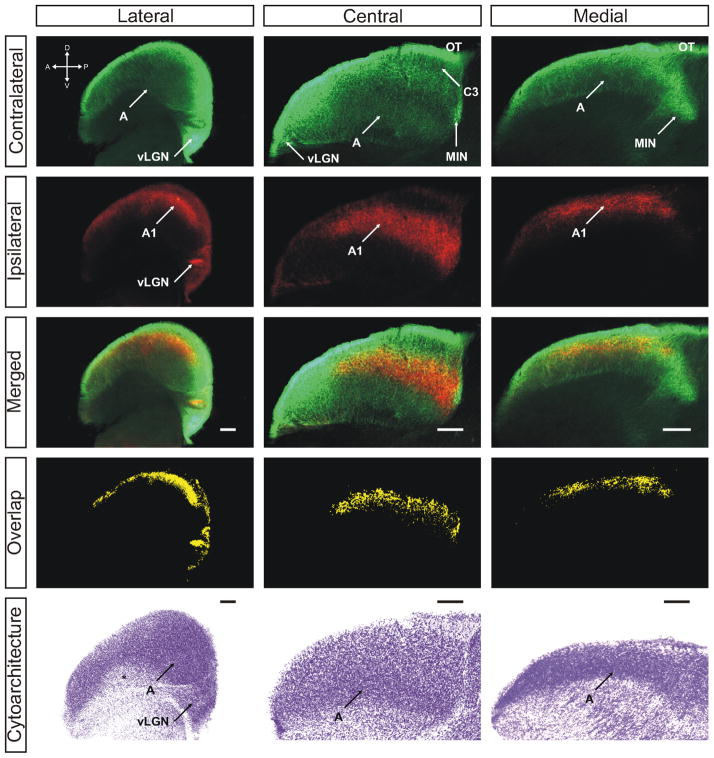
Although binocularly innervated at this age, it is evident that the contralateral retinogeniculate projection is the dominant input to the P2 vLGN. Contralateral afferents show substantial innervation of the MIN, the vLGN, and the monocular portion of the dLGN, which is found anterior to the edge of the ipsilateral projection. Contralateral afferents project across the dorsoventral and mediolateral extent of the dLGN at all anteroposterior lines of projection, but the density of the labeled neuropil is not uniform. Contralateral afferent density is reduced in a centromedial region and this corresponds to an area of greater ipsilateral afferent density. Inhomogeneity in the density of contralateral projections within the dLGN is also evident where the projections to the C laminae and lateral edge of the monocular zone appear denser than those sparse projections that reach the medial aspect of the nucleus. At the earliest age examined, ipsilateral projecting RGCs ramify widely within the dLGN and are found in both the MIN and vLGN, but in each case are more restricted than their contralateral counterparts (Figs. 1–3). Within the dLGN, ipsilateral afferents form a large central termination zone that is most widespread along the mediolateral axis towards the dorsal pole and tapers gradually toward the ventral portion of the nucleus along the dorsoventral axis. Throughout this zone, with the exception of the centromedial most aspect (Fig. 3, merged/central panel), ipsilateral afferents overlap extensively with contralateral afferents, thereby defining the region of competition for eye-specific territory.
Figure 3.
The ferret dLGN in the coronal plane of section at postnatal day 2. Contralateral retinal inputs are green, ipsilateral inputs are red. Anterior, central, and posterior sections through the nucleus are shown. Overlap represents multiplication of ipsilateral and contralateral signals thresholded to 30% above background. A, contralateral lamina; A1, ipsilateral lamina; OT, optic tract; vLGN, ventral lateral geniculate nucleus; MIN, medial intralaminar nucleus; *, perigeniculate nucleus. Scale bars: 200 μM
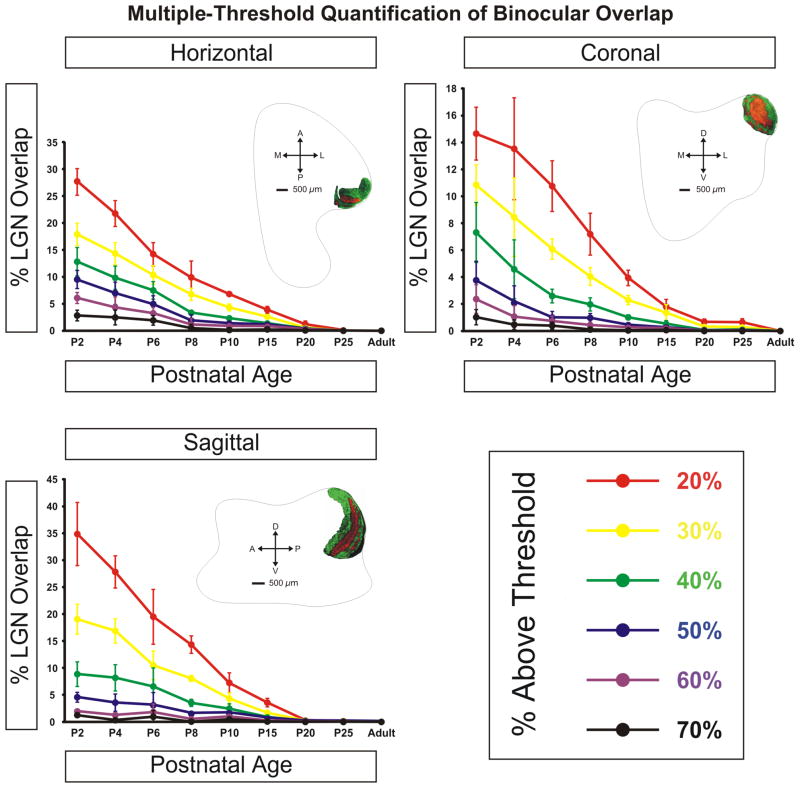
As alluded to previously, the ipsilateral projection appears denser in the zone of lowest contralateral afferent density (Figs. 2 and 3). This region is the putative future site of layer A1, which will receive only ipsilateral axons when eye-specific segregation is complete. Ipsilateral eye RGC axons additionally innervate a portion of the MIN, though not the extended leaflet innervated by contralateral axons. Instead, ipsilateral projections form a dense termination cluster at the posteromedial intersection of the dLGN and the MIN leaflet (Fig. 1, ipsilateral/central panel). This region is completely overlapped with afferents from the contralateral eye. Additionally, ipsilateral RGCs project to the vLGN although with a reduced density compared to contralateral afferents. As can be seen in ventral horizontal sections (Fig. 1, right panel) the ipsilateral inputs to the vLGN appear to restrict themselves to the posterolateral border of the nucleus immediately adjacent to the optic tract, where they overlap completely with the more widely distributed contralateral afferents. The widespread ramification of both contralateral and ipsilateral projections within the dLGN results in significant overlap of signal from the two anterograde tracers used in this study (Figs. 1–3; “Methods” section). Quantification of the degree of overlap is dependent on the plane of section examined (Fig. 4). For the planes of section cutting across the long rostrocaudal axis of the developing nucleus, binocular overlap is 17.96% ± 2.13% (horizontal plane) and 18.96% ± 2.83% (sagittal plane) of the total dLGN area measured at 30% above threshold (see “Methods” section). In the coronal plane, which cuts across the minor dorsoventral axis of the dLGN at this young age, the measured overlap is 10.84% ± 1.51% at 30% above threshold.
Figure 2.
The ferret dLGN in the sagittal plane of section at postnatal day 2. Contralateral retinal inputs are green, ipsilateral inputs are red. Lateral, central, and medial sections through the nucleus are shown. Overlap represents multiplication of ipsilateral and contralateral signals thresholded to 30% above background. A, contralateral lamina; A1, ipsilateral lamina; OT, optic tract; vLGN, ventral lateral geniculate nucleus; MIN, medial intralaminar nucleus; *, perigeniculate nucleus. Scale bars: 200 μM
Figure 4.
Quantification of binocular retinogeniculate afferent overlap across development. Threshold analysis results based on the methods described in Supplemental Figure 19 are shown for threshold values 20–70% above background for the three planes of section. Overlap is maximal at birth and decreases smoothly during the first 20 postnatal days at which point overlap between left/right eye inputs is absent. Each data point reflects mean value of measured overlap. Error bars reflect ± S.E.M. Photomicrograph insets are representative of the dLGN in adult animals. Note the Y-axes differ amongst the three graphs. See Methods for details on the quantification analyses performed.
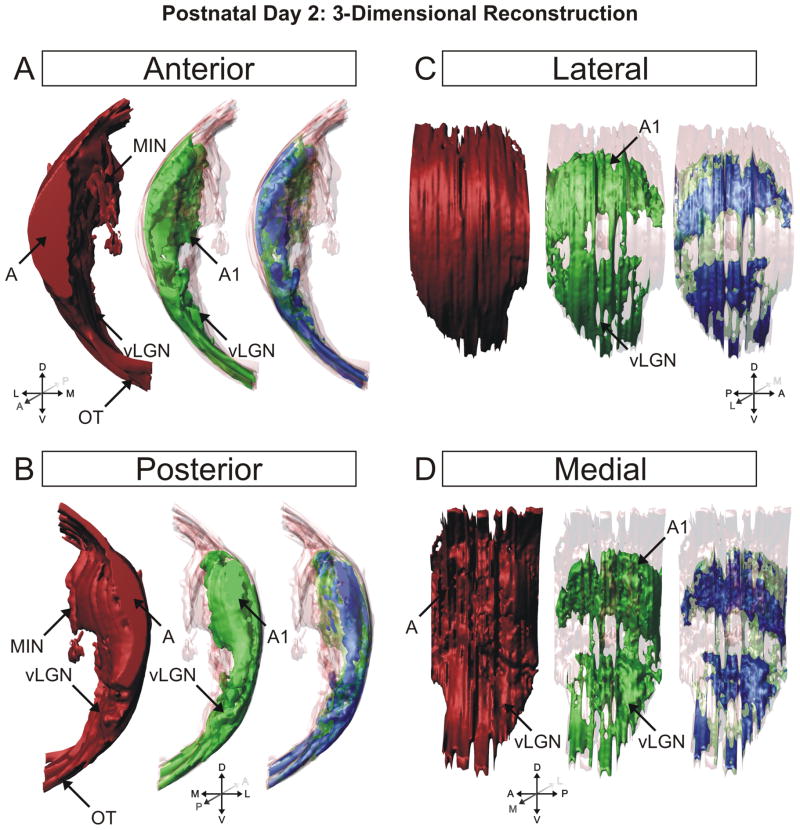
The difference in measured overlap as a function of plane of section is a feature of the three-dimensional architecture of the nucleus at young ages (Fig. 5). At this young age, the major axis of the nucleus is aligned rostrocaudally relative to the thalamus as a whole. Over the first 10 days of postnatal development, the anterior pole of the nucleus pitches upward and the major axis shifts to a dorsoventral orientation relative to the thalamus (Supporting Information Fig. 17). Because measured overlap is not uniform within the nucleus, the location of greatest overlap reveals interesting features of retinogeniculate development. As mentioned earlier, there is a region of sparse contralateral innervation, which is dense with axon branches of the ipsilateral retinogeniculate projection. This region is the future site of the ipsilateral-afferent specific layer A1 and it can be seen qualitatively that the degree of binocular overlap is reduced in this area even at this youngest age. In contrast, greater overlap is always seen in those areas of the dLGN destined to become the C laminae. Located toward the dorsal and lateral edges of the nucleus at this age, these areas show high density of both contralateral and ipsilateral terminations resulting in overlap. It shall be seen that it is these areas that are the last to segregate within the nucleus.
Figure 5.
3D reconstruction of the ferret dLGN at postnatal day 2 (P2). Perspectives facing the nucleus from the anterior pole (A), posterior pole (B), lateral aspect (C), and medial aspect (D) are shown. Contralateral projections are shown in red, ipsilateral projections are shown in green, overlapping projections are shown in blue for clarity. At this age, the major axis of the ipsilateral projections is oriented rostrocaudally. A, contralateral lamina; A1, ipsilateral lamina; C1, ipsilateral lamina; MIN, medial intralaminar nucleus; vLGN, ventral lateral geniculate nucleus; OT, optic tract.
Already by P2 an afferent sparse zone has developed between the future C laminae and the optic tract (Fig. 1 ipsilateral/central panel; Fig. 2 contralateral/central panel). This is the presumptive site of lamina C3, which in carnivores receives input from the ipsilateral superior colliculus and ventral lateral geniculate nucleus (Torrealba et al., 1981; Harting et al., 1991; Nakamura et al., 2005). The density of contralateral fibers of passage seen at the lateral limit of the dLGN in the horizontal plane of section (Fig. 1; central/contralateral) may occlude visualization of the nascent afferent sparse - in this plane (see “Discussion” section). Cytoarchitecturally, the P2 dLGN can be visualized independently of the perigeniculate nucleus and the MIN, each of which appears as a cell sparse region adjacent to the body of the dLGN in horizontal tissue sections stained for Nissl substance (Fig. 1). Staining for Nissl substance reveals the vLGN as a region of decreased cell density at the edge adjacent to the dLGN. At this early age there is no evidence of cytoarchitectural segregation within the dLGN to form layers.
P4-P6
Over the next 4 days of postnatal development (P2-P6) the gross morphological structure of the dLGN, vLGN, OT, and MIN is fairly constant (Supporting Information Figs. 1–6). The nucleus begins to pitch such that the anterior limit of the dLGN rises to a more dorsal position and the posterior edge drops ventrally (Supporting Information Fig. 2, 5, 17). This pitch will continue gradually until P10, at which point the nucleus attains an adultlike position along the dorsoventral axis of the thalamus. Occurring simultaneously is the refinement of afferents from the two eyes to occupy more specific territories within the dLGN. The extensive binocular overlap seen at P2 has been significantly reduced, a fact most evident in the central most region of the ipsilateral projection, which will become layer A1. Here the binocular convergence has been reduced to a thin strip along the posterolateral aspect of the ipsilateral territory (Supporting Information Figs. 4 and 6). As shall later be seen, this leaflet of binocular convergence will later undergo eye-specific segregation to become layers C, C1, and C2 of the retinogeniculate projection. At P6 a small patch of contralateral fibers can be found at a distance anterior to the MIN but medial to the dLGN and perigeniculate (Supporting Information Fig. 4, top central panel). This is the emerging wing of the geniculate, which has been previously described (Linden et al., 1981). One additional feature is the reduction of ipsilateral input to the vLGN. As evidenced by a decrease in the measured overlap, the binocular input to this region is pruned over a short time period early in development in parallel with the refinement of major projections to the dLGN. The cytoarchitecture of the aforementioned structures does not evolve dramatically over this time period and cellular layers are not yet evident.
P6-P10
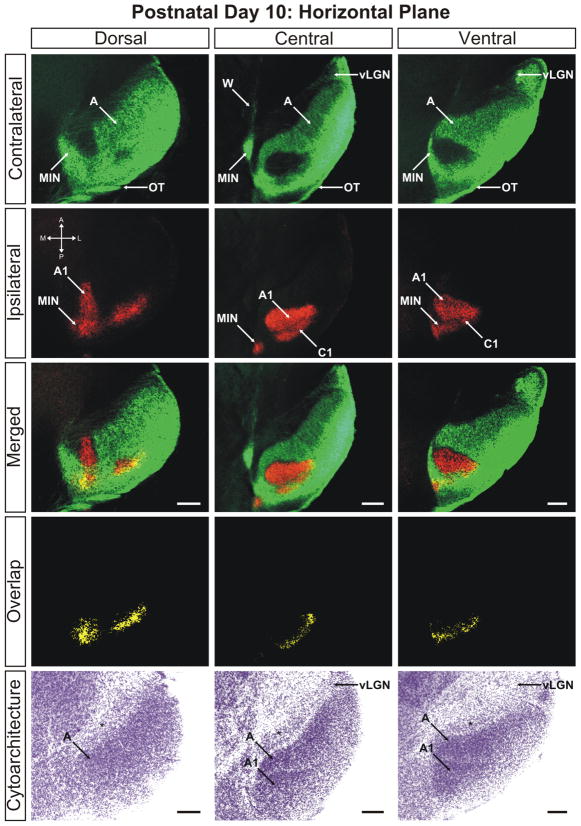
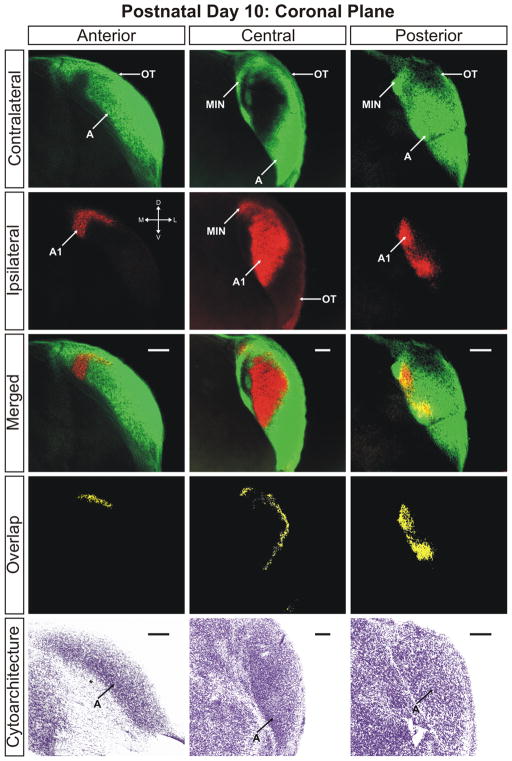
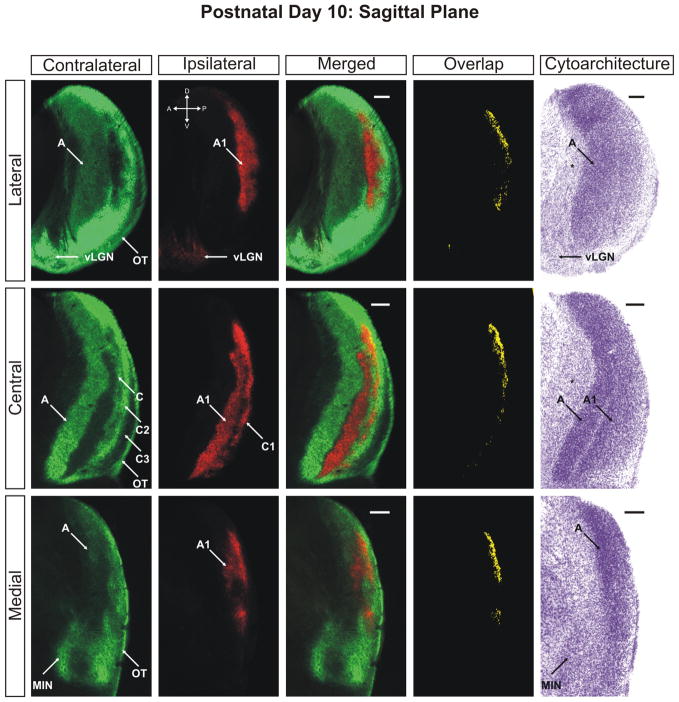
At P8 the segregation of eye-specific afferents is more evident (Supporting Information Figs. 7–9). The extent of the ipsilaterally routed afferents has been reduced along the mediolateral axis of the nucleus and fibers previously extending into the anterior portions of layer A have also retracted significantly. The result is the development of a well-defined ipsilateral layer, which is completely segregated from contralateral fibers along the medial aspect of the dLGN by P10 (Figs. 6–8). The segregation of layer A and A1 is seen in conjunction with a thin afferent-free zone separating the domains along the medial interface (Figs. 6 and 7; merged/central panels). However, at these ages, segregation of the afferents is not entirely complete. Ipsilateral and contralateral afferents are still found to commingle in a region running parallel to the optic tract along the lateral edge of ipsilateral layer C1 resulting in a measurable overlap of 4.34% ± 0.69% of the total dLGN area at 30% above threshold in the horizontal plane (Fig. 4). Between the emerging C1 leaflet and layer A1 is a developing interdigitated leaflet that will continue refinement into contralateral layer C. At this stage, it can be seen that the interface between A1 and C has segregated and overlap is not present between these domains (Figs. 6 and 7). It therefore appears that the final regions of the dLGN to segregate are the borders between C, C1, and C2. There is incomplete separation between ipsilateral layers C1 and A1 as well as between contralateral layers C and C2. This suggests that the immaturity of the C laminae is uniform for C, C1, and C2, while layer C3 is largely mature and void of retinal innervation by P10 (Figs. 6 and 7).
Figure 6.
The ferret dLGN in the horizontal plane of section at postnatal day 10. Dorsal, central, and ventral sections through the nucleus are shown. Overlap represents multiplication of ipsilateral and contralateral signals thresholded to 30% above background. A, contralateral lamina; A1, ipsilateral lamina; C1, ipsilateral lamina; OT, optic tract; vLGN, ventral lateral geniculate nucleus; W, wing of the geniculate; MIN, medial intralaminar nucleus; *, perigeniculate nucleus. Scale bars: 200 μm
Figure 8.
The ferret dLGN in the coronal plane of section at postnatal day 10. Contralateral retinal inputs are green, ipsilateral inputs are red. Anterior, central, and posterior sections through the nucleus are shown. Overlap represents multiplication of ipsilateral and contralateral signals thresholded to 30% above background. A, contralateral lamina; A1, ipsilateral lamina; OT, optic tract; vLGN, ventral lateral geniculate nucleus; MIN, medial intralaminar nucleus; *, perigeniculate nucleus. Scale bars: 200 μm
Figure 7.
The ferret dLGN in the sagittal plane of section at postnatal day 10. Contralateral retinal inputs are green, ipsilateral inputs are red. Lateral, central, and medial sections through the nucleus are shown. Overlap represents multiplication of ipsilateral and contralateral signals thresholded to 30% above background. A, contralateral lamina; A1, ipsilateral lamina; C, contralateral lamina; C1, ipsilateral lamina; C2, contralateral lamina; C3, retinal afferent free lamina; OT, optic tract; vLGN, ventral lateral geniculate nucleus; MIN, medial intralaminar nucleus; *, perigeniculate nucleus. Scale bars: 200 μm
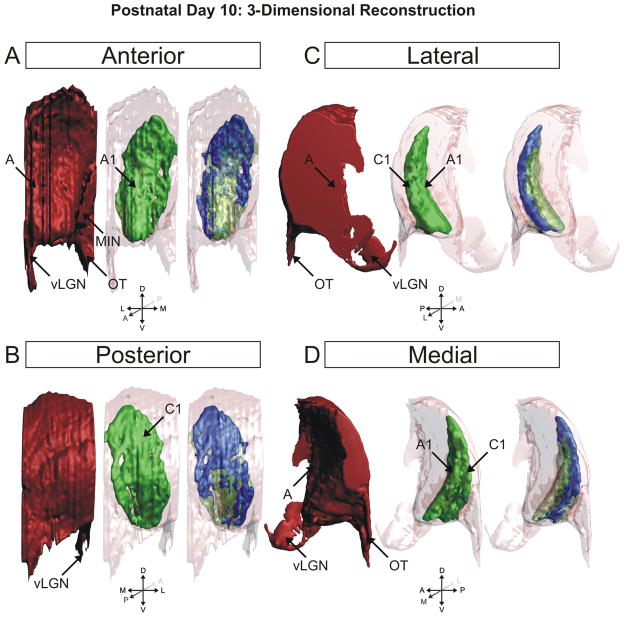
The overlap remaining at P10 can be clearly seen in the three-dimensional reconstruction of the nucleus at this age (Fig. 9). Seen as the blue shading, the overlap between left-eye/right-eye inputs to the dLGN is confined to the C laminae and the posterior aspect of the medial intralaminar nucleus. It appears there is a greater percentage of total overlap toward the dorsal pole of the nucleus, which can be seen in the posterior views of the 3D reconstruction (Fig. 9) as well as the original photomicrographs in the sagittal plane of section (Fig. 7). Importantly, P10 marks the first timepoint in our study in which cytoarchitectural layers appear. It can be seen in the horizontal (Fig. 6) and sagittal (Fig. 7) planes of section that contralateral layer A and ipsilateral layer A1 are separated from one another by a thin cell sparse zone that maps neatly to the afferent free zone seen with anterograde retinogeniculate labeling. Though faint, this cytoarchitectural feature is clearest in the central portions of the dLGN and is less discriminable at either pole along the DV or LM axis. By postnatal day 10, the dLGN has achieved its maximal pitch relative to its orientation at birth and is adult like in its position along the dorsoventral axis of the thalamus (Supporting Information Fig. 17).
Figure 9.
3D reconstruction of the ferret dLGN at postnatal day 10 (P10). Perspectives facing the nucleus from the anterior pole (A), posterior pole (B), lateral aspect (C), and medial aspect (D) are shown. Contralateral projections are shown in red, ipsilateral projections are shown in green, overlapping projections are shown in blue for clarity. At this age, the major axis of the ipsilateral projections is oriented dorsoventrally. A, contralateral lamina; A1, ipsilateral lamina; C1, ipsilateral lamina; MIN, medial intralaminar nucleus; vLGN, ventral lateral geniculate nucleus; OT, optic tract.
P15-P20
By P15 the nucleus has grown substantially in size and begun a gradual shift in mediolateral orientation relative to the nearly fixed position occupied during P0-P10 (Supporting Information Fig. 16). From this stage until the final maturation of the nucleus, the dLGN yaws such that the anterior pole will be rotated ~45 degrees toward the lateral aspect of the dorsal thalamus. This ultimately results in the placement of the C laminae directly parallel to the posterior limit of the dorsal thalamus. By P10, eye-specific segregation of retinal afferents is complete between the principle retinorecipient layers A and A1. However, binocular innervation of the C laminae persists even at P15. The pattern of this overlap is similar in structure to that seen at P10, but quantitatively reduced (<4% of total dLGN volume at 30% threshold) compared to this earlier timepoint (Fig. 4). The overlap seen at the medial edge of coronal sections through the posterior pole reflects lingering binocular convergence in the MIN (Supporting Information Fig. 12). By P15 there is enhanced segregation of contralateral layer C from C2 and ipsilateral layer A1 from C1. Cytoarchitectural separation of layers A and A1 continues such that clear laminar separation can be seen at all levels of the nucleus in the horizontal and sagittal planes of section (Supporting Information Figs. 10 and 11). However, intralaminar segregation of On/Off channels has not yet become evident at P15.
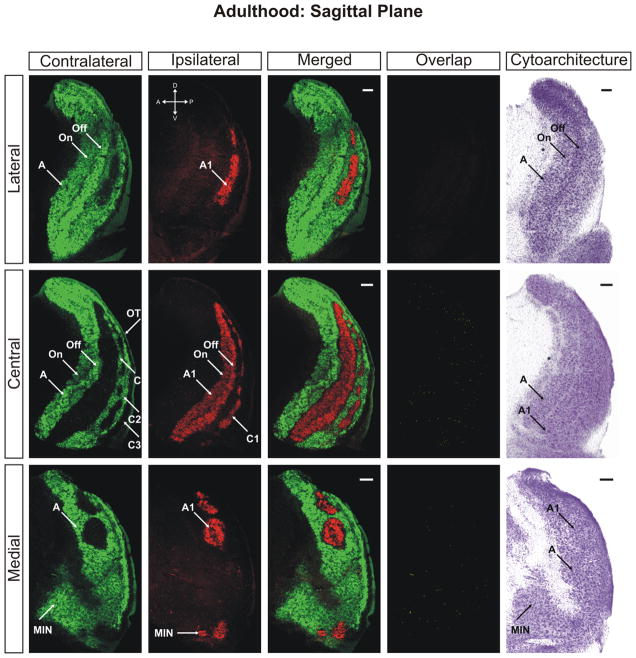
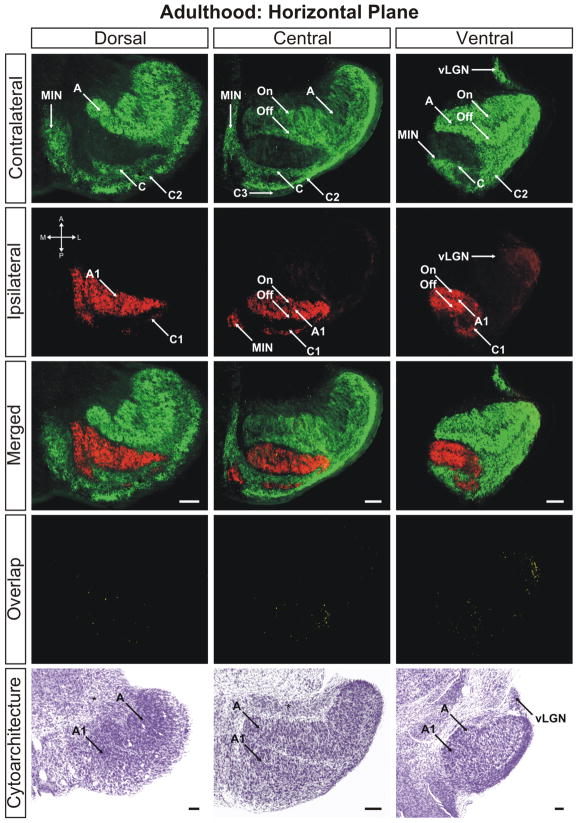
Of particular interest is the emergence of discontinuities in the ipsilateral and contralateral projections to the dLGN. In all three planes, retinal afferents toward the posterior pole of the nucleus corresponding to the C laminae fragment into a series of patches that span the entire DV axis of the nucleus (Supporting Information Figs. 10–15). Control analyses indicate these patches are genuine anatomical features of the nucleus and not artifact related to retinal damage or anterograde tracing anomalies (see “Methods” section). In lateral sections of the dLGN in the sagittal plane, the ipsilateral projection appears as a discontinuous patchwork reflecting the edge contours of layer A1. These patches, which are pronounced as early as P15, are mirrored by patchy cytoarchitectonic domains (Supporting Information Figs. 11 and 14, Nissl staining in top right panels). This matching of patchy label in ipsilateral layer A1 with underlying cytoarchitectonic patches stands in contrast to the patterns seen in the C laminae for both contralateral and ipsilateral afferents. Despite the clear segregation of contralateral and ipsilateral C laminae, there are no underlying cellular layers in these domains within the dLGN (Supporting Information Figs. 11 and 14). This lack of cytoarchitectonic differentiation is a defining feature of the C laminae (see “Discussion” section). At P20 the first suggestion of On/Off segregation is evident. There are thin afferent sparse zones within the A and A1 laminae (Supporting Information Figs. 13 and 14). These boundaries are not smoothly linear as is the afferent free border between A and A1, but appear as irregular bands of afferent-free territory running roughly parallel to the major axis of each lamina. The differentiation of On/Off sublaminae can rarely be detected cytoarchitecturally, although in some cases staining for Nissl substance reveals On/Off sublaminae, which appear via inhomogeneity in the stain intensity and a faintly discernable cell sparse border separating the domains (Fig. 14, top right panel).
Figure 14.
The ferret dLGN in the sagittal plane of section at adulthood (>P100). Contralateral retinal inputs are green, ipsilateral inputs are red. Lateral, central, and medial sections through the nucleus are shown. Overlap represents multiplication of ipsilateral and contralateral signals thresholded to 30% above background. A, contralateral lamina; A1, ipsilateral lamina; On, ‘On’ center sublamina; Off, ‘Off’ center sublamina; C, contralateral lamina; C1, ipsilateral lamina; C2, contralateral lamina; C3, retinal afferent free lamina; OT, optic tract; MIN, medial intralaminar nucleus; *, perigeniculate nucleus. Scale bars: 200 μm
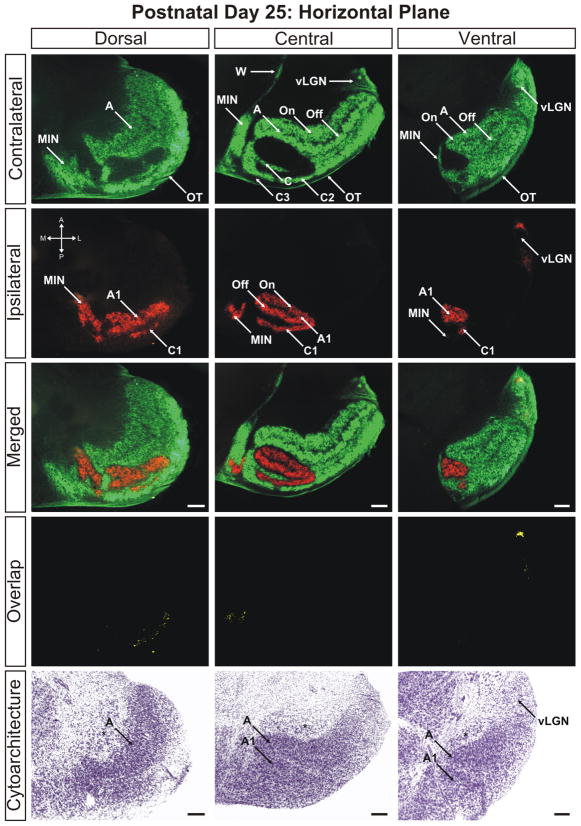
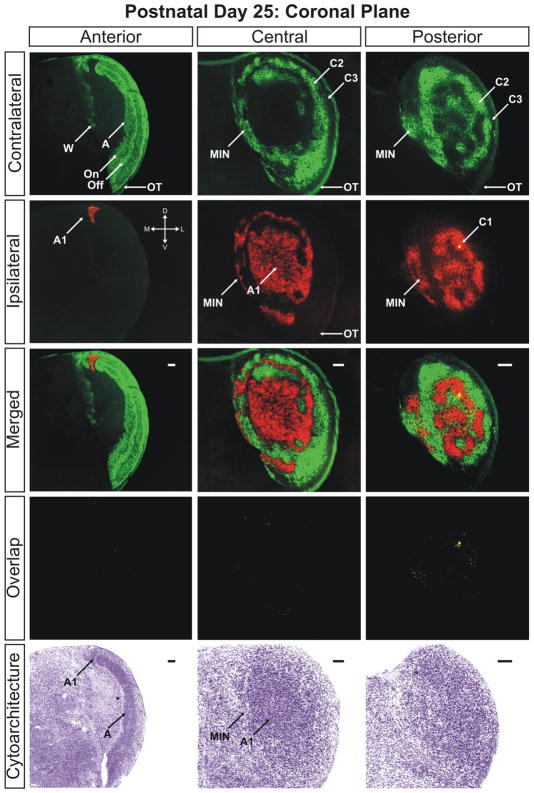
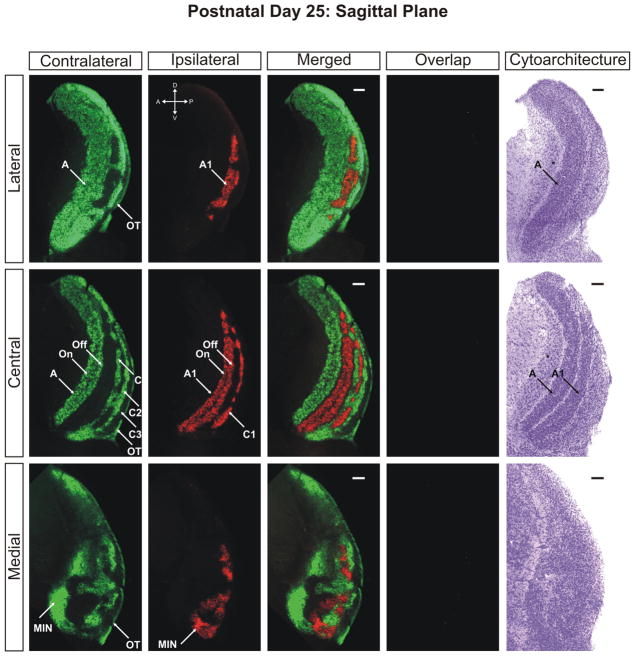
P25-Adult
By postnatal day 25 the dLGN has achieved maturity in eye-specific segregation, lamination, and development of On/Off sublaminae (Figs. 10–12). Between this time point and adulthood, the nucleus grows in size only marginally and no additional large-scale anatomical developmentoccurs. At this stage the dLGN has reached its final position in the dorsal thalamus and the outward rotation of the nucleus is essentially complete (Supporting Information Figs. 16–18). Visualization of the adult dLGN reveals the clear separation of the ipsilateral C1 laminae from layer A1 (Figs. 13 and 14). The C1 laminar domains are a meshwork of thin territories connected at points to layer A1 via bridges of ipsilateral input. The contralateral layers C and C2 form similarly complicated anastomoses (Figs. 14 and 15). It can also be seen clearly that the ipsilateral projections to the MIN form a distinct termination zone that is discontinuous with the body of A1 or ipsilateral C laminae (Fig. 13; central/merged panel). The ipsilateral projection to the vLGN has been reduced dramatically to a small patch of innervation (Fig. 16). One additional point to note is the variability in C laminae across individuals. In our three dimensional analysis of several adult ferrets, we have encountered systematic homogeneity in the structure of layers A and A1. However, the C laminar meshworks appear to be varied between animals and the locations of individual afferent termination zones are not rigidly stereotyped (data not shown).
Figure 10.
The ferret dLGN in the horizontal plane of section at postnatal day 25. Dorsal, central, and ventral sections through the nucleus are shown. A, contralateral lamina; A1, ipsilateral lamina; On, ‘On’ center sublamina; Off, ‘Off’ center sublamina; C, contralateral lamina; C1, ipsilateral lamina; C2, contralateral lamina; C3, retinal afferent free lamina; OT, optic tract; vLGN, ventral lateral geniculate nucleus; W, wing of the geniculate; MIN, medial intralaminar nucleus; *, perigeniculate nucleus. Scale bars: 200 μm
Figure 12.
The ferret dLGN in the coronal plane of section at postnatal day 25. Anterior, central, and posterior sections through the nucleus are shown. A, contralateral lamina; A1, ipsilateral lamina; On, ‘On’ center sublamina; Off, ‘Off’ center sublamina; C1, ipsilateral lamina; C2, contralateral lamina; C3, retinal afferent free lamina; OT, optic tract; W, wing of the geniculate; MIN, medial intralaminar nucleus; *, perigeniculate nucleus. Scale bars: 200 μm
Figure 13.
The ferret dLGN in the horizontal plane of section at adulthood (>P100). Dorsal, central, and ventral sections through the nucleus are shown. A, contralateral lamina; A1, ipsilateral lamina; On, ‘On’ center sublamina; Off, ‘Off’ center sublamina; C, contralateral lamina; C1, ipsilateral lamina; C2, contralateral lamina; C3, retinal afferent free lamina; OT, optic tract; vLGN, ventral lateral geniculate nucleus; MIN, medial intralaminar nucleus; *, perigeniculate nucleus. Scale bars: 200 μm
Discussion
The developing retinogeniculate pathway is a model system for the study of central nervous system circuit development. The earliest studies of the projections from left and right eyes to the dLGN characterized the principle events involved in retinogeniculate refinement. Here we extend those findings by using modern methods to further delineate (1) the development of eye-specific and On/Off retinogeniculate projections, (2) the development of eye-specific and On/Off cytoarchitecture, and (3) the organization of the mature ferret dLGN. Our histological analysis of these features in three planes of section constitutes an anatomical map of ferret retinogeniculate development.
The general conclusion to be drawn from an examination of binocular afferents at the earliest stage examined in our study is that RGC axons of each eye project widely to the dLGN, vLGN, and MIN. However, this widespread innervation is not uniform. The density of contralateral innervation in the dLGN appears high adjacent to the optic tract and thins out toward the medial margin of the developing A lamina. The ipsilaterally routed afferents are widespread, but more conservative in their assault on dLGN territories than those of contralateral eye origin. Further, the density of the ipsilateral projection within the dLGN is high in the region of sparse contralateral input. This zone, which is present even as early as P2, is the future site of ipsilateral layer A1. The apparent asymmetry in the density of ipsilateral versus contralateral input to this region may confer advantage to the ipsilateral axon terminals in this domain during eye-specific competition for target territory (for review see Torborg and Feller, 2005). However, the widespread extent of binocular inputs to the geniculate is the most salient feature of the nucleus at this early age, resulting in extensive overlap between afferents from the two eyes. Over time, this overlap is resolved along a smooth continuum evidenced by a gradual reduction in the degree of quantified overlap (Fig. 4). Overlap even at early ages is highest in the presumptive C laminae. This is also the area of highest signal of contralateral eye labeling. However, the intensity of signal in this region nearest the optic tract is not an artifact of the thresholding technique, but rather reflects a higher density of anterograde tracer in this region. This increased density is apparent in the horizontal plane of section, but less so in the sagittal plane. This can be explained by the orientation of the nucleus of this age, which has its long axis oriented rostrocaudal relative to the dorsal thalamus as a whole. The consequence of this alignment is that horizontal sections likely show a greater level of signal due to fibers of passage descending ventromedially from the optic tract. However, this potential confound can be avoided by selecting appropriate planes for histological sectioning at different ages.
Our investigation confirms that by postnatal day 10, contralateral and ipsilateral afferents to layers A and A1 respectively have established independent territories and are segregated from one another. The remaining overlap in binocular input to the dLGN occurs in the C laminae, which are slower to emerge. What is the significance of persistent overlap in these domains? It has been previously shown that that the C laminae receive upwards of 35% of their inputs from W-type retinal ganglion cells while the principle A and A1 layers do not receive input from W-type RGCs (Wilson and Stone, 1975; Wilson et al., 1976). This difference in cellular composition and functional input may contribute to the delay in developmental maturation of the C laminae in several ways. One possibility is that RGC axons projecting to the C laminae or the relay neurons of the C laminae themselves express molecular cues distinct from the A laminae that establish a different time course of development. Indeed, the C laminae exhibit a distinct gene expression profile relative to the A and A1 laminae which themselves have not been shown to have differential gene expression profiles from one another (Kawasaki et al., 2004). Previous studies in the ferret have revealed the importance of molecular signals for the development of segregated eye-specific laminae (Huberman et al., 2005b) and it is possible that currently undefined molecular signaling mechanisms in the C laminae regulate the time course of their protracted development.
An alternative, but not mutually exclusive, possibility is that the spontaneous activity patterns passed from the developing retina to the developing dLGN during eye-specific segregation are important for the differential maturation of the A/A1 versus C laminae. Previous studies in ferrets and mice have shown that normal spontaneous retinal activity is essential for the development of segregated eye-specific domains (Torborg and Feller, 2005; Huberman, 2007; Huberman et al., 2008a). Additionally, the structure of spontaneous activity is different between different types of RGC (Wong and Oakley, 1996; Myhr et al., 2001; Lee et al., 2002; Liets et al., 2003; Kerschensteiner and Wong, 2008). In light of the aforementioned laminar differences in RGC input to the dLGN, the spontaneous activity exhibited by W-type RGCs may be prohibitive for early and distinct segregation of afferents, or the features of activity necessary to drive refinement are missing or altered in this cell class compared to beta (X) and alpha (Y) type RGCs. Further, regions receiving W cell input have a different synaptic organization compared to regions receiving X and Y cell input (Mize et al., 1986), raising the possibility that differences in local circuit connectivity may contribute to the differing developmental time courses in the C versus the A layers.
Our finding that cellular laminae in the dLGN never develop to accompany afferent laminae in C layer territory is consistent with the claim that this area of the nucleus is developmentally distinct from the principle A/A1 laminae. Additionally, we have observed that the C laminae of adult ferrets appear variable between individuals whereas the principle eye-specific A/A1 laminae are highly stereotyped. Thus, there exist several features of the C laminae which distinguish them from the A laminae and it may be the case that multiple mechanisms establish the time course and patterning of eye-specific segregation in these disparate regions. Along the dorsoventral axis of the emerging C layers, it is evident that overlap is extensive toward the dorsal pole of the C laminae. Previous physiological study of the ferret dLGN at maturity revealed that there is expansion of the central visual field representation in the caudal dLGN toward the dorsal and medial aspects of the nucleus (Zahs and Stryker, 1985). From our analysis, it appears that this region contains extensive binocular overlap at P10. Given the expansion of the central visual field representation in the caudal dLGN it is possible that the bias in overlap in the dorsomedial dLGN is a reflection of the number of binocular inputs dedicated to central visual field representation. However, we cannot rule out the possibility that there are differences in the rate or precise structure of retinal afferent maturation as a function of retinal eccentricity or individual ganglion cell types. Recently emerging are genetic methods of labeling select RGC mosaics that will be of great use in exploring this unresolved issue (Huberman et al., 2008b; Kim et al., 2008).
It is unlikely that the presence of overlap in our study at this or any age is the result of artifact introduced by our thresholding technique (see Supporting Information Fig. 19 and “Methods” section). As seen in the presented quantification, binocular convergence occurs even at the highest thresholds examined at P2 (70% above background; Fig. 4). At these thresholds, genuine signal reflecting anterograde label in the dLGN is greatly attenuated and dramatically reduces the estimation of binocular overlay. With previous publications as precedent, a threshold value of 30% above background yields the most accurate measure of the signal in retinogeniculate afferents following anterograde tracing (Penn et al., 1998; Huberman et al., 2002, 2003, 2005a,b; Stellwagen and Shatz, 2002; Torborg et al., 2005; Bjartmar et al., 2006). In several previous reports in the ferret, automatic pixel selection tools were used which include negative (unlabeled) space and overestimate the degree of binocular overlap (Huberman et al., 2002, 2003). In this study, we manually traced the borders of all labeled regions of interest and excised negative space from our measurements, thereby achieving greater accuracy in our assessment of binocular overlap. Our quantification reveals that, in the commonly viewed horizontal plane of section thresholded to 30% above background, at P2 17.96% ± 2.13% of dLGN territory is occupied by afferents from both eyes and this number is reduced to 4.35% ± 0.69% by P10 (Fig. 4).
Although attempts have been made to produce threshold independent analyses of overlapping left-eye/right-eye channels (Torborg and Feller, 2004), these have not proven more effective at defining overlap than the standard threshold metrics such as that employed in the current study and used by other investigators (Torborg et al., 2005). Through multiple-threshold analysis we present a wider range of threshold assessments from high (70% above background) to low (20% above background) than previously reported in the literature in this species or any other. Not surprisingly, the conclusion drawn from our data is that the absolute area of overlap at different developmental stages is directly dependent on the threshold measure selected. Our multiple-threshold method provides new quantitative information describing the relationship between threshold selection and measured overlap.
Our methods for examining the anatomy of bulk retinal projections do not allow us to characterize the precise structure or number of fibers within different regions of the dLGN. As yet, the precise number and pattern of synaptic contacts within different regions of the developing nucleus is unknown and may be important for understanding the mechanisms by which eyespecific circuits develop. However, it should be emphasized that labeling seen in the dLGN following intraocular CTβ injection largely reflects RGC axon terminals in the target. CTβ is transported along individual axonal fibers where it appears to concentrate in axon terminals and varicosities (Angelucci et al., 1996). At early ages, cholera toxin fills the entire target and does not spill over into adjacent nuclei, as evidenced by a lack of labeling in the perigeniculate nucleus. Additionally, there is no spillover into cells of the target itself as geniculocortical afferents are never transneuronally labeled by CTβ. For these reasons, CTβ has been widely used as an anterograde tracer for anatomical studies of eye-specific projections in a variety of species (Ling et al., 1998; Penn et al., 1998; Muir-Robinson et al., 2002; Huberman et al., 2002, 2003, 2005b, 2008a,b; Stellwagen and Shatz, 2002; Jaubert-Miazza et al., 2005; Torborg et al., 2005; Cang et al., 2005a,b; Ziburkus and Guido, 2006; Bjartmar et al., 2006; Demas et al., 2006; Fleming et al., 2006).
Additionally, physiological recordings in the developing dLGN demonstrate that binocular input to individual relay cells is reduced with a time course that parallels the segregation process seen anatomically (Shatz and Kirkwood, 1984; Jaubert-Miazza et al., 2005; Ziburkus and Guido, 2006). These results strongly suggest that CTβ label seen in the dLGN is located in axon terminals and that overlap reflects binocular input that can be measured physiologically. Our study of the developing ferret dLGN largely confirms the pioneering work of Guillery and colleagues who were the first to study the ferret dLGN (Linden et al., 1981). Our study goes beyond that work by providing specific quantitative measures of binocular overlap between retinogeniculate projections from the two eyes. Our work also demonstrates the emergence and establishment of discontinuities in the contralateral and ipsilateral input to the dLGN, which have been previously described both anatomically and physiologically in the adult (Zahs and Stryker, 1985). We show that the structure of the ferret dLGN is more complex and less homogenous than previously imagined. The finding that different regions of the nucleus segregate at different timescales raises the possibility that multiple distinct cellular mechanisms may be contributing to the emergence of the mature circuits of this first stage of visual relay. The nature of the underlying distinctions between the A and C laminae is ill understood and future study of this system may yield new insight into the constellation of developmental processes that sculpt the emerging CNS.
Supplementary Material
Figure 11.
The ferret dLGN in the sagittal plane of section at postnatal day 25. Contralateral retinal inputs are green, ipsilateral inputs are red. Lateral, central, and medial sections through the nucleus are shown. Overlap represents multiplication of ipsilateral and contralateral signals thresholded to 30% above background. A, contralateral lamina; A1, ipsilateral lamina; On, ‘On’ center sublamina; Off, ‘Off’ center sublamina; C, contralateral lamina; C1, ipsilateral lamina; C2, contralateral lamina; C3, retinal afferent free lamina; OT, optic tract; MIN, medial intralaminar nucleus; *, perigeniculate nucleus. Scale bars: 200 μm
Acknowledgments
The authors thank Phong Nguyen for expert technical advice and Sarah Karlen for helpful comments on the article.
Grant sponsor: NIH; Grant numbers: EY11369, MH077556.
Literature Cited
- Akerman CJ, Grubb MS, Thompson ID. Spatial and temporal properties of visual responses in the thalamus of the developing ferret. J Neurosci. 2004;24:170–182. doi: 10.1523/JNEUROSCI.1002-03.2004. [DOI] [PMC free article] [PubMed] [Google Scholar]
- Akerman CJ, Smyth D, Thompson ID. Visual experience before eye-opening and the development of the retinogeniculate pathway. Neuron. 2002;36:869–879. doi: 10.1016/s0896-6273(02)01010-3. [DOI] [PubMed] [Google Scholar]
- Akerman CJ, Tolhurst DJ, Morgan JE, Baker GE, Thompson ID. Relay of visual information to the lateral geniculate nucleus and the visual cortex in albino ferrets. J Comp Neurol. 2003;461:217–235. doi: 10.1002/cne.10684. [DOI] [PubMed] [Google Scholar]
- Angelucci A, Clasca F, Sur M. Anterograde axonal tracing with the subunit B of cholera toxin: a highly sensitive immunohistochemical protocol for revealing fine axonal morphology in adult and neonatal brains. J Neurosci Methods. 1996;65:101–112. doi: 10.1016/0165-0270(95)00155-7. [DOI] [PubMed] [Google Scholar]
- Bjartmar L, Huberman AD, Ullian EM, Renteria RC, Liu X, Xu W, Prezioso J, Susman MW, Stellwagen D, Stokes CC, Cho R, Worley P, Malenka RC, Ball S, Peachey NS, Copenhagen D, Chapman B, Nakamoto M, Barres BA, Perin MS. Neuronal pentraxins mediate synaptic refinement in the developing visual system. J Neurosci. 2006;26:6269–6281. doi: 10.1523/JNEUROSCI.4212-05.2006. [DOI] [PMC free article] [PubMed] [Google Scholar]
- Cang J, Kaneko M, Yamada J, Woods G, Stryker MP, Feldheim DA. Ephrin-as guide the formation of functional maps in the visual cortex. Neuron. 2005a;48:577–589. doi: 10.1016/j.neuron.2005.10.026. [DOI] [PMC free article] [PubMed] [Google Scholar]
- Cang J, Renteria RC, Kaneko M, Liu X, Copenhagen DR, Stryker MP. Development of precise maps in visual cortex requires patterned spontaneous activity in the retina. Neuron. 2005b;48:797–809. doi: 10.1016/j.neuron.2005.09.015. [DOI] [PMC free article] [PubMed] [Google Scholar]
- Chapman B. Necessity for afferent activity to maintain eyespecific segregation in ferret lateral geniculate nucleus. Science. 2000;287:2479–2482. doi: 10.1126/science.287.5462.2479. [DOI] [PMC free article] [PubMed] [Google Scholar]
- Cook PM, Prusky G, Ramoa AS. The role of spontaneous retinal activity before eye opening in the maturation of form and function in the retinogeniculate pathway of the ferret. Vis Neurosci. 1999;16:491–501. doi: 10.1017/s0952523899163107. [DOI] [PubMed] [Google Scholar]
- Cramer KS, Sur M. Blockade of afferent impulse activity disrupts on/off sublamination in the ferret lateral geniculate nucleus. Brain Res Dev Brain Res. 1997;98:287–290. doi: 10.1016/s0165-3806(96)00188-5. [DOI] [PubMed] [Google Scholar]
- Cucchiaro J, Guillery RW. The development of the retinogeniculate pathways in normal and albino ferrets. Proc R Soc Lond B Biol Sci. 1984;223:141–164. doi: 10.1098/rspb.1984.0087. [DOI] [PubMed] [Google Scholar]
- Demas J, Sagdullaev BT, Green E, Jaubert-Miazza L, McCall MA, Gregg RG, Wong RO, Guido W. Failure to maintain eye-specific segregation in nob, a mutant with abnormally patterned retinal activity. Neuron. 2006;50:247–259. doi: 10.1016/j.neuron.2006.03.033. [DOI] [PubMed] [Google Scholar]
- Fleming MD, Benca RM, Behan M. Retinal projections to the subcortical visual system in congenic albino and pigmented rats. Neuroscience. 2006;143:895–904. doi: 10.1016/j.neuroscience.2006.08.016. [DOI] [PMC free article] [PubMed] [Google Scholar]
- Guillery RW. The laminar distribution of retinal fibers in the dorsal lateral geniculate nucleus of the cat: a new interpretation. J Comp Neurol. 1970;138:339–367. [Google Scholar]
- Guillery RW, LaMantia AS, Robson JA, Huang K. The influence of retinal afferents upon the development of layers in the dorsal lateral geniculate nucleus of mustelids. J Neurosci. 1985;5:1370–1379. doi: 10.1523/JNEUROSCI.05-05-01370.1985. [DOI] [PMC free article] [PubMed] [Google Scholar]
- Hahm JO, Cramer KS, Sur M. Pattern formation by retinal afferents in the ferret lateral geniculate nucleus: developmental segregation and the role of N-methyl-D-aspartate receptors. J Comp Neurol. 1999;411:327–345. doi: 10.1002/(sici)1096-9861(19990823)411:2<327::aid-cne12>3.0.co;2-#. [DOI] [PubMed] [Google Scholar]
- Hahm JO, Langdon RB, Sur M. Disruption of retinogeniculate afferent segregation by antagonists to NMDA receptors. Nature. 1991;351:568–570. doi: 10.1038/351568a0. [DOI] [PubMed] [Google Scholar]
- Harting JK, Huerta MF, Hashikawa T, van Lieshout DP. Projection of the mammalian superior colliculus upon the dorsal lateral geniculate nucleus: organization of tectogeniculate pathways in nineteen species. J Comp Neurol. 1991;304:275–306. doi: 10.1002/cne.903040210. [DOI] [PubMed] [Google Scholar]
- Hickey TL, Guillery RW. An autoradiographic study of retinogeniculate pathways in the cat and the fox. J Comp Neurol. 1974;156:239–253. doi: 10.1002/cne.901560207. [DOI] [PubMed] [Google Scholar]
- Huberman AD. Mechanisms of eye-specific visual circuit development. Curr Opin Neurobiol. 2007;17:73–80. doi: 10.1016/j.conb.2007.01.005. [DOI] [PubMed] [Google Scholar]
- Huberman AD, Dehay C, Berland M, Chalupa LM, Kennedy H. Early and rapid targeting of eye-specific axonal projections to the dorsal lateral geniculate nucleus in the fetal macaque. J Neurosci. 2005a;25:4014–4023. doi: 10.1523/JNEUROSCI.4292-04.2005. [DOI] [PMC free article] [PubMed] [Google Scholar]
- Huberman AD, Feller MB, Chapman B. Mechanisms underlying development of visual maps and receptive fields. Annu Rev Neurosci. 2008a;31:479–509. doi: 10.1146/annurev.neuro.31.060407.125533. [DOI] [PMC free article] [PubMed] [Google Scholar]
- Huberman AD, Manu M, Koch SM, Susman MW, Lutz AB, Ullian EM, Baccus SA, Barres BA. Architecture and activity-mediated refinement of axonal projections from a mosaic of genetically identified retinal ganglion cells. Neuron. 2008b;59:425–438. doi: 10.1016/j.neuron.2008.07.018. [DOI] [PMC free article] [PubMed] [Google Scholar]
- Huberman AD, Murray KD, Warland DK, Feldheim DA, Chapman B. Ephrin-As mediate targeting of eye-specific projections to the lateral geniculate nucleus. Nat Neurosci. 2005b;8:1013–1021. doi: 10.1038/nn1505. [DOI] [PMC free article] [PubMed] [Google Scholar]
- Huberman AD, Speer CM, Chapman B. Spontaneous retinal activity mediates development of ocular dominance columns and binocular receptive fields in v1. Neuron. 2006;52:247–254. doi: 10.1016/j.neuron.2006.07.028. [DOI] [PMC free article] [PubMed] [Google Scholar]
- Huberman AD, Stellwagen D, Chapman B. Decoupling eyespecific segregation from lamination in the lateral geniculate nucleus. J Neurosci. 2002;22:9419–9429. doi: 10.1523/JNEUROSCI.22-21-09419.2002. [DOI] [PMC free article] [PubMed] [Google Scholar]
- Huberman AD, Wang GY, Liets LC, Collins OA, Chapman B, Chalupa LM. Eye-specific retinogeniculate segregation independent of normal neuronal activity. Science. 2003;300:994–998. doi: 10.1126/science.1080694. [DOI] [PMC free article] [PubMed] [Google Scholar]
- Hutchins JB, Casagrande VA. Development of the lateral geniculate nucleus: interactions between retinal afferent, cytoarchitectonic, and glial cell process lamination in ferrets and tree shrews. J Comp Neurol. 1990;298:113–128. doi: 10.1002/cne.902980109. [DOI] [PubMed] [Google Scholar]
- Jaubert-Miazza L, Green E, Lo FS, Bui K, Mills J, Guido W. Structural and functional composition of the developing retinogeniculate pathway in the mouse. Vis Neurosci. 2005;22:661–676. doi: 10.1017/S0952523805225154. [DOI] [PubMed] [Google Scholar]
- Johnson JK, Casagrande VA. Prenatal development of axon outgrowth and connectivity in the ferret visual system. Vis Neurosci. 1993;10:117–130. doi: 10.1017/s0952523800003266. [DOI] [PubMed] [Google Scholar]
- Kawasaki H, Crowley JC, Livesey FJ, Katz LC. Molecular organization of the ferret visual thalamus. J Neurosci. 2004;24:9962–9970. doi: 10.1523/JNEUROSCI.2165-04.2004. [DOI] [PMC free article] [PubMed] [Google Scholar]
- Kerschensteiner D, Wong RO. A precisely timed asynchronous pattern of ON and OFF retinal ganglion cell activity during propagation of retinal waves. Neuron. 2008;58:851–858. doi: 10.1016/j.neuron.2008.04.025. [DOI] [PMC free article] [PubMed] [Google Scholar]
- Kim IJ, Zhang Y, Yamagata M, Meister M, Sanes JR. Molecular identification of a retinal cell type that responds to upward motion. Nature. 2008;452:478–482. doi: 10.1038/nature06739. [DOI] [PubMed] [Google Scholar]
- Lee CW, Eglen SJ, Wong RO. Segregation of ON and OFF retinogeniculate connectivity directed by patterned spontaneous activity. J Neurophysiol. 2002;88:2311–2321. doi: 10.1152/jn.00372.2002. [DOI] [PubMed] [Google Scholar]
- Liets LC, Olshausen BA, Wang GY, Chalupa LM. Spontaneous activity of morphologically identified ganglion cells in the developing ferret retina. J Neurosci. 2003;23:7343–7350. doi: 10.1523/JNEUROSCI.23-19-07343.2003. [DOI] [PMC free article] [PubMed] [Google Scholar]
- Linden DC, Guillery RW, Cucchiaro J. The dorsal lateral geniculate nucleus of the normal ferret and its postnatal development. J Comp Neurol. 1981;203:189–211. doi: 10.1002/cne.902030204. [DOI] [PubMed] [Google Scholar]
- Ling C, Schneider GE, Jhaveri S. Target-specific morphology of retinal axon arbors in the adult hamster. Vis Neurosci. 1998;15:559–579. doi: 10.1017/s0952523898153178. [DOI] [PubMed] [Google Scholar]
- Mize RR, Spencer RF, Horner LH. Quantitative comparison of retinal synapses in the dorsal and ventral (parvicellular) C laminae of the cat dorsal lateral geniculate nucleus. J Comp Neurol. 1986;248:57–73. doi: 10.1002/cne.902480105. [DOI] [PubMed] [Google Scholar]
- Morgan J, Thompson ID. The segregation of ON- and OFFcenter responses in the lateral geniculate nucleus of normal and monocularly enucleated ferrets. Vis Neurosci. 1993;10:303–311. doi: 10.1017/s0952523800003709. [DOI] [PubMed] [Google Scholar]
- Muir-Robinson G, Hwang BJ, Feller MB. Retinogeniculate axons undergo eye-specific segregation in the absence of eye-specific layers. J Neurosci. 2002;22:5259–5264. doi: 10.1523/JNEUROSCI.22-13-05259.2002. [DOI] [PMC free article] [PubMed] [Google Scholar]
- Myhr KL, Lukasiewicz PD, Wong RO. Mechanisms underlying developmental changes in the firing patterns of ON and OFF retinal ganglion cells during refinement of their central projections. J Neurosci. 2001;21:8664–8671. doi: 10.1523/JNEUROSCI.21-21-08664.2001. [DOI] [PMC free article] [PubMed] [Google Scholar]
- Nakamura H, Wu R, Onozuka M, Itoh K. Ventral lateral geniculate nucleus projects to the dorsal lateral geniculate nucleus in the cat. Neuroreport. 2005;16:1575–1578. doi: 10.1097/01.wnr.0000180147.22139.6f. [DOI] [PubMed] [Google Scholar]
- Ohshiro T, Weliky M. Simple fall-off pattern of correlated neural activity in the developing lateral geniculate nucleus. Nat Neurosci. 2006;9:1541–1548. doi: 10.1038/nn1799. [DOI] [PubMed] [Google Scholar]
- Penn AA, Riquelme PA, Feller MB, Shatz CJ. Competition in retinogeniculate patterning driven by spontaneous activity. Science. 1998;279:2108–2112. doi: 10.1126/science.279.5359.2108. [DOI] [PubMed] [Google Scholar]
- Rasband W. ImageJ. Bethesda, Maryland: National Institutes of Health; 1997. Available at: http://rab.info.nih.gov/ig, 2005. [Google Scholar]
- Robson JA, Geisert EE., Jr Expression of a keratin sulfate proteoglycan during development of the dorsal lateral geniculate nucleus in the ferret. J Comp Neurol. 1994;340:349–360. doi: 10.1002/cne.903400306. [DOI] [PubMed] [Google Scholar]
- Roe AW, Garraghty PE, Sur M. Terminal arbors of single ON-center and OFF-center X and Y retinal ganglion cell axons within the ferret’s lateral geniculate nucleus. J Comp Neurol. 1989;288:208–242. doi: 10.1002/cne.902880203. [DOI] [PubMed] [Google Scholar]
- Sanderson KJ. Lamination of the dorsal lateral geniculate nucleus in carnivores of the weasel (Mustelidae), raccoon (Procyonidae) and fox (Canidae) families. J Comp Neurol. 1974;153:238–266. doi: 10.1002/cne.901530303. [DOI] [PubMed] [Google Scholar]
- Shatz CJ, Kirkwood PA. Prenatal development of functional connections in the cat’s retinogeniculate pathway. J Neurosci. 1984;4:1378–1397. doi: 10.1523/JNEUROSCI.04-05-01378.1984. [DOI] [PMC free article] [PubMed] [Google Scholar]
- Stellwagen D, Shatz CJ. An instructive role for retinal waves in the development of retinogeniculate connectivity. Neuron. 2002;33:357–367. doi: 10.1016/s0896-6273(02)00577-9. [DOI] [PubMed] [Google Scholar]
- Stryker MP, Zahs KR. On and off sublaminae in the lateral geniculate nucleus of the ferret. J Neurosci. 1983;3:1943–1951. doi: 10.1523/JNEUROSCI.03-10-01943.1983. [DOI] [PMC free article] [PubMed] [Google Scholar]
- Tavazoie SF, Reid RC. Diverse receptive fields in the lateral geniculate nucleus during thalamocortical development. Nat Neurosci. 2000;3:608–616. doi: 10.1038/75786. [DOI] [PubMed] [Google Scholar]
- Thevanaz P, Ruttimann U, Unser M. A pyramid approach to subpixel registration based on intensity. IEEE Trans Image Process. 1998;7:27–41. doi: 10.1109/83.650848. [DOI] [PubMed] [Google Scholar]
- Thompson ID, Morgan JE, Henderson Z. The effects of monocular enucleation on ganglion cell number and terminal distribution in the ferret’s retinal pathway. Eur J Neurosci. 1993;5:357–367. doi: 10.1111/j.1460-9568.1993.tb00503.x. [DOI] [PubMed] [Google Scholar]
- Torborg CL, Feller MB. Unbiased analysis of bulk axonal segregation patterns. J Neurosci Methods. 2004;135:17–26. doi: 10.1016/j.jneumeth.2003.11.019. [DOI] [PubMed] [Google Scholar]
- Torborg CL, Feller MB. Spontaneous patterned retinal activity and the refinement of retinal projections. Prog Neurobiol. 2005;76:213–235. doi: 10.1016/j.pneurobio.2005.09.002. [DOI] [PubMed] [Google Scholar]
- Torborg CL, Hansen KA, Feller MB. High frequency, synchronized bursting drives eye-specific segregation of retinogeniculate projections. Nat Neurosci. 2005;8:72–78. doi: 10.1038/nn1376. [DOI] [PMC free article] [PubMed] [Google Scholar]
- Torrealba F, Partlow GD, Guillery RW. Organization of the projection from the superior colliculus to the dorsal lateral geniculate nucleus of the cat. Neuroscience. 1981;6:1341–1360. doi: 10.1016/0306-4522(81)90192-5. [DOI] [PubMed] [Google Scholar]
- Treece GM, Prager RW, Gee AH. Regularized marching tetrahedra: improved iso-surface extraction. Comput Graph. 1999;23:583–598. [Google Scholar]
- Weliky M. Recording and manipulating the in vivo correlational structure of neuronal activity during visual cortical development. J Neurobiol. 1999;41:25–32. doi: 10.1002/(sici)1097-4695(199910)41:1<25::aid-neu5>3.0.co;2-#. [DOI] [PubMed] [Google Scholar]
- Weliky M, Katz LC. Correlational structure of spontaneous neuronal activity in the developing lateral geniculate nucleus in vivo. Science. 1999;285:599–604. doi: 10.1126/science.285.5427.599. [DOI] [PubMed] [Google Scholar]
- Williams AL, Jeffery G. Growth dynamics of the developing lateral geniculate nucleus. J Comp Neurol. 2001;430:332–342. [PubMed] [Google Scholar]
- Williams AL, Reese BE, Jeffery G. Role of retinal afferents in regulating growth and shape of the lateral geniculate nucleus. J Comp Neurol. 2002;445:269–277. doi: 10.1002/cne.10171. [DOI] [PubMed] [Google Scholar]
- Wilson PD, Stone J. Evidence of W-cell input to the cat’s visual cortex via the C laminae of the lateral geniculate nucleus. Brain Res. 1975;92:472–478. doi: 10.1016/0006-8993(75)90333-9. [DOI] [PubMed] [Google Scholar]
- Wilson PD, Rowe MH, Stone J. Properties of relay cells in cat’s lateral geniculate nucleus: a comparison of W-cells with X and Y-cells. J Neurophysiol. 1976;39:1193–1209. doi: 10.1152/jn.1976.39.6.1193. [DOI] [PubMed] [Google Scholar]
- Wong RO, Oakley DM. Changing patterns of spontaneous bursting activity of on and off retinal ganglion cells during development. Neuron. 1996;16:1087–1095. doi: 10.1016/s0896-6273(00)80135-x. [DOI] [PubMed] [Google Scholar]
- Zahs KR, Stryker MP. The projection of the visual field onto the lateral geniculate nucleus of the ferret. J Comp Neurol. 1985;241:210–224. doi: 10.1002/cne.902410208. [DOI] [PubMed] [Google Scholar]
- Ziburkus J, Guido W. Loss of binocular responses and reduced retinal convergence during the period of retinogeniculate axon segregation. J Neurophysiol. 2006;96:2775–2784. doi: 10.1152/jn.01321.2004. [DOI] [PubMed] [Google Scholar]
Associated Data
This section collects any data citations, data availability statements, or supplementary materials included in this article.


