

Abstract
Aminoglycosides enter inner ear hair cells via apical endocytosis, or mechanoelectrical transduction channels, implying that, in vivo, aminoglycosides enter hair cells from endolymph prior to exerting their cytotoxic effect. If so, circulating aminoglycosides likely cross the strial blood-labyrinth barrier and enter marginal cells prior to clearance into endolymph. We characterized the competitive antagonism of unconjugated aminoglycosides on the uptake of fluorescent gentamicin (GTTR) in the stria vascularis and kidney cells at an early time point.
In mice, uptake of GTTR by kidney proximal tubule cells was competitively antagonized by gentamicin at all doses, but only weakly by kanamycin (mimicking in vitro data). GTTR fluorescence was ~100-fold greater in proximal tubule cells than in the stria vascularis. Furthermore, only high molar ratios of aminoglycosides significantly reduced strial uptake of GTTR. Thus, gentamicin antagonism of GTTR uptake is more efficacious in proximal tubules than in the stria vascularis.
Competitive antagonism of GTTR uptake is indicative of specific cell-regulatable uptake mechanisms (e.g., ion channels, transporters) in the kidney. Strial uptake mechanisms have lower specific affinity for gentamicin, and/or density (compared to the kidney), yet may be critical to transport gentamicin across the strial blood-labyrinth barrier into marginal cells.
Keywords: blood-labyrinth barrier, ototoxicity, gentamicin, kanamycin, cochlea, stria vascularis
INTRODUCTION
Recent experimental studies suggest that, in vivo, systemically-administered aminoglycosides enter cochlear hair cells from endolymph prior to inducing auditory dysfunction (Aran et al., 1999; Gale et al., 2001; Goodyear et al., 2008; Hashino and Shero, 1995; Marcotti et al., 2005; Takada et al., 1985). However, the mechanisms by which systemically-administered aminoglycosides traverse the blood-labyrinth barrier (BLB) and enter endolymph remain undetermined. There are two routes by which systemically-administered aminoglycosides could enter endolymph: (i) a trans-strial trafficking route from strial capillaries to marginal cells, followed by clearance into endolymph (Fig. 1, route 2); or (ii) by traversing the BLB into perilymph and thence into endolymph via (a) transcytosis across the epithelial perilymph/endolymph barrier (Fig. 1, route 4), or (b) trafficking of aminoglycosides from the perilymph domain via fibrocytes to the stria vascularis, and trans-strial trafficking to marginal cells and clearance into endolymph (Fig. 1, route 5). In each of these trafficking routes, the positive endolymphatic potential (EP; +80 mV) must be overcome prior to entry of cationic aminoglycosides into endolymph, presumptively by active trafficking (Dai and Steyger, 2008). Once in endolymph, the +80 mV EP will electrophoretically drive aminoglycosides into the nearest available negative sink, most likely hair cells (Fig. 1, route 1) via open mechanotransduction channels (Marcotti et al., 2005; Takada et al., 1985). Alternatively, aminoglycosides in the scala tympani could pass through the basilar membrane into extracellular fluids within the organ of Corti (and spaces of Nuel surrounding the outer hair cells), and from there enter hair cells by traversing their basolateral membranes (Fig. 1, route 6).
Figure 1. Potential aminoglycoside trafficking pathways within the cochlea.

(1) Aminoglycosides are known to enter hair cells via apical endocytosis or permeation of the mechanotransduction channels on the apical surface of hair cells, and presumably from endolymph in vivo. (2) Systemically-administered aminoglycosides could enter the positively charged endolymph (+80 mV) via a trans-strial trafficking route from strial capillaries to marginal cells, followed by clearance into endolymph; or (3) by traversing the blood-labyrinth barrier into perilymph and thence (4) into endolymph via transcytosis across the epithelial perilymph/endolymph barrier, or (5) trafficking of aminoglycosides from the perilymph domain via gap junctions in fibrocytes to the stria vascularis, and trans-strial trafficking to marginal cells and clearance into endolymph. Alternatively, (6) aminoglycosides in the perilymph of the scala tympani may enter hair cell directly across their basolateral membranes. Diagram is not to scale).
We have recently described the distribution of a fluorescently-tagged aminoglycoside – gentamicin-Texas Red (GTTR) – in the cochleae of C57BL/6 mice, and postulated the presence of a gentamicin trafficking route across the stria vascularis (Dai et al., 2006; Dai and Steyger, 2008; Wang and Steyger, 2009). However, C57BL/6 mice are susceptible to catatonia and fatal systemic toxicity at high doses (Wu et al., 2001). Therefore, to better determine if saturable, cell-regulated cytoplasmic trafficking of gentamicin exists in the stria vascularis, we used a shorter 30 minute exposure to maximize unconjugated aminoglycoside antagonism prior to fixation and examination. In addition, we also used unconjugated kanamycin as a systemic competing agent for GTTR entry into kidney proximal tubules and stria vasculari of mice, due to its lack of systemic toxicity in mice (Wu et al., 2001).
The results show that 30 minutes after intra-peritoneal injection: (i) increasing doses of gentamicin monotonically inhibited GTTR uptake into proximal tubule cells, and (ii) only high molar ratios of gentamicin significantly inhibited GTTR entry into the stria vascularis. (iii) Only high molar ratios of kanamycin significantly reduced GTTR uptake into proximal tubule cells, or the stria vascularis. (iv) In addition, proximal tubule uptake of GTTR is much greater than in the stria, reflecting different pharmacokinetic or uptake capacities in the two tissues. Analysis of the data suggests that the putative gentamicin transport mechanism(s) within the stria vascularis operates with low affinity for gentamicin.
METHODS
Conjugation and purification of GTTR
An excess of gentamicin (GT) in 0.1 M potassium carbonate solution (pH 10) was mixed with Texas Red (TR) succinimidyl esters (Invitrogen, CA) to minimize the possibility of over-labeling individual gentamicin molecules with more than one TR molecule, and to preserve the polycationic nature of the conjugate, as previously described (Sandoval et al., 1998). After conjugation, reversed phase chromatography, using C-18 columns (Burdick and Jackson, Muskegon, MI), was used to purify the conjugate gentamicin-Texas Red (GTTR) from unconjugated aminoglycosides, and potential contamination by unreacted TR (Myrdal et al., 2005). The purified GTTR conjugate was aliquoted, lyophilized, and stored desiccated, in the dark at −20°C until required.
Cell culture
As in previous studies (Myrdal and Steyger, 2005; Myrdal et al., 2005), Madin-Darby canine kidney distal tubule (MDCK) cells were cultured in antibiotic and phenol red-free Dulbecco’s minimal essential medium (MEMα, Invitrogen, CA) with 10% fetal bovine serum (FBS) at 37°C with 5% CO2, 95% air. For experiments, cells were seeded into 8-well coverglass chambers (ISC BioExpress) and allowed to proliferate until they had become subconfluent, columnar in appearance and developed tight junctions. Cells were washed 3 times with phosphate-buffered saline (containing 1.25 mM calcium), and treated with 5 μg/ml GTTR alone, or with a dose range of unconjugated gentamicin or kanamycin (50–5000 μg/ml) for 30 seconds at 20°C (precluding endocytosis). Following treatment, cells were rinsed three times with buffer then fixed and delipidated with 4% formaldehyde plus 0.5% Triton X-100 (FATX) for 45 minutes. Following fixation, cells were thoroughly rinsed with phosphate buffered saline (PBS, Invitrogen, CA) prior to imaging.
Mice
For in vivo competition studies, control mice (C57/BL6; 21–28 days old) received one intra-peritoneal (i.p.) injection of 2 mg/kg GTTR (gentamicin base in PBS, pH7.4). For competition studies, mice (n ≥ 3 per dose level) were simultaneously dosed with: (i) GTTR plus 2, 20, 200, 600 or 800 mg/kg gentamicin (in PBS, pH7.4); or (iii) GTTR plus 200, 800 or 1000 mg/kg kanamycin (in PBS, pH7.4). Control mice dosed with the molar equivalent of hydrolyzed Texas Red alone, exhibited negligible TR uptake or fluorescence in kidney or cochlear tissues (data not shown), as reported previously (Wang and Steyger, 2009).
After 30 minutes, all mice were anesthetized, and serum collected prior to cardiac perfusion with PBS, then 4% formaldehyde. Kidneys were vibrotome-sectioned at 100 μm. Cochleae and kidneys were excised and post-fixed in FATX, washed, labeled with Alexa-488-conjugated phalloidin, rinsed, and post-fixed with 4% formaldehyde (Myrdal et al., 2005). Serum levels of GTTR and gentamicin were determined using standard diagnostic particle-enhanced turbidimetric inhibition immunoassay methods (Newman et al., 1992) on a Beckman Synchron Drug Calibrator 3 Plus, with a sensitivity of 0.5 μg/ml. All procedures were approved by the Institutional Animal Care and Use Committee of Oregon Health & Science University.
Imaging
All specimens were mounted on slides, immersed in VectaShield (Vector Labs, CA), coverslipped, and examined using a Bio-Rad MRC 1024 ES laser scanning confocal system attached to a Nikon Eclipse TE300 inverted microscope. Alexa-488 and Texas Red images were collected sequentially at 1024×1024 pixel box size using a 60× lens (n.a. 1.4). For image acquisition, the confocal settings (i.e., laser setting and pinhole size) to obtain the greatest dynamic range of fluorescence intensity, limiting the number of saturated pixels ~1%, were set for the standard (GTTR only) group for each region of interest (ROI): MDCK cells, stria vascularis, and renal cortex (proximal tubules). Subsequently, all specimens for each ROI, including control tissues, were imaged at the same laser intensity and gain settings as the standard (GTTR only) group. Each dose (n ≥ 3) was imaged at the same confocal acquisition session as the standard (GTTR only) group, against which ratiometric image analysis was conducted (see below). Representative images from each experiment were identically prepared for publication using Adobe Photoshop.
Image analysis
For image analysis, optical sections from each experimental set were identified, and cytoplasmic regions from individual cell types (e.g., marginal cells [minus nuclei], intra-strial tissues [putatively intermediate cells]) were manually segmented for pixel intensity determination following background subtraction (ImageJ, NIH). To normalize data between experimental sets, the mean intensity of each dose group was ratioed against the standard (mean intensity of the GTTR-only) group ROI and plotted. Student’s t-test was used to determine any significant difference between dosing groups or cell types within a ROI.
Estimating excitation laser power
To determine the fold difference in excitation intensity for the actual pinhole size settings used, the laser power needed to give images of equal mean pixel intensity for a stable fluorophore, yellow fluorescent plastic (Chroma, VT) at different pinhole settings using the 60× lens, was measured using a laser power meter (ThorLabs PM-100 with a 200–1100nm sensor). To determine the fold difference in excitation intensity for the actual laser settings used, the laser power at the stage was also measured using a laser power meter. The product of the two factors obtained will approximate the fold difference in excitation intensity.
RESULTS
Competitive inhibition of GTTR uptake in vitro
We first verified that uptake of Texas Red-tagged gentamicin (GTTR) by MDCK cells could be competitively inhibited by an unconjugated aminoglycoside, i.e., gentamicin or kanamycin. The cellular distribution of GTTR in MDCK cells after a 30 second exposure was the same as previously described (Myrdal and Steyger, 2005). GTTR fluorescence was diffusely distributed throughout the cytoplasm and associated with intra-nuclear structures (Fig 2A, F) previously identified as RNA-containing nucleoli (Myrdal et al., 2005). GTTR fluorescence in MDCK cells was significantly inhibited (p <0.005) by unconjugated gentamicin at all molar ratios tested (Fig. 2B-E). Inhibition of GTTR fluorescence by increasing concentrations of kanamycin was less effective, with a statistical drop in GTTR fluorescence occurring only at the highest dose of kanamycin co-administration (1000:1 kanamycin:GTTR, p <0.05; Fig. 2I, J).
Figure 2. Unconjugated gentamicin, but not kanamycin, efficaciously decreases GTTR fluorescence in MDCK cells.
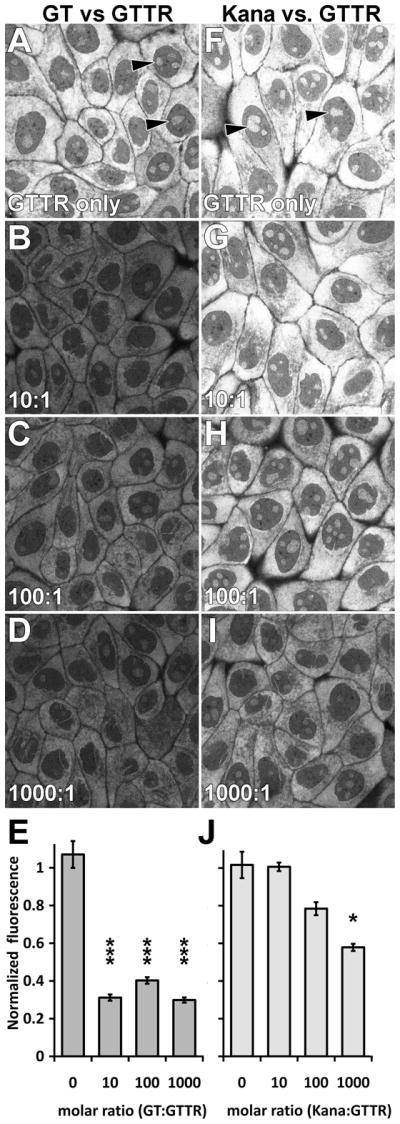
After a 30 second exposure to GTTR prior to fixation, GTTR fluorescence was diffusely distributed throughout the cytoplasm and associated with intra-nuclear structures (▶). (A-E) Increasing molar ratios of gentamicin:GTTR (>10:1) significantly decreased GTTR fluorescence (*** = p<0.005; error bars = standard error of the mean [s.e.m.]). (F-J) Increasing molar ratios of kanamycin:GTTR were less effective in reducing GTTR fluorescence in MDCK cells, with a statistical drop in GTTR fluorescence occurring only at the highest dose of kanamycin:GTTR (1000:1; * = p <0.05; error bars = s.e.m.). Images acquired and post-processed identically.
Serum kinetics of GTTR
Thirty minutes following i.p. injection of GTTR alone, serum levels of the gentamicin epitope, detected by turbidimetric inhibition immunoassay (Newman et al., 1992), reached 3.1 ± 0.48 μg/ml (n=12, ±s.e.m.). GTTR cannot be distinguished from native gentamicin (Wang and Steyger, 2009). Thus, when GTTR was co-administered with unconjugated gentamicin, serum levels of the gentamicin epitope increased proportionally with increasing gentamicin dose (GT:GTTR: 10:1, 22.3±1.4 μg/ml; 100:1 209.3 ± 18.7 μg/ml; 400:1 596 ± 104 μg/ml; n≥3 per dose ± s.e.m). When GTTR was co-administered with increasing doses of kanamycin, GTTR levels in serum were relatively constant at 4.39 ± 0.38 μg/ml (n=12, ±s.e.m.), ~ 40% higher than serum GTTR levels without unconjugated aminoglycoside co-administration.
Competitive antagonism of strial GTTR uptake in vivo
To verify that GTTR uptake in vivo is competitively antagonized by unconjugated gentamicin, we dosed mice receiving GTTR (2 mg/kg gentamicin base) with increasing doses of unlabeled gentamicin (20, 200, 600 and 800 mg/kg) for 30 minutes prior to cardiac perfusion and fixation. All animals maintained a robust heart beat until termination of the experiment. Animals treated with GTTR alone for 30 minutes displayed the same distribution of GTTR fluorescence within the stria vascularis as described previously (Wang and Steyger, 2009). Briefly, strong GTTR fluorescence was observed within the marginal cells (Fig. 3A), with reduced fluorescence in the intra-strial tissues (putatively the intermediate cells and intra-strial space; p < 0.005, n =8; Fig. 3E). Greatly reduced GTTR fluorescence was observed in the basal cells and spiral ligament (fibrocytes; data not shown) as reported previously (Wang and Steyger, 2009).
Figure 3. Competitive inhibition of GTTR uptake by gentamicin in murine stria vasculari.
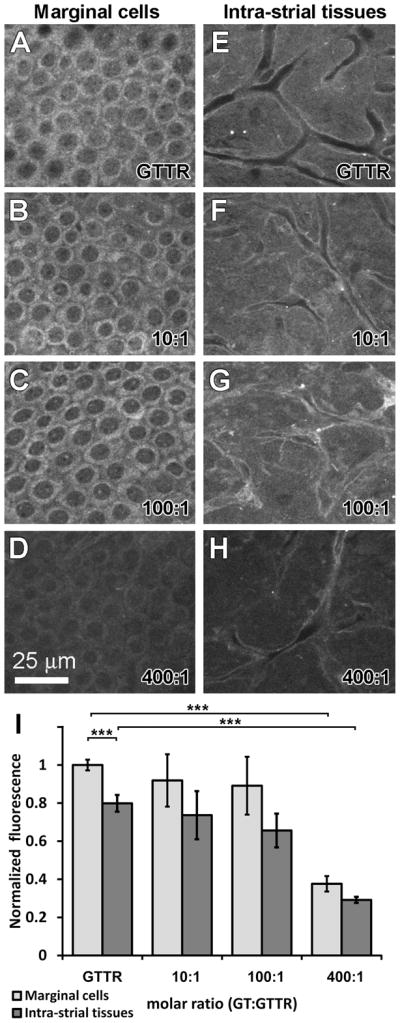
Animals treated with 2 mg/kg GTTR alone for 30 minutes displayed GTTR fluorescence most intensely in marginal cells (A), with significantly weaker fluorescence in the intra-strial tissues (E, I; *** = p<0.05; error bars = s.e.m.). Co-administration of GTTR with unconjugated gentamicin at 10:1 (B, F) and 100:1 (C, G) molar dilutions of gentamicin:GTTR did not significantly (p >0.25) affect the distribution or intensity of GTTR fluorescence within the marginal cells or intra-strial tissues. (D, H, I) 400:1 molar ratios of gentamicin:GTTR significantly decreased the intensity of GTTR fluorescence in marginal cells and intra-strial tissues (*** = p<0.005; error bars = s.e.m.). All tissues from basal coil of cochlea. Images acquired and post-processed identically.
Co-administration of unconjugated gentamicin with GTTR at 10:1 and 100:1 molar dilutions did not significantly (p >0.25) affect the distribution or intensity of GTTR fluorescence within the marginal cells or intra-strial tissues of the stria vascularis (Fig. 3B, C, F, G). Only high molar ratios of gentamicin:GTTR (300:1, not shown, and 400:1 Fig 3D, H, I) significantly decreased the intensity of GTTR fluorescence in marginal cells and intra-strial tissues compared to GTTR alone fluorescence intensities (p <0.005).
To assess whether strial uptake of GTTR is antagonized by unconjugated kanamycin, we dosed mice receiving GTTR (2 mg/kg gentamicin base) with increasing doses of unlabeled kanamycin (200, 800 and 1000 mg/kg) for 30 minutes prior to fixation. Co-administration with a 100:1 molar dilution of kanamycin:GTTR did not significantly alter the distribution or intensity of GTTR fluorescence in marginal cells or intra-strial tissues of the stria vascularis compared to GTTR-only animals (p >0.45; n=4; Fig. 4B, F, I). Only high molar ratios of kanamycin to GTTR (400:1 and 500:1) resulted in a statistically significant decrease in the intensity of GTTR fluorescence in marginal cells and intra-strial tissues (p <0.05; n=4 per group; Fig. 4C, D, G, H, I).
Figure 4. Competitive inhibition of GTTR uptake by kanamycin in murine stria vasculari.
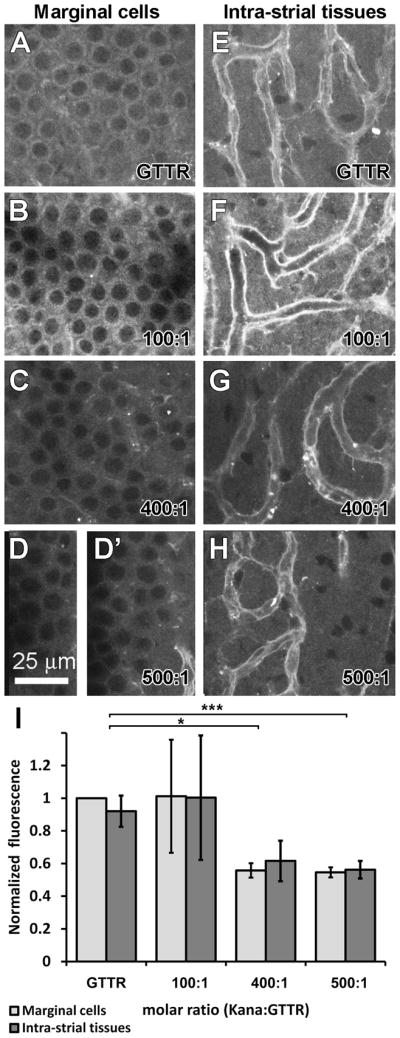
Animals treated with 2 mg/kg GTTR alone for 30 minutes displayed GTTR fluorescence in marginal cells (A), and in the intra-strial tissues (E), with the most intense fluorescence in endothelial cells lining the strial capillaries (E). Co-administration of GTTR with 100:1 molar dilutions of kanamycin:GTTR did not significantly affect the distribution or intensity of GTTR fluorescence within the marginal cells or intra-strial tissues (B, F, I; p >0.05; error bars = s.e.m.). Higher molar ratios of kanamycin:GTTR (400:1, C, G; and 500:1, D, D′, H, I) significantly decreased the intensity of GTTR fluorescence in marginal cells and intra-strial tissues (* = p<0.05; *** = p<0.005, error bars = s.e.m.). All tissues from basal coil of cochlea. Images acquired and post-processed identically.
Competitive antagonism of renal GTTR uptake in vivo
For comparison, GTTR fluorescence in kidney tissues from the same animals were also examined. Administration of GTTR alone revealed both cytoplasmic and intense punctate fluorescence in proximal tubule cells, with weak diffuse cytoplasmic fluorescence in distal tubule cells (Fig. 5A). Animals simultaneously dosed with GTTR and increasing molar ratios of unconjugated gentamicin displayed monotonic and statistically significant reductions in cytoplasmic GTTR fluorescence in proximal tubule cells compared to the GTTR-only treated animals (p <0.005 for all doses; Fig. 5B-E). The intensity of GTTR fluorescence at the brush border membranes of proximal tubule cells was qualitatively diminished with gentamicin administration. Punctate GTTR fluorescence in proximal tubule cells also appeared to diminish in intensity at higher molar ratios of GT (>100:1 gentamicin:GTTR), suggestive of reduced endosomal uptake of GTTR near the apical brush border membranes (Fig. 5C, D).
Figure 5. Inhibition of renal uptake of GTTR is more efficacious with gentamicin than kanamycin.
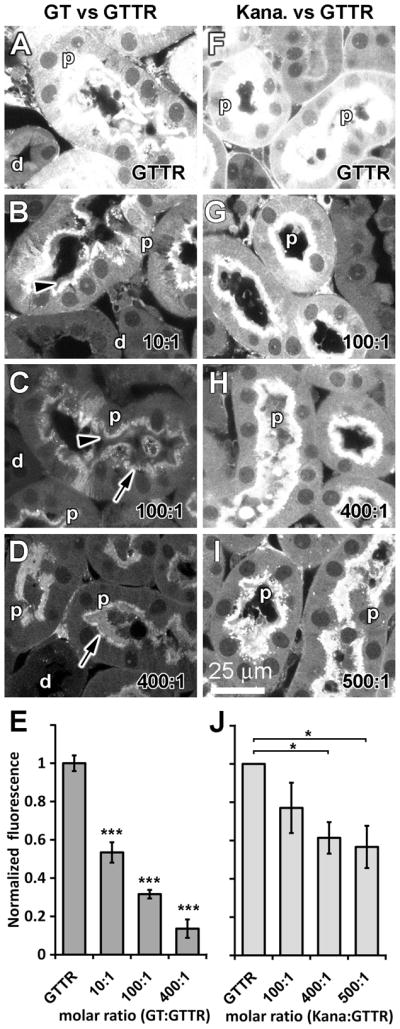
(A, F) Intra-peritoneal injection of GTTR alone for 30 minutes resulted in cytoplasmic and intense punctate fluorescence in proximal tubule cells (p), with weaker diffuse cytoplasmic fluorescence in distal tubule cells (d). (B-E) Simultaneous injection of unconjugated gentamicin with GTTR significantly reduced cytoplasmic GTTR fluorescence in proximal (and distal tubule cells) proportional to the increased dose of gentamicin (*** = p<0.005; error bars = s.e.m.). GTTR fluorescence at the brush border (▶) of, and punctate GTTR fluorescence in, proximal tubule cells appeared diminished in intensity with increasing molar ratios of gentamicin:GTTR (>10:1). (G-J) Animals simultaneously dosed with kanamycin revealed only a small significant decrease in cytoplasmic (or punctate) GTTR fluorescence intensity in proximal tubule cells at very high kanamycin:GTTR molar ratios (>400:1; H, I, J; * = p<0.05; error bars = s.e.m.). Images acquired and post-processed identically.
When animals were simultaneously dosed with GTTR and kanamycin, only a small, statistically insignificant reduction in cytoplasmic GTTR fluorescence was observed in proximal tubule cells at the lowest dose of kanamycin co-administration (100:1; p >0.1; Fig. 5F). Animals simultaneously dosed with high molar ratios of kanamycin:GTTR displayed significantly greater reductions in cytoplasmic GTTR fluorescence in proximal tubule cells (400:1 and 500:1 p <0.05; Fig. 5G, H). GTTR fluorescence at the brush border membranes of proximal tubule cells was qualitatively diminished only at very high kanamycin:GTTR molar ratios (>400:1). Punctate GTTR fluorescence in proximal tubule cells also appeared to diminish in intensity only at high molar ratios of kanamycin, suggestive of reduced uptake of GTTR in endosomes near the apical brush border.
Relative fluorescence intensity of kidney and strial tissues
Subjectively, kidney tissues displayed more intense GTTR fluorescence than strial tissues. For image acquisition of kidney proximal tubules, the confocal settings (i.e., laser setting and pinhole size) to obtain the greatest dynamic range of fluorescence intensity, limiting the number of saturated pixels ~1%, were much lower than for strial tissues. To quantify these differences, we obtained fluorescence intensity isopleths (contour lines; Fig. 6) for MDCK cells exposed to two different concentrations of GTTR, 5 and 0.5 μg/mL. Each isopleth indicates the pinhole size and laser power settings required to reach a desired image intensity. MDCK cells treated with 5 μg/mL GTTR were intensely fluorescent, and required lower laser power and pinhole sizes compared to 0.5 μg/mL-treated MDCK cells that had less GTTR uptake and consequently weaker fluorescence. In Figure 6, typical confocal settings for proximal tubule or strial tissues were also plotted, and demonstrate that the two tissues contain widely differing amounts of fluorescence beyond the dynamic range of the confocal system to record fluorescence using identical acquisition settings for both tissues.
Figure 6. Relative GTTR fluorescence in proximal tubule and marginal cells.

Fluorescence intensity isopleths (contour lines) for MDCK cells exposed to either 5 and 0.5 μg/mL GTTR for 30 seconds at room temperature. Each isopleth indicates the pinhole size and laser power settings required to reach a mean pixel intensity. The lower isopleth reflects the pinhole setting (x-axis) and laser power (y-axis) required to give a mean pixel intensity of MDCK cells treated with 5 μg/mL. The upper isopleths reflects the confocal settings required MDCK cells treated with 0.5 μg/mL. Typical confocal settings for kidney or strial tissues are also plotted.
The difference in the fluorescence emission of proximal tubules and the stria vascularis was estimated from the change in excitation laser power required to produce an equivalently bright image of a stable fluorophore, yellow fluorescent plastic. With the pinhole diameter at 3.5, a laser power of 13% (measured power 37 microwatts) produced a mean image (pixel) intensity of 76. When the pinhole was reduced 1.8, 62% (493 microwatts) laser power was required to obtain a mean image intensity of 76, a 13.2-fold difference. This pinhole factor was multiplied by the fold difference in excitation power of the laser settings used. For kidney tissues, a 12% laser setting corresponds to 33 microwatts, while the stria was excited by a laser setting of 40%, or 288 microwatts; a 8.7-fold difference. Multiplying the two factors (13.2 × 8.7) gives ~115-fold difference in fluorescence between the two tissues, indicating substantially greater in vivo uptake of GTTR by proximal tubule cells across their lumenal membrane, compared to trans-endothelial trafficking of GTTR into strial tissues.
Modeling aminoglycoside antagonism of GTTR uptake
In all experiments, the dose of GTTR was constant at 2 mg/kg, while the dose of either unconjugated aminoglycoside, the presumed competitive ligand, was varied (e.g., molar ratios of 10:1, 100:1, 400:1 of aminoglycoside:GTTR). The cytoplasmic fluorescence intensity in cells was obtained from single confocal optical planes for each dose, and normalized against GTTR-only intensity for comparison across data sets. These normalized data were fitted to the Gaddum equation (law of mass action), the standard for analyzing reversible and surmountable dose-response curves with competitive antagonism (Kenakin, 2008; Neubig et al., 2003). Here, we assumed that the intensity of cytoplasmic fluorescence is proportional to level of GTTR uptake that can be antagonized by aminoglycosides. Therefore, using a simplified Gaddum equation:
| (1) |
where KGTTR and KGT are the equilibrium dissociation constants for GTTR and the antagonist, gentamicin (GT), respectively, obtained by a non-linear, least squares fit (R [statistical analysis software]; Table 1). The constants are estimates of the concentrations at which 50% occupancy in the uptake mechanism(s) occurs, which are different for the two ligands and the two tissues. Nonlinear regression of gentamicin antagonism of normalized GTTR fluorescence in vivo was used to obtain values for KGTTR and KGT (Table 1) and the curvefits shown in Figure 7A. The curvefit for marginal cells (or intra-strial tissues, not shown) is displaced to the right corresponding to the higher concentrations of gentamicin required to antagonize GTTR uptake.
Table 1. Derived equilibrium dissociation constants for GTTR and gentamicin.
Values obtained from a nonlinear fit of the Gaddum equation at respective concentrations to the normalized fluorescence.
| Equilibrium dissociation constants (Kd) | proximal tubules | marginal cells |
|---|---|---|
| Gentamicin antagonism of GTTR uptake in vivo | ||
| KGTTR | 0.25 mg/kg | 0.18 mg/kg |
| KGT | 9.1 mg/kg | 68.7 mg/kg |
| ID50 for gentamicin | 82 mg/kg | 832 mg/kg |
| Kanamycin antagonism of GTTR uptake in vivo | proximal tubules | marginal cells |
| KGTTR | 0.08 mg/kg | 0.09 mg/kg |
| KKM | 51.1 mg/kg | 70.9 mg/kg |
| ID50 for kanamycin | 1330 mg/kg | 1377 mg/kg |
| Antagonism of GTTR uptake in MDCK cells in vitro | MDCK cells | |
| KGTTR | 0.28 μg/ml | |
| KGT | 1.79 μg/ml | |
| KKM | 197 μg/ml | |
| IC50 for gentamicin | 30 μg/ml | |
| IC50 for kanamycin | 6519 μg/ml |
Figure 7. Gentamicin antagonism of GTTR uptake is different in kidney and strial tissues.

(A) Normalized data for gentamicin antagonism of GTTR fluorescence in vivo were fitted to the Gaddum equation (Eq. 1) by a non-linear, least squares fit. The curvefit for marginal cells is displaced to the right of the curvefit for proximal tubules, corresponding to the higher concentrations of gentamicin required to reduce GTTR fluorescence. (B) Normalized data for kanamycin antagonism of GTTR fluorescence in vivo were fitted to the Gaddum equation by a non-linear, least squares fit. The curvefit for marginal cells is similar to proximal tubules. (C) Normalized data for aminoglycoside antagonism of GTTR fluorescence in MDCK cells in vitro were fitted to the Gaddum equation by a non-linear, least squares fit. The curvefits were responsive to increasing gentamicin, but not kanamycin, concentrations.
The gentamicin dose required for 50% inhibition of GTTR fluorescence in proximal tubule cells and strial tissues differs substantially. If gentamicin is a competitive antagonist of GTTR, then the inhibitory dose, ID50, can be calculated from KGT * (1 + ([GTTR]/KGTTR)), with dissociation constants obtained from the nonlinear curvefit of the data. The ID50 for the proximal tubule cells was 82 mg/kg, and that for marginal cells 832 mg/kg. In the stria vascularis, increasing gentamicin concentrations have a relatively reduced effect on GTTR fluorescence compared to proximal tubule cells where the effect is more pronounced. This corresponds to the normalized dose-fluorescence curve for proximal tubule cells approaching an asymptote at a lower molar ratio of gentamicin:GTTR compared to marginal cells (Fig. 7A).
Kanamycin antagonism of GTTR uptake in vivo was much reduced compared to gentamicin. Nonlinear regression of kanamycin antagonism of normalized GTTR fluorescence was used to obtain values for KGTTR and KKM (Table 1) and the curvefits shown in Figure 7B. The curvefit for marginal cells is relatively similar to that for proximal tubules, as were the ID50 for kanamycin in marginal cells, 1377 mg/kg, and proximal tubules, 1330 mg/kg.
Nonlinear regression of aminoglycoside antagonism of normalized GTTR fluorescence was also used for the in vitro data in Figure 2 to obtain the KGTTR, KGT and KKanamycin (KKM; Table 1) and the curvefits shown in Figure 7C. The curvefit for kanamycin is very different, and flat compared to that for gentamicin. The inhibitory concentration, IC50, for gentamicin (30 μgml) was also distinctly smaller than for kanamycin (6519 μg/ml).
DISCUSSION
We recently hypothesized that aminoglycosides employ a trans-strial trafficking route to enter endolymph prior to entering hair cells (Dai and Steyger, 2008; Steyger and Karasawa, 2008). Mice systemically dosed with increasing molar ratios of gentamicin:GTTR showed a decrease in GTTR fluorescence in proximal tubule cells and marginal cells, suggestive of competitive antagonism (Dai and Steyger, 2008). However, in that study, animals dosed with high levels of gentamicin for 3 hours may have experienced early signs of systemic toxicity, as reported previously (Wu et al., 2001), confounding the data reported in that study. These studies used a 30-minute time point, and also an additional aminoglycoside, kanamycin, as a competing agent. All animals, including those dosed at high gentamicin levels, maintained a robust heart beat until termination of the experiment, indicating the absence of systemic toxicity. We observed that unconjugated gentamicin (and to a much lesser extent, kanamycin) reduced proximal tubule and strial uptake of GTTR.
Serum kinetics
Gentamicin and GTTR have different relative molecular masses (449–477 and ~1100, respectively) and different serum kinetics. Following i.p. injection, gentamicin had a serosal half-life of less than 56 minutes, while GTTR has a serosal half-life of 130 minutes (Wang and Steyger, 2009). The 30 minute time point ensured high levels of unconjugated aminoglycoside competition with GTTR in serum following absorption from the peritoneal cavity (see below). GTTR levels in the kanamycin-treated groups were higher than when GTTR was administered alone, suggestive of increased flux from the peritoneal cavity into serum, potentially decreasing the molar ratio and competitive antagonism between the kanamycin and GTTR. Alternatively, there may be reduced clearance of GTTR into cells and tissues due to kanamycin competition, thus maintaining higher serum levels of GTTR.
The absorption of aminoglycosides into serum from the peritoneal cavity is limited only by diffusion through a 3-dimensional matrix surrounding the highly vascular peritoneal wall that does not provide a barrier to solute or small molecule transport (Flessner, 2005; Jacquet and Sugarbaker, 1996). Absorption of aminoglycosides from the peritoneal cavity results in serum levels at approximately 65% of intra-venous administration levels, compared to 50% or less from intramuscular injections (Asheim et al., 2008; Magdesian et al., 1998; Orsini et al., 1985). Aminoglycoside absorption from the peritoneal cavity into serum is rapid and sustained (Ericsson et al., 1978; Van Way and Hasse, 1985), and, like intra-muscular-injections, avoids the initial peak associated with intra-venous administration.
GTTR entry into the stria vascularis and kidney
After systemic administration, GTTR fluorescence was preferentially associated with the stria vascularis compared to the spiral ligament, corroborating earlier studies using GTTR or other compounds (Cohen-Salmon et al., 2007; Koo and Balaban, 2006; Sakagami et al., 1982; Sakagami et al., 1987; Wang and Steyger, 2009). Quantitatively, cytoplasmic GTTR fluorescence intensity was significantly higher in marginal cells than in intra-strial tissues, as previously reported (Wang and Steyger, 2009). Strial capillaries, endothelial cells and surrounding extracellular matrices, were often more intensely labeled with GTTR, but were not easily segmented for quantification of GTTR intensity values. Negligible punctate (endosomal) GTTR fluorescence was observed in the stria vascularis in contrast to that seen in kidney proximal tubule cells.
In the kidney, GTTR fluorescence was most intensely localized in the proximal tubule brush border region, and in the adjacent apical cytoplasm, which typically contains a high density of endosomes. The cytoplasm of proximal tubule cells exhibited more intense GTTR fluorescence compared to distal tubule cells, as previously reported (Wang and Steyger, 2009).
The absolute intensity of GTTR fluorescence was always greater in proximal tubule cells, requiring an increase in both laser power and confocal iris size to detect GTTR in strial tissues (including strial endothelial cells). By calibrating the intensity differences for the confocal settings used, GTTR fluorescence intensity in proximal tubule cells was determined to be ~115-fold higher than in strial tissues. Thus, there is greater GTTR uptake by proximal tubule cells following glomerular filtration, compared to strial endothelial cells, and in intermediate or marginal cells following trans-endothelial trafficking from the strial capillary lumen. The absolute reduction in strial GTTR fluorescence likely reflects (i) reduced binding affinity for GTTR compared to proximal tubule cells, and/or (ii) a reduced density of (active or passive) GTTR uptake mechanisms in strial endothelial cells, and subsequent trafficking to intermediate and/or marginal cells. It is worth re-iterating that GTTR fluorescence in the stria vascularis is substantially more intense than in the spiral ligament (Dai and Steyger, 2008; Wang and Steyger, 2009), indicating that the BLB in the spiral ligament has an even lower affinity for GTTR, or density of GTTR uptake mechanisms, than the stria vascularis.
Gentamicin antagonism of GTTR uptake
Displacement binding is an established technique for quantifying the affinity of unlabeled ligands by calibrating the effect of unlabeled ligand concentration on the labeled ligand signal. For competitively interacting compounds, curvefit of the Gaddum equation to the data is used to determine the unlabeled compound dissociation constant. The Gaddum equation describes competitive antagonism between the compound and antagonists for binding sites when binding is reversible and surmountable (Kenakin, 2008; Neubig et al., 2003). The reversibility and surmountability conditions were partially satisfied, as earlier experiments show that increasing doses of GTTR for a given dose of gentamicin produced greater fluorescence in strial cells in vivo (Dai and Steyger, 2008), surmounting gentamicin antagonism. Trafficking of unconjugated aminoglycosides and GTTR across the plasma membrane is inherently reversible since the drug is released into the cytoplasm (Luk et al., 2010; Marcotti et al., 2005; Myrdal et al., 2005). In addition, these compounds are also cleared from strial tissues (Dai and Steyger, 2008; Hiel et al., 1992; Imamura and Adams, 2003; Wang and Steyger, 2009). However, reversible, competitive binding requires a demonstration of mutual exclusion which has not been shown. True reversibility can be demonstrated by a Schild plot of fluorescence values for a dose range of GTTR in the presence or absence of a constant dose of gentamicin (antagonist). It was necessary to first determine the dose for aminoglycoside antagonism of the uptake of purified GTTR (which was not available for the previous study). We predict that a Schild plot will show that higher doses of GTTR will surmount gentamicin antagonism, as qualitatively demonstrated in Figure 3 by Dai et al. (2008). Lower doses of GTTR, combined with gentamicin competition, will be challenging as fluorescence levels could fall below the detectable range for the stria vascularis, as in Dai et al. (2008); although useful data could be obtained from proximal tubule cells. These experiments are currently ongoing.
Our data show that gentamicin readily displaces GTTR in proximal tubule cells (and distal tubule cells) compared to kanamycin, but in the stria vascularis GTTR uptake is antagonized only at high aminoglycoside concentrations. Kanamycin was a poor antagonist of GTTR uptake in proximal tubules, strial cells and in vitro (see ID50 and IC50 for kanamycin in Table 1), indicating a lack of specificity in the GTTR uptake mechanism for kanamycin. Thus the following focuses on gentamicin antagonism of GTTR uptake. If gentamicin is a competitive antagonist of GTTR uptake, the intensity of cytoplasmic GTTR fluorescence will be inversely related to the degree of gentamicin antagonism. Nonlinear fitting of the Gaddum equation to the data produces equilibrium dissociation constants for GTTR, gentamicin and kanamycin (Table 1). In Figure 7A, the nonlinear curvefits of normalized fluorescence for the two cell types in vivo indicate that gentamicin readily antagonizes GTTR uptake by proximal tubule cells, but in marginal cells (and representative of intra-strial and strial endothelial cell data, data not shown for simplicity) GTTR uptake is antagonized only at high gentamicin concentrations. The strial curvefit is displaced to the right of the proximal tubule curvefit, since greater doses of gentamicin are required to reduce the normalized fluorescence by the same degree. This, together with the order of magnitude difference in the ID50 for the two cell types in vivo, likely indicates different pharmacokinetic and uptake mechanisms in proximal tubule and strial cells. Note that the normalized data and curvefits in Figure 7A does not incorporate the ~115-fold difference in fluorescence in the two tissues.
In this study, the difference in KGT for the two tissues is perhaps more relevant. In proximal tubule cells, increasing gentamicin concentrations substantially increase the antagonism of GTTR uptake in proximal tubules compared to the stria vascularis. In contrast, the antagonistic effect in strial cells is relatively flat with increasing concentration, reflecting little change in GTTR uptake until higher concentrations of gentamicin are reached. The pharmacokinetics and mechanism of aminoglycoside entry into strial tissues (i.e., endothelial, intermediate and marginal cells) are likely different and more complex (and/or at a reduced density) than in kidney proximal tubule cells exposed directly to the aminoglycoside-laden ultrafiltrate.
The mechanisms for strial trafficking of gentamicin from capillary lumen to marginal cells remain to be identified. The aminoglycoside-permissive TRPV4 channel is abundantly expressed in intermediate cells within the stria vascularis, although whether TRPV4 is directly involved in aminoglycoside trafficking at this location is unclear (Karasawa et al., 2008; Steyger and Karasawa, 2008). If a trans-strial pathway for systemic aminoglycosides to enter endolymph exists, it implicates distinct trafficking mechanisms that translocate the cationic aminoglycosides across the cell membranes comprising the strial BLB, including: (i) from the capillary lumen into strial endothelial cells, (ii) passaging into intermediate cells, (iii) clearance from endothelial cells and/or intermediate cells into the intra-strial space against the intra-strial electrical gradient, (iv) uptake at the basolateral membranes of marginal cells, prior to (v) translocation across the lumenal/apical membrane of marginal cell into endolymph (Fig. 8). Tight junctions exist between adjacent strial endothelial cells and marginal cells, preventing paracellular transport of aminoglycosides or other macromolecules (Forge, 1976; Sakagami et al., 1982).
Figure 8. Hypothesized trans-strial trafficking pathway for gentamicin in the strial capillary lumen.

Gentamicin in the capillary lumen (1) is translocated into endothelial cells (E), passaged into intermediate cells via gap junctions (2), and then cleared from endothelial cells and/or intermediate cells into the intra-strial space against the intra-strial electrical gradient (3). (4) Gentamicin is then translocated across the basolateral membrane of marginal cells, and (5) cleared across the lumenal/apical membrane of marginal cell into endolymph.
“Passive” trafficking of aminoglycosides down concentration gradients via permissive ion channels (e.g., TRPV4) may be involved at specific locations on this pathway, for example, loading of endothelial cells, or clearance from marginal cells into endolymph. Electrophoretic movement of cationic aminoglycosides through permissive channels is an indirect form of active trafficking due to the energy expenditure is required to generate the transmembrane electrical gradients. More active or electrogenic trafficking mechanisms (e.g., ATPases, symporters, exchangers) may also be involved, particularly at the interface between the membranes of endothelial and/or intermediate cells that lie adjacent to the basolateral membrane of marginal cells, to overcome the intra-strial electrical boundary.
Unconjugated gentamicin is a competitive antagonist of GTTR, and is more potent in proximal tubule cells. Strial tissues have much less GTTR uptake than proximal tubule cells, presumably because strial GTTR uptake mechanisms have a lower affinity (or lack specificity) for GTTR, and/or occur at a much reduced density, than in proximal tubule cells. These strial GTTR uptake mechanisms are antagonized only at high molar ratios of aminoglycosides. The high dissociation constant for gentamicin in the stria (KGT, stria = 68.7) relative to that for GTTR (KGTTR, stria = 0.18) simply describes numerically the observed competitive antagonism, and is suggestive of low affinity uptake and trafficking mechanism(s) for gentamicin in the stria vascularis.
Acknowledgments
Funded by DC 04555 and P30 DC 05983 grants from the National Institute of Deafness and other Communication Disorders, NIH. We thank Anthony Ricci, Ph.D. of Stanford for discussion on the manuscript.
Abbreviations
- ATPases
adenosine triphosphatases
- BBB
blood-brain barrier
- BLB
blood-labyrinth barrier
- EP
endolymphatic potential
- FATX
4% formaldehyde plus 0.5% Triton X-100
- FBS
fetal bovine serum
- GT
gentamicin
- GTTR
gentamicin-Texas Red conjugate
- IC50
inhibitory concentration required to reduce response by 50%
- ID50
inhibitory dose required to reduce response by 50%
- i.p
intraperitoneal
- K
equilibrium dissociation constant
- KGT
equilibrium dissociation constant for gentamicin
- KGTTR
equilibrium dissociation equilibrium constant for GTTR
- KKM
equilibrium dissociation constant for kanamycin
- MEMα
minimal essential medium alpha
- MDCK
Madin-Darby canine kidney distal tubule (cells)
- PBS
phosphate-buffered saline
- ROI
region of interest
- s.e.m
standard error of the mean
- TR
Texas Red
- TRPV4
transient receptor potential – vanilloid class member 4
Footnotes
Publisher's Disclaimer: This is a PDF file of an unedited manuscript that has been accepted for publication. As a service to our customers we are providing this early version of the manuscript. The manuscript will undergo copyediting, typesetting, and review of the resulting proof before it is published in its final citable form. Please note that during the production process errors may be discovered which could affect the content, and all legal disclaimers that apply to the journal pertain.
LITERATURE CITED
- Aran JM, Erre JP, Lima da Costa D, Debbarh I, Dulon D. Acute and chronic effects of aminoglycosides on cochlear hair cells. Ann N Y Acad Sci. 1999;884:60–8. doi: 10.1111/j.1749-6632.1999.tb08636.x. [DOI] [PubMed] [Google Scholar]
- Asheim P, Spigset O, Aasarod K, Walstad RA, Uggen PE, Zahlsen K, Aadahl P. Pharmacokinetics of intraperitoneally instilled aminophylline, terbutaline and tobramycin in pigs. Acta anaesthesiologica Scandinavica. 2008;52:243–8. doi: 10.1111/j.1399-6576.2007.01535.x. [DOI] [PubMed] [Google Scholar]
- Cohen-Salmon M, Regnault B, Cayet N, Caille D, Demuth K, Hardelin JP, Janel N, Meda P, Petit C. Connexin30 deficiency causes instrastrial fluid-blood barrier disruption within the cochlear stria vascularis. Proc Natl Acad Sci U S A. 2007;104:6229–34. doi: 10.1073/pnas.0605108104. [DOI] [PMC free article] [PubMed] [Google Scholar]
- Dai CF, Mangiardi D, Cotanche DA, Steyger PS. Uptake of fluorescent gentamicin by vertebrate sensory cells in vivo; Hear Res; 2006. pp. 64–78. [DOI] [PMC free article] [PubMed] [Google Scholar]
- Dai CF, Steyger PS. A systemic gentamicin pathway across the stria vascularis. Hear Res. 2008;235:114–24. doi: 10.1016/j.heares.2007.10.010. [DOI] [PMC free article] [PubMed] [Google Scholar]
- Ericsson CD, Duke JH, Jr, Pickering LK. Clinical pharmacology of intravenous and intraperitoneal aminoglycoside antibiotics in the prevention of wound infections. Annals of surgery. 1978;188:66–70. doi: 10.1097/00000658-197807000-00011. [DOI] [PMC free article] [PubMed] [Google Scholar]
- Flessner MF. The transport barrier in intraperitoneal therapy. Am J Physiol Renal Physiol. 2005;288:F433–42. doi: 10.1152/ajprenal.00313.2004. [DOI] [PubMed] [Google Scholar]
- Forge A. Observations on the stria vascularis of the guinea pig cochlea and the changes resulting from the administration of the diuretic furosemide. Clin Otolaryngol. 1976;1:211–9. doi: 10.1111/j.1365-2273.1976.tb00879.x. [DOI] [PubMed] [Google Scholar]
- Gale JE, Marcotti W, Kennedy HJ, Kros CJ, Richardson GP. FM1–43 dye behaves as a permeant blocker of the hair-cell mechanotransducer channel. J Neurosci. 2001;21:7013–25. doi: 10.1523/JNEUROSCI.21-18-07013.2001. [DOI] [PMC free article] [PubMed] [Google Scholar]
- Goodyear RJ, Gale JE, Ranatunga KM, Kros CJ, Richardson GP. Aminoglycoside-induced phosphatidylserine externalization in sensory hair cells is regionally restricted, rapid, and reversible. J Neurosci. 2008;28:9939–52. doi: 10.1523/JNEUROSCI.1124-08.2008. [DOI] [PMC free article] [PubMed] [Google Scholar]
- Hashino E, Shero M. Endocytosis of aminoglycoside antibiotics in sensory hair cells. Brain Res. 1995;704:135–40. doi: 10.1016/0006-8993(95)01198-6. [DOI] [PubMed] [Google Scholar]
- Hiel H, Schamel A, Erre JP, Hayashida T, Dulon D, Aran JM. Cellular and subcellular localization of tritiated gentamicin in the guinea pig cochlea following combined treatment with ethacrynic acid. Hear Res. 1992;57:157–65. doi: 10.1016/0378-5955(92)90148-g. [DOI] [PubMed] [Google Scholar]
- Imamura S, Adams JC. Distribution of gentamicin in the guinea pig inner ear after local or systemic application. J Assoc Res Otolaryngol. 2003;4:176–95. doi: 10.1007/s10162-002-2036-8. [DOI] [PMC free article] [PubMed] [Google Scholar]
- Jacquet P, Sugarbaker PH. Peritoneal-plasma barrier. Cancer treatment and research. 1996;82:53–63. doi: 10.1007/978-1-4613-1247-5_4. [DOI] [PubMed] [Google Scholar]
- Karasawa T, Wang Q, Fu Y, Cohen DM, Steyger PS. TRPV4 enhances the cellular uptake of aminoglycoside antibiotics. J Cell Sci. 2008;121:2871–2879. doi: 10.1242/jcs.023705. [DOI] [PMC free article] [PubMed] [Google Scholar]
- Kenakin TP. Overview of Receptor Interactions of Agonists and Antagonists. Current Protocols in Pharmacology. 2008;42:4.1.1–4.1.24. doi: 10.1002/0471141755.ph0401s42. [DOI] [PubMed] [Google Scholar]
- Koo JW, Balaban CD. Serotonin-induced plasma extravasation in the murine inner ear: possible mechanism of migraine-associated inner ear dysfunction. Cephalalgia. 2006;26:1310–9. doi: 10.1111/j.1468-2982.2006.01208.x. [DOI] [PubMed] [Google Scholar]
- Luk L, Alharazneh A, Naeem T, Monfarad A, PSS, Cheng AG, Ricci A. Aminoglycosides Rapidly and Selectively Enter Hair Cells, Largely Via Mechanotransducer Channels. ARO Midwinter Meeting Abstracts. 2010;33:710. [Google Scholar]
- Magdesian KG, Hogan PM, Cohen ND, Brumbaugh GW, Bernard WV. Pharmacokinetics of a high dose of gentamicin administered intravenously or intramuscularly to horses. J Am Vet Med Assoc. 1998;213:1007–11. [PubMed] [Google Scholar]
- Marcotti W, van Netten SM, Kros CJ. The aminoglycoside antibiotic dihydrostreptomycin rapidly enters mouse outer hair cells through the mechano-electrical transducer channels. J Physiol. 2005;567:505–21. doi: 10.1113/jphysiol.2005.085951. [DOI] [PMC free article] [PubMed] [Google Scholar]
- Myrdal SE, Steyger PS. TRPV1 regulators mediate gentamicin penetration of cultured kidney cells. Hear Res. 2005;204:170–82. doi: 10.1016/j.heares.2005.02.005. [DOI] [PMC free article] [PubMed] [Google Scholar]
- Myrdal SE, Johnson KC, Steyger PS. Cytoplasmic and intra-nuclear binding of gentamicin does not require endocytosis. Hear Res. 2005;204:156–69. doi: 10.1016/j.heares.2005.02.002. [DOI] [PMC free article] [PubMed] [Google Scholar]
- Neubig RR, Spedding M, Kenakin T, Christopoulos A. International Union of Pharmacology Committee on Receptor Nomenclature and Drug Classification. XXXVIII. Update on terms and symbols in quantitative pharmacology. Pharmacol Rev. 2003;55:597–606. doi: 10.1124/pr.55.4.4. [DOI] [PubMed] [Google Scholar]
- Newman DJ, Henneberry H, Price CP. Particle enhanced light scattering immunoassay. Ann Clin Biochem. 1992;29 (Pt 1):22–42. doi: 10.1177/000456329202900104. [DOI] [PubMed] [Google Scholar]
- Orsini JA, Soma LR, Rourke JE, Park M. Pharmacokinetics of amikacin in the horse following intravenous and intramuscular administration. Journal of veterinary pharmacology and therapeutics. 1985;8:194–201. doi: 10.1111/j.1365-2885.1985.tb00944.x. [DOI] [PubMed] [Google Scholar]
- Sakagami M, Matsunaga T, Hashimoto PH. Fine structure and permeability of capillaries in the stria vascularis and spiral ligament of the inner ear of the guinea pig. Cell Tissue Res. 1982;226:511–22. doi: 10.1007/BF00214780. [DOI] [PubMed] [Google Scholar]
- Sakagami M, Harada T, Sano M, Sakai S, Matsunaga T. Quantitative evaluation of pinocytosis of capillaries of the stria vascularis under normal and experimental conditions. Acta Otolaryngol. 1987;103:189–97. [PubMed] [Google Scholar]
- Sandoval R, Leiser J, Molitoris BA. Aminoglycoside antibiotics traffic to the Golgi complex in LLC-PK1 cells. J Am Soc Nephrol. 1998;9:167–74. doi: 10.1681/ASN.V92167. [DOI] [PubMed] [Google Scholar]
- Steyger PS, Karasawa T. Intra-cochlear trafficking of aminoglycosides. Communicative and Integrative Biology. 2008;1:140–142. doi: 10.4161/cib.1.2.6888. [DOI] [PMC free article] [PubMed] [Google Scholar]
- Takada A, Bledsoe S, Jr, Schacht J. An energy-dependent step in aminoglycoside ototoxicity: prevention of gentamicin ototoxicity during reduced endolymphatic potential. Hear Res. 1985;19:245–51. doi: 10.1016/0378-5955(85)90144-3. [DOI] [PubMed] [Google Scholar]
- Van Way CW, Hasse G. Amikacin concentrations in serum following intraoperative irrigation of the pleura and peritoneum. Annals of surgery. 1985;201:333–6. doi: 10.1097/00000658-198503000-00013. [DOI] [PMC free article] [PubMed] [Google Scholar]
- Wang Q, Steyger PS. Trafficking of systemic fluorescent gentamicin into the cochlea and hair cells. J Assoc Res Otolaryngol. 2009;10:205–19. doi: 10.1007/s10162-009-0160-4. [DOI] [PMC free article] [PubMed] [Google Scholar]
- Wu WJ, Sha SH, McLaren JD, Kawamoto K, Raphael Y, Schacht J. Aminoglycoside ototoxicity in adult CBA, C57BL and BALB mice and the Sprague-Dawley rat. Hear Res. 2001;158:165–78. doi: 10.1016/s0378-5955(01)00303-3. [DOI] [PubMed] [Google Scholar]