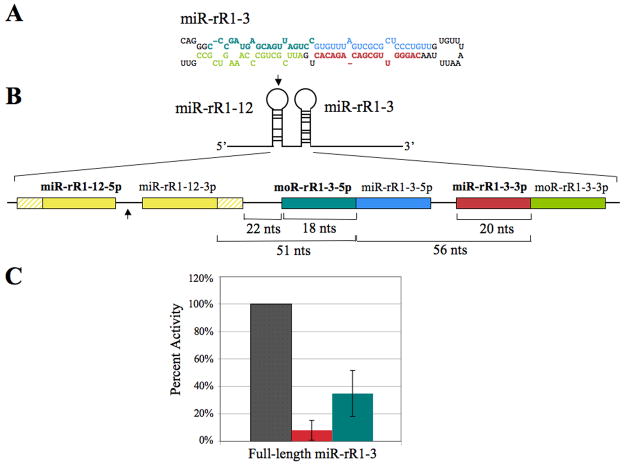
Figure 4.
Activity of miR-rR1-3-3p and moR-rR1-3-5p. (A) Predicted secondary structure of the pri-miR-rR1-3 hairpin. The sequence of mature miR-rR1-3-3p is indicated in red and the miR-rR1-3-5p star strand shown in blue. The dominant arm of moR-rR1-3 is indicated in teal and the corresponding star strand in green. (B) Schematic of the full-length and 5′ truncated miR-rR1-3 expression constructs expanded to show relative sizes and locations of mature miRNAs, moRNAs and cleavage intermediates. MiRNAs and moRNAs indicated in bold designate the dominant arms recovered from deep sequencing. The arrow indicates the 5′ border of the 5′ truncated ΔmiR-rR1-3 expression construct. Hatched yellow boxes represent basal stem sequences of pri-miR-rR1-12. (C) Inhibitory activity of miR-rR1-3-3p (red) and moR-rR1-3-5p (teal) revealed in transfected 293T cells using luciferase-based indicator plasmids bearing two perfectly complementary target sites. Values are displayed relative to a control indicator bearing an unrelated sequence (gray), which was set at 100%. Average of three independent experiments with standard deviation indicated.

