Abstract
Thermal disruption of protein structure and function is a potentially powerful therapeutic vehicle. With the emerging nanoparticle-targeting and femtosecond laser technology, it is possible to deliver heating locally to specific molecules. It is therefore important to understand how fast a protein can unfold or lose its function at high temperatures, such as near the water boiling point. In this study, the thermal damage of EGF was investigated by combining the replica exchange (136 replicas) and conventional molecular dynamics simulations. The REMD simulation was employed to rigorously explore the free energy landscape of EGF unfolding. Interestingly, besides the native and unfolded states, we also observed a distinct molten globule (MG) state that retained substantial amount of native contacts. Based on the understanding that which the unfolding of EGF is a three-state process, we have examined the unfolding kinetics of EGF (N→ MG→h multiple 20-ns conventional MD simulations. The Arrhenius prefactors and activation energy barriers determined from the simulation are within the range of previously studied proteins. In contrast to the thermal damage of cells and tissues which take place on the time scale of seconds to hours at relatively low temperatures, the denaturation of proteins occur in nanoseconds when the temperature of heat bath approaches the boiling point.
Keywords: uman epidermal growth factor (EGF), Thermal denaturation, Replica exchange molecular dynamics simulations, Free energy landscape, Molten globule, Transition state, Unfolding kinetics
1. Introduction
The central theme of structural biology is that the protein function depends on the structure. Thermal denaturation is a process in which a protein unfolds from its native structure upon heating. The energy threshold needs to be surpassed for the protein to reach the point where either the secondary and/or tertiary structure of the protein, will break apart, thus arriving at an unfolded state [1]. Protein denaturation has been found to be the primary cause of cell death [2], and this protein denaturation can be induced by a number of external stresses including the application of strong acids or bases, organic solvents, and heat. The latter mechanism provides the basis for a range of medical treatments that make up thermal therapy, whereby tissue is heated to high temperatures (above 50°C), resulting in cell death. Traditionally, heat is generated via conduction, radiofrequency energy, or laser sources, and has found numerous applications in including the removal of birthmarks, tissue cautery during surgery, and treatment of cancer. Many of these techniques induce widespread tissue heating to large tissue volumes (e.g. whole tumor); however, recent advances in nanotechnology allow for confined heating of tissues on the nanometer scale. Photothermal therapy, a specific thermal therapy procedure, utilizes a foreign probe such as nanoparticles that has the property of changing light into heat therefore localizing the heating in the nanometer range [3]. This technique has become important in research for such fields as cancer therapy [4, 5]. With this emerging technique, thermal damage at the molecular level becomes possible. It is therefore important to understand the kinetics of thermal denaturation at high temperature and short timescale to apply the local-heating to thermal therapy.
A number of different experimental approaches have been used to study the structure and energetics of unfolding, folding and transition states [6–10]. Molecular dynamics simulations have been widely used to examine details of the folding process of proteins that are otherwise not readily available experimentally [7, 8, 11–16]. Because protein folding and unfolding reactions typically occur on a time scale out of reach by the current computational power except for very small systems, significantly elevated temperatures have been used to induce unfolding. The results from such temperature-induced unfolding simulations are generally in reasonable agreement with experiments [11, 12, 17]. Replica exchange molecular dynamics (REMD) method [18] has been used to provides enhanced sampling of protein folding [15, 17, 19–22]. The free energy landscapes of protein folding in water are believed to be at least partially rugged. At room temperature, protein systems can be trapped in the local energy minima during conventional MD simulations. In REMD, a set of simulations are performed independently at different target temperatures, and exchanges are attempted according to the Metropolis criterion, therefore permitting random walks in the temperature space and escape from local energy traps. REMD has been successfully applied to the folding studies of β-hairpin [23], three-strand β-sheet [24], helical peptides [25], and small proteins [26, 27].
A typical small protein can fold and unfold reversibly in vitro, undergoing a first-order (i.e., two-state) transition between its denatured state D and its “native” (i.e., folded) state N, depending on temperature, pH, denaturant concentration, etc [28, 29]. Under certain conditions, proteins can also exhibit a collapsed state with partial order known as the “molten globule” (MG) intermediate that possesses native secondary and tertiary characteristics but lacks well-packed side chains [30–32]. There is evidence for some proteins, e.g. apomyoglobin, that the molten globule present under equilibrium conditions resembles kinetic intermediates formed during protein folding [33, 34]. Moreover, there have been suggestions that the molten globule and other non-native states of some proteins are functionally important and that the partially denatured species play a role in the transition to amyloid Fibrils [35, 36]. It is therefore of great interest to understand the structural and thermodynamic properties of these non-native species which are not easily accessible by experiments as their NMR spectra have broad lines.
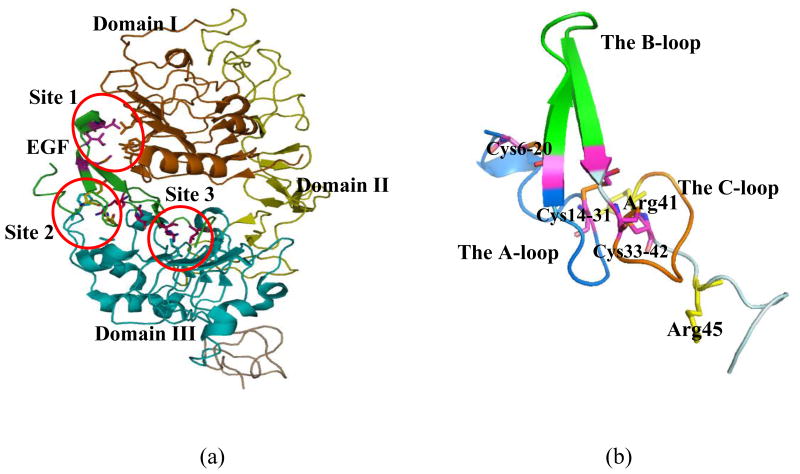
It has been shown that many epithelial cancer cells, which account for over 85% of all cancers, overexpress human epidermal growth factor receptor (EGFR), a clinically relevant biomarker [37]. This has lead to the development of several drugs that bind to EGFR and inhibit its activation. Recent examples include cetuximab for the treatment of colorectal cancer and herceptin for the treatment of breast cancer. As a result, EGF is commonly used as a mechanism to actively target these carcinoma cells, and numerous imaging and therapeutic agents are being developed to bind to the EGFR on the cell surface. EGF is a small mitogenic peptide of 53 amino acid residues that was first characterized and sequenced in 1972 [38]. EGF stimulates the growth of epidermal and epithelial cells by binding to the EGF receptor. The EGF-like domain has been found in a large number of functional unrelated proteins. Since the discovery of EGF, more than 300 EGF like sequences have been identified, mostly as domains of larger proteins, ranging from urokinase, E-selectins, lipoprotein receptor, type-R transforming growth factor (TGF-R), heregulin, and tissue plasminogen activator [39]. These proteins have been associated with a diverse range of functions, including blood coagulation, fibrinolysis, neural development, and cell adhesion [39]. The corresponding receptor (EGFR) is a trans-membrane protein comprising 1186 residues. EGF induces dimerization of EGFR by binding to the extracellular region of the receptor, which leads to a 2:2 EGF-EGFR (Figure 1a). A recent experimental structure has suggested a receptor-mediated mechanism for the receptor dimerization [40]. In this mechanism, an EGF molecule binds to the extracellular domains (L1 and L2) of a receptor molecule, which induces conformational changes of EGFR so that its dimerization surface in the S1 domain is exposed. After dimerization, the cytoplasmic tyrosine kinase domains in the two EGFR molecules are close enough for autophosphorylation, which will activate the intrinsic tyrosine kinase activity and trigger numerous downstream signaling events to regulate cell proliferation and differentiation [40].
Fig. 1.
EGF molecule used for the simulation. (a) Human EGF-EGFR complex (PDB entry: 1IVO). The EGF chains are colored in cyan. Three binding sites in the interface are outlined. (b) EGF. The three loops (A loop: blue, B loop: green, and C loop: brown) are indicated in colors. Arg41 of EGF interacts with the site 2 and the C-terminal region around Arg45 interacts with the site 3 are shown in sticks.
EGF is stabilized by three disulfide bonds with the pairing pattern of (1–3, 2–4, and 5–6) (Cys6-Cys20, Cys14-Cys31, and Cys33-Cys42). The presently known experimental structures of human EGF are very similar [40–42]. Also, the EGFs from different species such as murine have essentially the same fold as human EGF [43–45]. The primary structure of EGF comprises three distinct loops (A, B, and C loops), which are divided by three disulfide bridges (Cys6-Cys20, Cys14-Cys31, and Cys33-Cys42), as shown in Figure 1b. The N-terminal A-loop (residues 6–19) that is fastened by the disulfide bond Cys6-Cys20 contains an α-helical fragment. The so-called B-loop (residues 20–31) comprises a two-stranded anti parallel β-sheet, and the C-loop (residues 33–42) is constrained by the third disulfide bond Cys33-Cys42. The three loops in EGF interact extensively with three specific sites in EGFR (Figure 1a). The B loop (residues 20–31) of EGF interacts with the site 1 in domain I (Figure 1a), the region containing the A loop (residues 6–19); Arg41 of EGF interacts with the site 2 in domain III (Figure 1a); the C-terminal region around Arg45 interacts with the site 3 in domain III. Fully reduced and denatured EGF is able to refold via disulfide oxidation to form the native conformation spontaneously and quantitatively. However, the folding mechanism of EGF displays unique properties that are not shared by other small disulfide proteins [46].
Although the EGF has been intensively investigated experimentally and theoretically [1, 46, 47], EGF folding/unfolding mechanism is not yet fully understood. Indeed, some experiments suggest a two-state behavior in chemical denaturation [48], while others point to the presence of intermediates [49]. In this work, we investigate the folding and unfolding of protein EGF using the explicit solvent molecular dynamics. From a 3μs REMD (combined over 136 replicas) simulation trajectory, we have characterized the free energy landscape of EGF at various temperatures with respect to the commonly used order parameters such as the fraction of native contact (Q), root mean square deviation (RMSD), and radius of gyration (Rg). The results show that the thermal unfolding of EGF can be described as two separate stages (N→molten globule (MG) and MG→D). The folded, unfolded, and molten globule states have been identified on the free-energy landscapes with detailed structural analysis performed at the secondary structure level. Based on the transition state structure (N→MG and MG→D) characterized from REMD, we have evaluated the unfolding kinetics from several conventional MD simulations at the elevated temperatures, which are compared with the results for other proteins as well as the kinetics of thermal damage of tissues.
2. Methodology
2.1. System set up
Molecular dynamics simulations were performed using the GROMACS 4.0 package [50, 51] and OPLSAA force field [52] implemented on LINUX architecture. Because structure of the free human EGF is unavailable, chain C (one of the two EGF molecules) of the crystal structure of the EGF-EGFR complex (pdb entry: 1IVO) was used as the starting structure in simulations (Figure 1a) [40]. It contains only the coordinates of residues 5–51. The protein was placed in a rectangular box such that the minimal distance between the solute and the box boundary was 1.0 nm. The box was then filled with SPC water molecules [53]. Two Na+ ions were added to neutralize the system. After 1,000 steps of minimization and a 50 ps equilibration at 300 K, the conformation was then taken for the production simulations of the CMD and REMD. Periodic boundary conditions combined with minimum image convention were used in the canonical ensemble (NVT) simulations. Bonds involving hydrogen atoms were constrained according to the LINCS protocol [54]. This allowed use of a time step of 2 fs. Van der Waals interactions were truncated at 1.0 nm. Electrostatic interactions were treated through the particle mesh Ewald (PME) approach [55, 56]. A 10Å cut-off was used for the PME real space and 1.2 Å grid spacing for the Fourier transform in the reciprocal space. Fourth order cubic interpolations were used for off-grid positions. The non-bonded pair list was updated every 10 steps and conformations were stored every 2 ps. The temperature was controlled by Berendsen coupling [57] with a 0.1 ps time constant. Other analyses were performed using scripts included with the GROAMCS distribution. The visual analysis of protein structures was carried out using Pymol [58] and VMD [59].
2.2. Replica exchange molecular dynamics
The REMD simulation was performed in NVT ensemble with the GROMACS 4.0 program on the same system used for the simulations described in the previous paragraph. We simulate this system with 136 replicas, with temperature ranging from 290–700 K. Starting from an energy-minimized native structures, a 50 ps simulation is performed first at each temperature. Then the final configurations for the 136 replicas are used as the starting structures of the REMD simulations. The replica exchanges were attempted every 1 ps, and the protein configurations were saved every 2 ps. Temperature differences between 1.1 and 2.0 K avoid low exchange rate between replicas at the highest temperatures due to the decreasing overlap of energy states in NVT ensemble, as extensively discussed by Seibert et al [14]. An exchange was attempted every 500 steps (corresponding to 1 ps) and acceptance ratio was computed according to the Metropolis criterion of
| (1) |
where ϕ(R1↔R2) is the transition probability between two neighbor replicas (computed as the minimum between the percentages of 1 and e−Δ) and β = (1/kB)T, where kB is the Boltzmann constant. Δ= [βn−βn+1] (E(q[i])− E(q[j])). Here βn and βn+1 are two reciprocal temperatures, q[i] is the configuration at βn, q[j] is the configuration at βn+1, and E(q[i]) and E(q[j]) are potential energies of the systems at these two configurations, respectively. The exchange probability varied between 25% and 58% for each pair of neighbor replicas; the average exchange probability was 42 ± 2%, a level ensuring an efficient exploration of the conformational space (at least for polypeptide chains). The simulations were performed for 20 ns for each REMD set (for an aggregated 2.72 μs) and for 20 ns for each CMD trajectory (260 ns for 13 CMDs at each temperatures from 355 K to 700 K).
2.3. Data analysis
Native contact assignment was handled with MMTSB tools [60]. Residues were considered in contact when the minimum inter-residue distance of all pairs of heavy atoms is less than 4.2 Å. Secondary structure assignment was performed with DSSP [61]. The unfolding kinetics was fitted in Origin 7.5. Each representative structure is the closest snapshot to the average of all chosen snapshots at a given half time (within its standard deviation). In order to generate the two-dimensional contour map, Cα root mean square deviation (RMSD), radius of gyration (Rg), and fraction of native contact of the system (Q) were plotted for all simulations using MATLAB program (version 7.4.0).
For a system at equilibrium the free energy of a state with a reaction coordinate q is given by
| (2) |
where kB is the Boltzmann constant, T is the temperature, and p(q) is the probability of finding a conformation whose reaction coordinate is q.
3. Results and discussion
3.1. REMD simulation of EGF unfolding
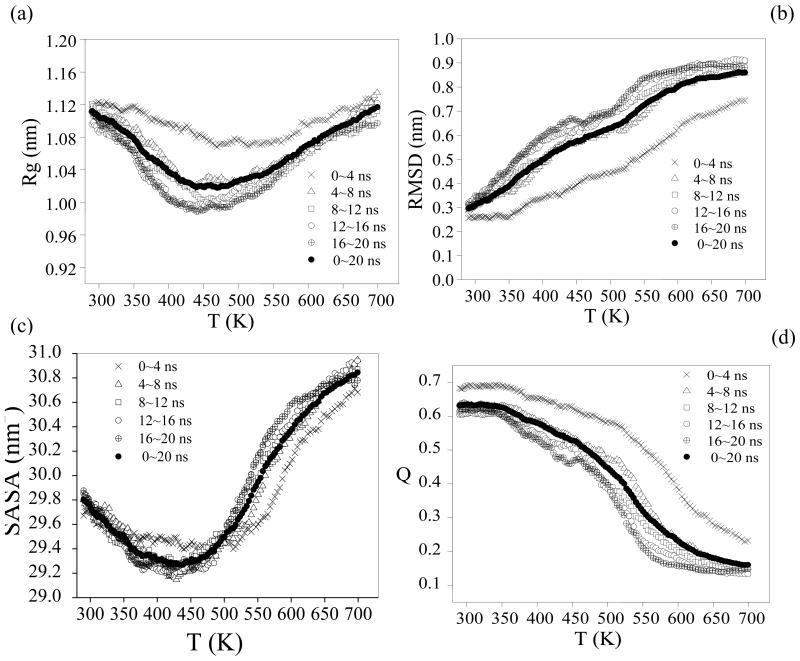
REMD simulations provide the enhanced sampling of phase-space when performed properly. The acceptance ratios of replica exchange between pairs of neighboring temperatures are crucial indicators [62]. The acceptance ratio from our simulations were rather uniform and large enough (0.25–0.58) to realize efficient replica-exchange simulation. We observed random walk behavior in the temperature space (or replica space) where every replica took the lowest and highest temperature values several hundred times. Convergence of REMD runs is also tested by monitoring the running average of the fraction of native contact (Q), Cα root mean square deviation (RMSD), Cα solvent accessible surface area (SASA), Cα radius of gyration (Rg) and the total number of hydrogen bond using five independent time intervals 0–4, 4–8, 8–12, 12–16 and 16–20 ns. As seen in Figure 2 and Figure 4a, it is safe to assume that the simulation has converged at about 4 ns. In our REMD simulation each replica is carried out a 20-ns long run and the total simulation time is about 2.72 μs. To decrease the bias associated with the initial state, data from 0 to 4 ns are therefore excluded for analysis. The last 16ns of trajectories of each replica has been used in the data analysis.
Fig. 2.
Average values of various unfolding metrics as a function of 136 REMD replicas and sampling interval. (a) Cα the radius of gyration. (b) Cα RMSD from the crystal structure (pdb entry: 1IVO). (c) Cα SASA (total solvent accessible surface area). (d) Q, the fraction of native contacts. Residues are considered in contact when the minimum inter-residue distance of all pairs of heavy atoms is less than 4.2 Å.
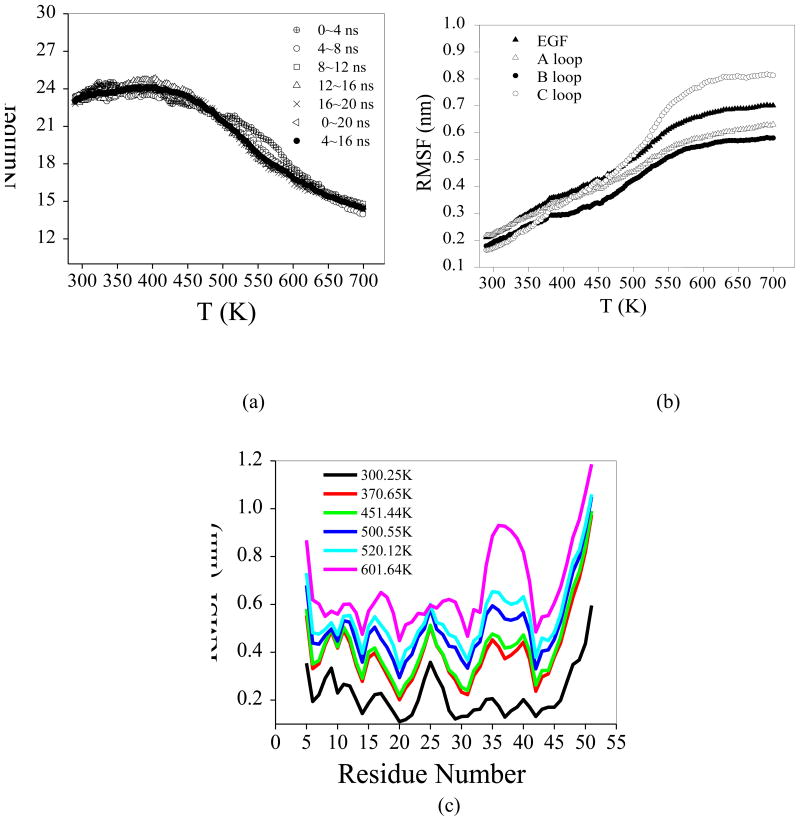
Fig. 4.
(a) Average hydrogen number as a function of temperature averaged at the last 16 ns for REMD simulation; (b) The average RMSF as a function of temperature, monitored by different structural features. The curves are obtained by fitting the raw simulation data of three structural features individually. (c) Comparison of all Cα RMSF from the starting crystal structure at different temperatures.
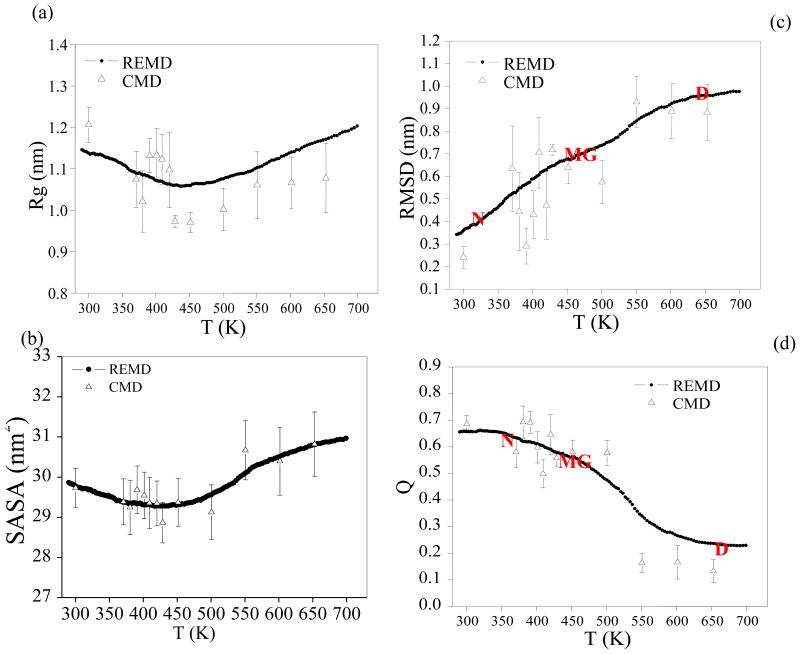
As shown in Figure 3, equilibrium properties of interest have been evaluated at 136 temperatures from 290 to 700 K from the REMD and conventional simulations. The radius of gyration, Rg, of EGF initially decreases with the increasing temperature, and begins to increase again with higher temperature (Figure 3a) after it reaches a minimum at about 440K. Similarly, the calculated solvent accessible surface area (SASA) reaches a minimum at the same temperature (Figure 3b). The maximum number of residue–residue hydrogen bonds is observed at around 403 K and decreases at higher temperatures (Figure 4a). It is likely that the H-bonding tends to favor compact structures, which are less solvent-exposed meaning stronger hydrophobic interaction. Figure 3c and Figure 3d show the melting curve which plots the average of Q and RMSD as a function of temperature. The increase of Cα RMSD and decrease of fraction of native contact over the temperature indicate the unfolding of EGF (Figure 3c and 3d). We have also compared the results from the conventional MD to those of REMD in Figure 3. It is clear that REMD provides much better sampling.
Fig. 3.
Average values of various folding metrics as a function of temperature/simulation time for the REMD simulation and the conventional simulations (CMD). For each conventional simulation and the REMD simulation averaging interval are the final 16 ns of the simulation time. (a) Cα Radius of gyration. (b) Cα SASA (solvent accessible surface area). (c) Cα RMSD from the crystal structure (pdb entry: 1IVO). (d) Q, the fraction of native contacts. Residues are considered in contact when the minimum inter-residue distance of all pairs of heavy atoms is less than 4.2 Å. Native state (N), molten globule state (MG) and denatured state (D) are showed.
3.2. Free energy landscape of EGF
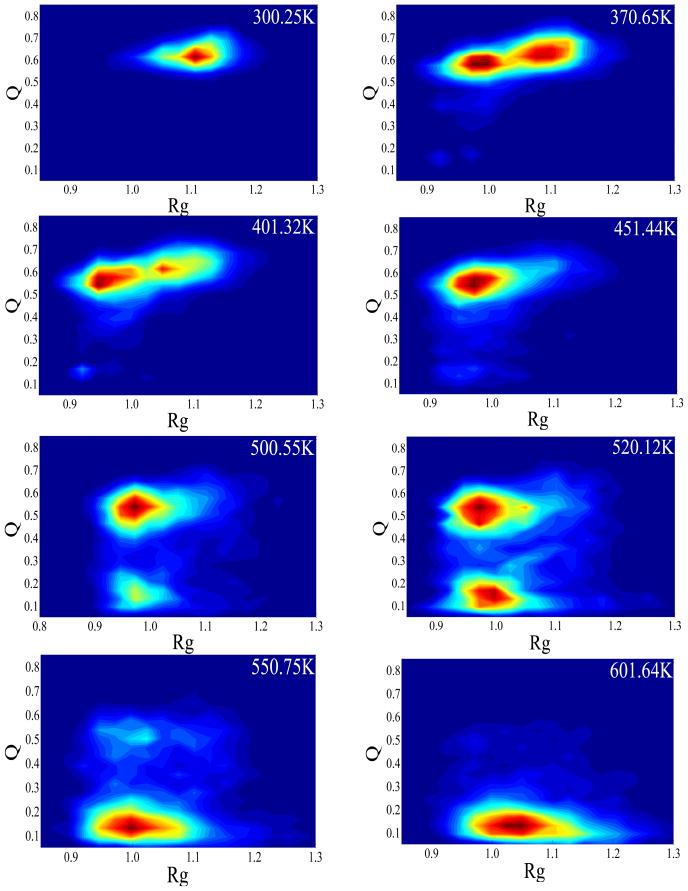
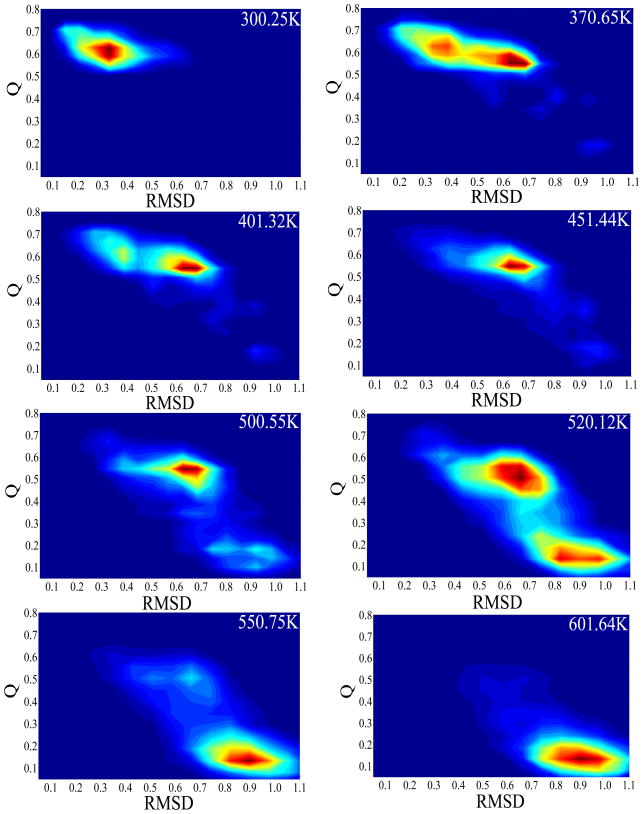
A wealth of information on the unfolding event can be extracted from the free energy landscape analysis. The free energy landscapes of EGF were evaluated using the histogram analysis method from the occurrence of the selected order parameters (Q, RMSD and Rg) in the generated ensemble of configurations at each temperature. The free energy landscape obtained from the REMD simulation are plotted in the (Rg, Q) plane (Figure 5) and (RMSD, Q) plane (Figure 6) at selected temperatures. At 300K, the most populated region was centered at Q = 0.61, Rg = 1.10 nm (Figure 5), or Q = 0.61, RMSD = 0.33 nm (Figure 6). The two corresponded to the same native-structure basin at 300.25 K. The fact that the Q was lower than 1.0 and the RMSD was above 0.3 nm at the “native state” reflected the limitation of the force field used in the study. At 601.64 K, the most populated region was around Q = 0.13 and Rg = 1.06 nm, or Q = 0.13 and RMSD = 0.90 nm which was the fully denatured state. As expected, the denatured state was not present during the REMD simulations at lower temperatures. At 370.65 K, the free-energy landscapes showed two distinct minima: the folded state N (Q = 0.63, Rg = 1.10 nm and RMSD = 0.33 nm) and an intermediate state (Q = 0.58, Rg = 0.97 nm and RMSD = 0.63 nm). The latter was named molten globule (MG) as it was clearly separated from the native state however the faction of native contact remained relatively high. Between the two minima was the first transition state region TS1 (centered at Q = 0.60 and RMSD = 0.45 nm). Based on the population, the MG had about the same free energy as the native at 370.65K. From Figure 5 and Figure 6, it can be seen that the native state population decreased as the temperature increased from 300 K and disappeared by 451.44 K, at which temperature only the MG state was present on the free energy maps. As the temperature continued to rise, by 500.12 K, the denatured state (D) appeared and became dominant at above 550 K. The molten globule coexisted with the denatured state between 500 and 550 K. At the 520 K, the MG and denatured states are at a stable equilibrium with each other. The second transition state region (TS2) was thus indentified between the two states near Q = 0.32 and RMSD = 0.75 nm. The denatured-state ensemble, as expected, had the lowest native contact fraction (0.10), and largest RMSD (0.90 nm), due to the loss of long-range native contacts and significant structural deviation from the native. Although the overall dimension of denatured EGF, Rg, was almost identical to that of the native, it was more exposed to the solvent.
Fig. 5.
The 2D Free energy landscapes of EGF at different temperatures. The reaction coordinates are Rg (unit: nm) versus Q. The lowest free energy in the N region centered at (Q =0.63, Rg=1.10 nm). The minimum in the MG region centered at (Q =0.58, Rg=0.97 nm). The minimum in the denatured region centered at (Q =0.13, Rg=0.90 nm).
Fig. 6.
The 2D Free energy landscapes of EGF at different temperatures. The reaction coordinates are Q versus RMSD (unit: nm). The lowest free energy in the F region centered at (Q =0.63, RMSD=0.33 nm). The minimum in the MG region centered at (Q =0.58, RMSD=0.63 nm). The minimum in the denatured region centered at (Q =0.13, RMSD=0.90 nm).
The free energy analysis suggests that the protein EGF unfolds with one detectable stable intermediate (MG) and the unfolding of EGF is a three-state process. The protein initially rapidly went into the native-like MG where no significant conformational change occurred. The molten globule preserved most of the native contact and was slightly more compact and less exposed to the solvent than the native structure (Figure 3). At higher temperatures, the MG state gradually unfolded as the native contacts continued to diminish and the SASA increased.
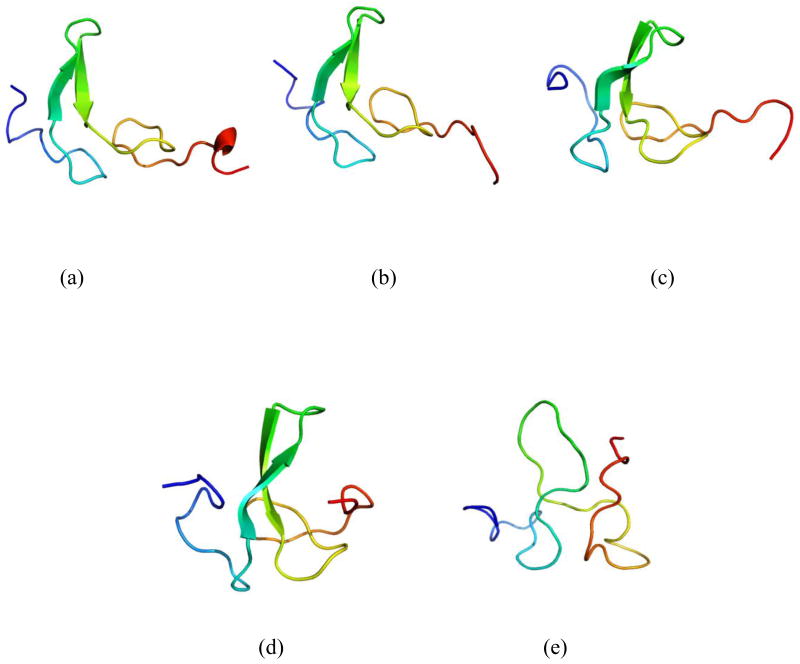
The representative structures for native, TS1, MG, TS2 and denatured states are illustrated in Figure 7. The beta sheet of the TS1 closely resembles the native one while the loops A and C are somewhat disrupted in the TS1. The MG structures have radius of gyration that were smaller than the native value. Like other molten globules, that of human EGF is compact and has substantial secondary structure. These compact, low-energy conformers have much of the native secondary structure but a limited number of non-native side-chain contacts, an observation in general agreement with experimental data concerning molten globules [30–32]. The β-sheet and loop C in the MG, noticeably changed from the native structure, were similar to that of TS2. Unfolding in our simulations was relatively local in nature, occurring in turns and loops. The loop near the terminal of the molecule (Figure 1b) is involved in binding interactions with epidermal growth factor receptor (EGFR). In our simulations, the β-sheet of the molecule remained essentially intact, although altered, upon unfolding whereas the binding region was disrupted. Previous study suggested that the loss of binding affinity of EGF with EGFR mainly arose from the steric interactions of the dislocated N-terminal region with part of the receptor binding surface of EGF [40].
Fig. 7.
Representative structures of the different states are shown on the figure of the unfolding free-energy landscape, including (a) folded state (F), (b) transition state (TS1), (c) molden globule state (MG), (d) transition state 2 (TS2) and (e) denatured state (D).
3.3. Secondary structure
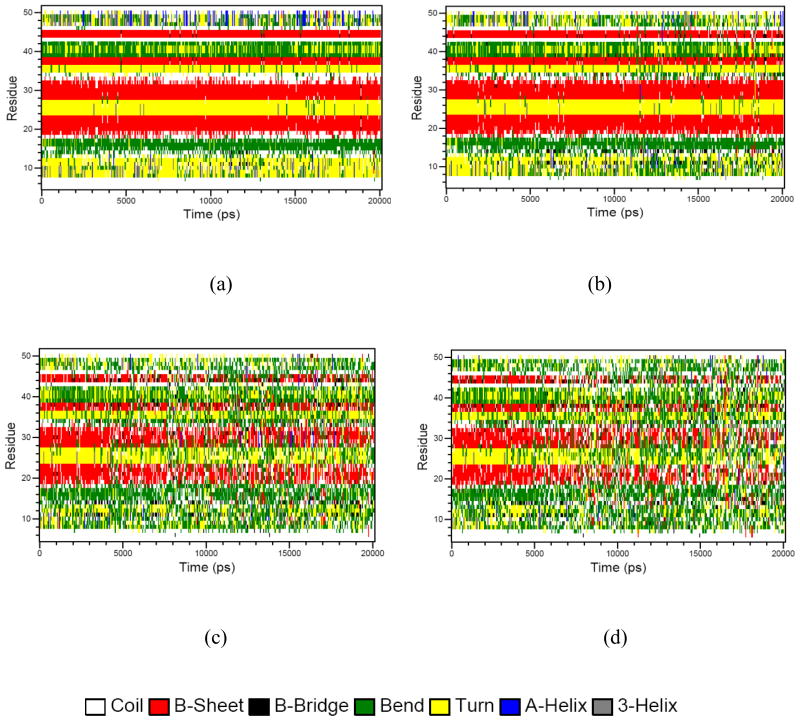
To gain further insight into the role of individual residues and secondary structures in EGF unfolding, the structural flexibility of EGF residues was characterized via RMSF and the time-dependent secondary structure fluctuations was analyzed using DSSP. Figure 8 shows the secondary structural elements as a function of simulation time. At 300.25 K most of the secondary structures from the starting crystal structure remained stable. At 601.64K all β-sheets were completely lost within 4 ns of the simulation. The terminal region of the protein became highly distorted due to the loss of the secondary structure (Figure 8). As expected, the secondary structure particularly the β-sheet content decreased with temperature, whereas the amount of coil increased (Figure 8). Notably, in the denatured state at 601.64 K 2% of the residues form β-sheets compared with about 20% in the native state.
Fig. 8.
Time evolution of secondary structure using the DSSP program at different temperatures from REMD simulations. (a) 300.25K; (b) 370.65K; (c) 500.55K and (d) 601.64K
A more detailed picture of the residue mobility at various temperatures is illustrated by the plot of root mean-square fluctuations (RMSF) of Cα atoms relative to the crystal structure. Figure 4b shows the RMSF of structural elements as a function of temperature. The loop C became more mobile than loop A and B at temperatures above 500 K. The RMSF of EGF including the individual loops saturated to high plateaus after 600 K when it completely unfolded. In Figure 4c, the RMS fluctuations per residue over the production run (16 ns) are shown at different temperature. The regions of greatest flexibility corresponded to the termini of the protein. The residues in helices and sheets showed small fluctuations during the simulations. The RMSFs observed for different temperatures exhibit more or less similar distribution and magnitude as seen in Figure 4c. However, at 600 K and above, most of the residues became highly mobile showing much greater fluctuation since the EGF mostly unfolded.
There are three disulfide bonds in the EGF which are undoubtedly critical for stabilizing the structure. We have examined the disulfide bond length distribution over the heating and the analysis indicates that the disulfide bonds behaved very similarly over the whole temperature range (Figure 1S). Note that, in our classical simulations, the disulfide bonds are represented by harmonic potentials that are not capable of breaking and forming. Previous experimental study showed that, under denaturing conditions and in the presence of a thiol initiator, the native EGF denatures by shuffling its native disulfide bonds and converts to a mixture of fully oxidized scrambled isomers that are trapped by non-native disulfide bonds [49]. The stabilizing influence of disulfide bridges in proteins was explained by their ability to reduce the conformational degrees of freedom of the polypeptide chain in its unfolded state, thereby decreasing the entropy of the unfolded state and destabilizing it relative to the folded state. Many aspects of the protein folding/unfolding process do not involve the making and breaking of covalent bonds. While the disulfide bonds play an important role in protein structures, the classical force field and simulations adopted in the current study is unable to address the forming and breaking of covalent bonds. Quantum mechanical approaches or empirical reactive force fields [63] will be needed to treat the disulfide bond formation explicitly and to describe their role in the protein folding kinetics.
3.4. Estimation of unfolding rates
One of the important objectives of this study is to understand how fast a protein can lose its structure and function at elevated temperatures. The “damage” or unfolding rates of EGF were calculated from the simulations as the inverse of the time needed to reach the transition state for direct comparison with experimental rates [64]. However, the REMD algorithm precludes us from discussing the kinetics of folding/unfolding because the trajectories at fixed temperatures are discontinuous in time. Here, we performed multiple conventional MD to simulate the time course of the unfolding events, from which we extracted the unfolding kinetics of EGF and compared with values of other proteins in the literature. The RMSDs over time were obtained from 20 ns simulations at 13 temperatures. Selected examples are included in the support information (Figure 2S). Based on the previous free energy analysis, we have selected RMSD=0.45 nm as the transition state I, 0.75 as the transition state II (Figure 5 and Figure 6). The time it took each trajectory to reach the RMSD was recorded and used in the rate calculation.
Experimentally, the kinetics of protein and tissue damage have been described by the Arrhenius equation [65]:
| (3) |
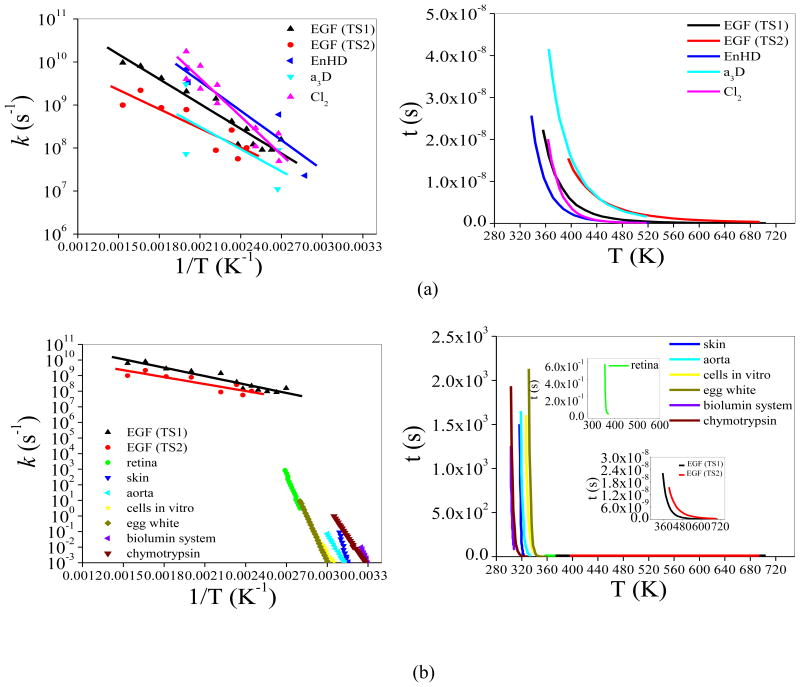
A0 and Ea are the frequency factor and activation energy, respectively. R is the universal gas constant. The activation energy can be expressed in terms of the activation enthalpy, entropy and heat capacity in interpreting experimental experimental data [63]. As the EGF underwent a transition from the native to the molten globule state and then to the denatured state, the rates in the two steps were calculated from the conventional MD simulations and denoted as kTS1 and kTS2, respectively. The results are compared to the reported unfolding rates for three proteins: CI2, Engrailed homeodomain (EnHD), α3D and experimental thermal damage rate of a variety of proteins, cells and tissues in Figure 9 [64, 65].
Fig. 9.
Temperature dependence of the unfolding rate. The points are the inverse of the time taken to reach the transition state1(TS1) and transition state2 (TS2) (from REMD simulation) in CMD simulation. (a) Unfolding data for EnHD, α3D and CI2 are from Daggett simulation [63]. (b) Different tissues are from Hüttmann and Birngruber [64].
Overall the calculated log kTS1 and log kTS2 showed a linear dependence on the inverse temperature as indicated by the Arrhenius behavior (eq 3). The rate constants suggest that the EGF denaturation occurs in the time range of nanoseconds. The pre-exponent factor A0 and activation Ea obtained by fitting Eq (3) to the simulation data were listed in Table 1 for the two unfolding steps. As shown in Figure 9, the rate to reach the transition state 1 was consistently higher than that to the transition state 2 over the whole temperature range studied. The activation energy barriers, related to the slope of the two lines, were 8.76 and 6.79 kcal/mol. The unfolding rates and activation energy barriers obtained here were within the range of previously studied proteins (Table 1) [64]. It was also noted previously that the unfolding rates from simulations were higher than those determined from experiment that were generally done at lower temperatures. A similar trend is observed for EGF as well. The calculated rate of EGF’s unfolding was higher than experimental of thermal damage of cells and tissues as shown in Figure 9b [65], suggesting that a lower activation energy barrier than what was expected by extrapolating the experimental data; however there is no evidence that such an extrapolation to near boiling point temperature is valid. It was suggested that, in cells and tissues, the unfolded proteins may quickly form stable aggregates irreversibly [5]. The aggregation may help shift the equilibrium away from the native state especially at high temperatures. The crowding environment may also affect the kinetics (activation energy barrier) if the transition state structure is “stabilized” by the crowding. On the other hand, molecular simulations have limitations in representing realistic volume fluctuation near or above boiling point temperatures due to the finite size of simulation system and physical potential for water and proteins used are also not necessarily chemically accurate. Nonetheless, even based on the simulations that showed a slower kinetic than the experimental extrapolation, the denaturation of EGF protein could occur rapidly in few nanoseconds when the temperature approaches the boiling point (Figure 9b), in contrast to the thermal damage of cells and tissues which take place on the time scale of seconds to hours at the relatively low temperature.
Table 1.
Frequency factor and activation energy of EGF from simulation compared to different and tissue cells.
| Prefactor A (s−1) | E (kcal/mol) | |
|---|---|---|
| EGF (TS1) | 1.17×10¹³ | 8.76 |
| EGF (TS2) | 3.87×10¹¹ | 6.79 |
| EnHDa | 2.17×10¹⁴ | 10.39 |
| a3Da | 1.32×10¹² | 7.87 |
| Cl2a | 6.84×10¹⁵ | 13.49 |
| retinab | 2.27×1062 | 100.73 |
| skinb | 2.42×1098 | 146.68 |
| aortab | 9.66×1041 | 65.56 |
| cells in vitrob | 1.51×1037 | 60.06 |
| egg whiteb | 5.21×1055 | 89.12 |
| biolumin systemb | 8.91×1063 | 92.47 |
| chymotrypsinb | 9.75×1038 | 58.33 |
4. Conclusions
The folding free energy landscape of a 53-residue protein EGF has been explored in this study with explicit solvent simulation and periodic boundary condition. A highly parallel replica exchange method consisting of 136 replicas spanning from 296 K to 700 K was used. Additional conventional MD simulations of 20 ns each were performed at 13 selected temperatures. Combined, the two sets of simulations provided us with the temperature-dependent thermodynamics and time-dependent kinetics on the unfolding of EGF. Three states were identified along the unfolding path from the free energy analysis, including the folded, molten globule and denatured states. The molten globule state, likely stabilized by the disulfide bonds, appeared quickly upon heating and persisted through 520K. For the purpose of thermal damage, EGF in this state would have already lost its function. AT 550 K and above the EGF was completely unfolded and lost 90% of the native contacts. We also discussed the unfolding of EGF in terms of the structures of molten globule, the first and second transition states. In MG state, the residues (Figure 1 and Figure 7) that interact with EGFR were significantly disturbed from the native state. The beta sheet (loop B) was apparently the “core” structure holding the EGF all the way until denatured state.
Furthermore, the unfolding kinetics of EGF (N→MG and MG→D) had been investigated. The unfolding rate estimated from our simulation was consistent with those of previously studied proteins. In contrast to the thermal damage of proteins, cells and tissues which take place on the time scale of seconds to hours at the low temperatures, the denaturation of proteins may occur in nanoseconds when the temperature approaches the boiling point. Experimentally it has not been feasible to heat the tissue or proteins to the temperatures near the water boiling point while the unfolding is only accessible in simulations at fairly high temperature (350 K and above). A gap remains to be filled for a meaningful comparison between simulations and experiments. Future experimental study of protein unfolding near the boiling point would bring critical insights into the validity of predicted unfolding rates.
Supplementary Material
Fig. 1S. (A) Distance for three disulfide bridges (Cys6-Cys20, Cys14-Cys31, and Cys33-Cys42); (B) The distribution of three distance (Cys6-Cys20, Cys14-Cys31, and Cys33-Cys42) for six replicas (300.25K, 401.32K, 500.55K, 550.75K, 601.64K and 652.67K).
Fig. 2S. Time series (at 2 ps intervals) of the Cα RMSD sampled by different temperature for each conventional molecular simulation (CMD).
Acknowledgments
This research was supported by grants from the National Institute of General Medical Sciences (R01GM079686) and Robert A. Welch Foundation (F-1691) to PR and by grants from the National Cancer Institute (5R01CA132032) to JT. The authors also acknowledge the Texas Advanced Computing Center (TACC) at The University of Texas at Austin for providing HPC resources. The content is solely the responsibility of the authors and does not necessarily represent the official views of the National Institute of General Medical Sciences or the National Institutes of Health.
Footnotes
Publisher's Disclaimer: This is a PDF file of an unedited manuscript that has been accepted for publication. As a service to our customers we are providing this early version of the manuscript. The manuscript will undergo copyediting, typesetting, and review of the resulting proof before it is published in its final citable form. Please note that during the production process errors may be discovered which could affect the content, and all legal disclaimers that apply to the journal pertain.
References
- 1.Baldwin RL. The nature of protein-folding pathways-the classical versus the new view. J Biomol NMR. 1995;5:103–109. doi: 10.1007/BF00208801. [DOI] [PubMed] [Google Scholar]
- 2.Goldberg AL. Protein degradation and protection against misfolded or damaged proteins. Nature. 2003;426:895–899. doi: 10.1038/nature02263. [DOI] [PubMed] [Google Scholar]
- 3.El-Sayed IH, Huang X, El-Sayed MA. Selective laser photo-thermal therapy of epithelial carcinoma using anti-EGFR antibody conjugated gold nanoparticles. Cancer Lett. 2005;239:129–135. doi: 10.1016/j.canlet.2005.07.035. [DOI] [PubMed] [Google Scholar]
- 4.Hirsch LR, Stafford RJ, Bankson JA, Sershen SR, Rivera B, Price RE, Hazle JD, Halas NJ, West JL. Nanoshell-mediated near-infrared thermal therapy of tumors under magnetic resonance guidance. Proc Natl Acad Sci USA. 2003;100:13549–13554. doi: 10.1073/pnas.2232479100. [DOI] [PMC free article] [PubMed] [Google Scholar]
- 5.Lee CL, Despa F, Hamann KJ. Cell injury, mechanism, response, and repair. J Ann NY Acad Sci. 2005:329–380. [Google Scholar]
- 6.Anil B, Sato S, Cho JH, Raleigh DP. Fine structure analysis of a protein folding transition state; distinguishing between hydrophobic stabilization and specific packing. J Mol Biol. 2005;354:693–705. doi: 10.1016/j.jmb.2005.08.054. [DOI] [PubMed] [Google Scholar]
- 7.Fulton KF, Main ERG, Daggett V, Jackson SE. Mapping the interactions present in the transition state for unfolding/folding of FKBP12. J Mol Biol. 1999;291:445–461. doi: 10.1006/jmbi.1999.2942. [DOI] [PubMed] [Google Scholar]
- 8.Gsponer J, Caflisch A. Molecular dynamics simulations of protein folding from the transition state. Proc Natl Acad Sci USA. 2002;99:6719–6724. doi: 10.1073/pnas.092686399. [DOI] [PMC free article] [PubMed] [Google Scholar]
- 9.Matouschek A, Kellis JT, Serrano L, Fersht AR. Mapping the transition-state and pathways of protein folding by protein engineering. Nature. 1989;340:122–126. doi: 10.1038/340122a0. [DOI] [PubMed] [Google Scholar]
- 10.Sosnick TR, Dothager RS, Krantz BA. Differences in the folding transition state of ubiquitin indicated by phi and psi analyses. Proc Natl Acad Sci USA. 2004;101:17377–17382. doi: 10.1073/pnas.0407683101. [DOI] [PMC free article] [PubMed] [Google Scholar]
- 11.Chng CP, Kitao A. Thermal unfolding simulations of bacterial flagellin: Insight into its refolding before assembly. Biophys J. 2008;94:3858–3871. doi: 10.1529/biophysj.107.123927. [DOI] [PMC free article] [PubMed] [Google Scholar]
- 12.Eleftheriou M, Germain RS, Royyuru AK, Zhou RH. Thermal denaturing of mutant lysozyme with both the OPLSAA and the CHARMM force fields. J Am Chem Soc. 2006;128:13388–13395. doi: 10.1021/ja060972s. [DOI] [PubMed] [Google Scholar]
- 13.Kunda S, Roy D. Temperature-induced unfolding pathway of a type III antifreeze protein: Insight from molecular dynamics simulation. J Mol Graph Model. 2008;27:88–94. doi: 10.1016/j.jmgm.2008.03.002. [DOI] [PubMed] [Google Scholar]
- 14.Seibert MM, Patriksson A, Hess B, van der Spoel D. Reproducible polypeptide folding and structure prediction using molecular dynamics simulations. J Mol Biol. 2005;354:173–183. doi: 10.1016/j.jmb.2005.09.030. [DOI] [PubMed] [Google Scholar]
- 15.Simmerling C, Strockbine B, Roitberg AE. All-atom structure prediction and folding simulations of a stable protein. J Am Chem Soc. 2002;124:11258–11259. doi: 10.1021/ja0273851. [DOI] [PubMed] [Google Scholar]
- 16.Snow CD, Nguyen N, Pande VS, Gruebele M. Absolute comparison of simulated and experimental protein-folding dynamics. Nature. 2002;420:102–106. doi: 10.1038/nature01160. [DOI] [PubMed] [Google Scholar]
- 17.Settanni G, Fersht AR. High temperature unfolding simulations of the TRPZ1 peptide. Biophys J. 2008;94:4444–4453. doi: 10.1529/biophysj.107.122606. [DOI] [PMC free article] [PubMed] [Google Scholar]
- 18.Okamoto Y. Generalized-ensemble algorithms: enhanced sampling techniques for Monte Carlo and molecular dynamics simulations. J Mol Graph Model. 2004;22:425–439. doi: 10.1016/j.jmgm.2003.12.009. [DOI] [PubMed] [Google Scholar]
- 19.Garcia AE, Onuchic JN. Folding a protein in a computer: an atomic description of the folding/unfolding of protein A. Proc Natl Acad Sci USA. 2003;100:13898–13903. doi: 10.1073/pnas.2335541100. [DOI] [PMC free article] [PubMed] [Google Scholar]
- 20.Lei HX, Wu C, Wang ZX, Zhou YQ, Duan Y. Folding processes of the B domain of protein A to the native state observed in all-atom ab initio folding simulations. J Chem Phys. 2008;128:235105–235113. doi: 10.1063/1.2937135. [DOI] [PMC free article] [PubMed] [Google Scholar]
- 21.Zhang JJ, King M, Suggs L, Ren PY. Molecular modeling of conformational properties of oligodepsipeptides. Biomacromolecules. 2007;8:3015–3024. doi: 10.1021/bm070244c. [DOI] [PubMed] [Google Scholar]
- 22.Zhou RH. Trp-cage: folding free energy landscape in explicit water. Natl Acad Sci USA. 2003;100:13280–13285. doi: 10.1073/pnas.2233312100. [DOI] [PMC free article] [PubMed] [Google Scholar]
- 23.Kim E, Yang CW, Jang SM, Pak Y. Free energy landscapes of a highly structured beta-hairpin peptide and its single mutant. J Chem Phys. 2008;129:165104–165110. doi: 10.1063/1.3000009. [DOI] [PubMed] [Google Scholar]
- 24.Roe DR, Hornak V, Simmerling C. Folding cooperativity in a three-stranded beta-sheet model. J Mol Biol. 2005;352:370–381. doi: 10.1016/j.jmb.2005.07.036. [DOI] [PMC free article] [PubMed] [Google Scholar]
- 25.Zhang W, Wu C, Duan Y. Convergence of replica exchange molecular dynamics. J Chem Phys. 2005;123:154105–154113. doi: 10.1063/1.2056540. [DOI] [PubMed] [Google Scholar]
- 26.Pitera JW, Swope W. Understanding folding and design: replica-exchange simulations of “Trp-cage” fly miniproteins. Proc Natl Acad Sci USA. 2003;100:7587–7592. doi: 10.1073/pnas.1330954100. [DOI] [PMC free article] [PubMed] [Google Scholar]
- 27.Pitera JW, Swope WC, Abraham FF. Observation of noncooperative folding thermodynamics in simulations of 1BBL. Biophys J. 2008;94:4837–4846. doi: 10.1529/biophysj.107.123265. [DOI] [PMC free article] [PubMed] [Google Scholar]
- 28.Creighton TE, Darby NJ, Kemmink J. The roles of partly folded intermediates in protein folding. Faseb J. 1996;10:110–118. doi: 10.1096/fasebj.10.1.8566531. [DOI] [PubMed] [Google Scholar]
- 29.Khorasanizadeh S, Peters ID, Roder H. Evidence for a three-state model of protein folding from kinetic analysis of ubiquitin variants with altered core residues. Nat Struct Biol. 1996;3:193–205. doi: 10.1038/nsb0296-193. [DOI] [PubMed] [Google Scholar]
- 30.Arai M, Kuwajima K. Role of the molten globule state in protein folding. Adv Protein Chem. 2000;53:209–282. doi: 10.1016/s0065-3233(00)53005-8. [DOI] [PubMed] [Google Scholar]
- 31.Creighton TE. How important is the molten globule for correct protein folding? Trends Biochem Sci. 1997;22:6–10. doi: 10.1016/s0968-0004(96)20030-1. [DOI] [PubMed] [Google Scholar]
- 32.Ptitsyn OB. Molten globule and protein folding. Adv Protein Chem. 1995;47:83–229. doi: 10.1016/s0065-3233(08)60546-x. [DOI] [PubMed] [Google Scholar]
- 33.Eliezer D, Wright PE. Is apomyoglobin a molten globule? Structural characterization by NMR. J Mol Biol. 1996;263:531–538. doi: 10.1006/jmbi.1996.0596. [DOI] [PubMed] [Google Scholar]
- 34.Jennings PA, Wright PE. Formation of a molten globule intermediate early in the kinetic folding pathway of apomyoglobin. Science. 1993;262:892–896. doi: 10.1126/science.8235610. [DOI] [PubMed] [Google Scholar]
- 35.Kim YS, Randolph TW, Manning MC, Stevens FJ, Carpenter JF. Congo red populates partially unfolded states of an amyloidogenic protein to enhance aggregation and amyloid fibril formation. J Mol Biol. 2003;278:10842–10850. doi: 10.1074/jbc.M212540200. [DOI] [PubMed] [Google Scholar]
- 36.Uversky VN, Fink AL. Conformational constraints for amyloid fibrillation: the importance of being unfolded. BBA-Proteins Proteom. 2004;1698:131–153. doi: 10.1016/j.bbapap.2003.12.008. [DOI] [PubMed] [Google Scholar]
- 37.Salomon DS, Brandt R, Ciardello F, Normanno N. Epidermal growth factor-related peptides and their receptors in human malignancies. Crit Rev Oncol Hemat. 1995;19:183–232. doi: 10.1016/1040-8428(94)00144-i. [DOI] [PubMed] [Google Scholar]
- 38.Savage CR, Cohen S. Epidermal growth-factor and a new derivative-rapid isolation procedures and biological and chemical characterization. J Biol Chem. 1972;247:7609–7611. [PubMed] [Google Scholar]
- 39.Campbell ID, Bork P. Epidermal growth factor-like modules. Curr Opin Struct Biol. 1993;3:385–392. [Google Scholar]
- 40.Ogiso H, Ishitani R, Nureki O, Fukai S, Yamanaka M, Kim JH, Saito K, Sakamoto A, Inoue M, Shirouzu M, Yokoyama S. Crystal structure of the complex of human epidermal growth factor and receptor extracellular domains. Cell. 2002;110:775–787. doi: 10.1016/s0092-8674(02)00963-7. [DOI] [PubMed] [Google Scholar]
- 41.Ferguson KM, Berger MB, Mendrola JM, Cho HS, Leahy DJ, Lemmon MA. EGF activates its receptor by removing interactions that autoinhibit ectodomain dimerization. Mol Cell. 2003;11:507–517. doi: 10.1016/s1097-2765(03)00047-9. [DOI] [PubMed] [Google Scholar]
- 42.Lu HS, Chai JJ, Li M, Huang BR, He CH, Bi RC. Crystal structure of human epidermal growth factor and its dimerization. J Biol Chem. 2001;276:34913–34917. doi: 10.1074/jbc.M102874200. [DOI] [PubMed] [Google Scholar]
- 43.Barnham KJ, Torres AM, Alewood D, Alewood PF, Domagala T, Nice EC, Norton RS. Role of the 6–20 disulfide bridge in the structure and activity of epidermal growth factor. Protein Sci. 1998;7:1738–1749. doi: 10.1002/pro.5560070808. [DOI] [PMC free article] [PubMed] [Google Scholar]
- 44.Chamberlin SG, Brennan L, Puddicombe SM, Davies DE, Turner DL. Solution structure of the mEGF/TGF alpha(44–50) chimeric growth factor. European Eur J Biochem. 2001;268:6247–6255. doi: 10.1046/j.0014-2956.2001.02581.x. [DOI] [PubMed] [Google Scholar]
- 45.Montelione GT, Wuthrich K, Burgess AW, Nice EC, Wagner G, Gibson KD, Scheraga HA. Solution structure of murine epidermal growth-factor determined by NMR-spectroscopy and refined by energy minimization with restraints. Biochemistry. 1992;31:236–249. doi: 10.1021/bi00116a033. [DOI] [PubMed] [Google Scholar]
- 46.Chang JY, Li L. The disulfide structure of denatured epidermal growth factor: Preparation of scrambled disulfide isomers. J Protein Chem. 2002;21:203–213. doi: 10.1023/a:1015380902094. [DOI] [PubMed] [Google Scholar]
- 47.Zhang ZY, Boyle PC, Lu BY, Chang JY, Wriggers W. Entropic folding pathway of human epidermal growth factor explored by disulfide scrambling and amplified collective motion simulations. Biochemistry. 2006;45:15269–15278. doi: 10.1021/bi0615083. [DOI] [PubMed] [Google Scholar]
- 48.Holladay LA, Savage CR, Cohen S, Puett D. Conformation and unfolding thermodynamics of epidermal growth-factor and derivatives. Biochemistry. 1976;15:2624–2633. doi: 10.1021/bi00657a023. [DOI] [PubMed] [Google Scholar]
- 49.Wu J, Yang Y, Watson JT. Trapping of intermediates during the refolding of recombinant human epidermal growth factor (hEGF) by cyanylation, and subsequent structural elucidation by mass spectrometry. Protein Sci. 1998;7:1017–1028. doi: 10.1002/pro.5560070419. [DOI] [PMC free article] [PubMed] [Google Scholar]
- 50.Berendsen HJC, Vanderspoel D, Vandrunen R. Gromacs - a message-passing parallel molecular-dynamics implementation. Comput Phys Commun. 1995;91:43–56. [Google Scholar]
- 51.Vander Spoel D, Lindahl E, Hess B, Groenhof G, Mark AE, Berendsen HJC. GROMACS: fast, flexible, and free. J Comput Chem. 2005;26:1701–1718. doi: 10.1002/jcc.20291. [DOI] [PubMed] [Google Scholar]
- 52.Kaminski GA, Friesner RA, Tirado-Rives J, Jorgensen WL. Evaluation and reparametrization of the OPLS-AA force field for proteins via comparison with accurate quantum chemical calculations on peptides. J Phys Chem B. 2001;105:6474–6487. [Google Scholar]
- 53.Vanbuuren AR, Marrink SJ, Berendsen HJC. A molecular-dynamics study of the decane water interface. J Phys Chem. 1993;97:9206–9212. [Google Scholar]
- 54.Hess B. P-LINCS: A parallel linear constraint solver for molecular simulation. J Chem Theory Comput. 2008;4:116–122. doi: 10.1021/ct700200b. [DOI] [PubMed] [Google Scholar]
- 55.Darden T, York D, Pedersen L. Particle mesh ewald - an N.Log(N) method for ewald sums in large systems. J Chem Phys. 1993;98:10089–10092. [Google Scholar]
- 56.Essmann U, Perera L, Berkowitz ML, Darden T, Lee H, Pedersen LG. A smooth particle mesh ewald method. J Chem Phys. 1995;103:8577–8593. [Google Scholar]
- 57.Berendsen HJC, Postma JPM, Vangunsteren WF, Dinola A, Haak JR. Molecular-dynamics with coupling to an external bath. J Chem Phys. 1984;81:3684–3690. [Google Scholar]
- 58.DeLano WL, Lam JW. PyMOL: A communications tool for computational models. Abstr Pap Am Chem Soc. 2005;230:1371–U1372. [Google Scholar]
- 59.Humphrey W, Dalke A, Schulten K. VMD: visual molecular dynamics. J Mol Graph. 1996;14:33–38. doi: 10.1016/0263-7855(96)00018-5. [DOI] [PubMed] [Google Scholar]
- 60.Feig M, Karanicolas J, Brooks CL. MMTSB Tool Set: enhanced sampling and multiscale modeling methods for applications in structural biology. J Mol Graph Model. 2004;22:377–395. doi: 10.1016/j.jmgm.2003.12.005. [DOI] [PubMed] [Google Scholar]
- 61.Kabsch W, Sander C. Dictionary of protein secondary structure - pattern-recognition of hydrogen-bonded and geometrical features. Biopolymers. 1983;22:2577–2637. doi: 10.1002/bip.360221211. [DOI] [PubMed] [Google Scholar]
- 62.Patriksson A, van der Spoel D. A, temperature predictor for parallel tempering simulations. Phys Chem Chem Phys. 2008;10:2073–2077. doi: 10.1039/b716554d. [DOI] [PubMed] [Google Scholar]
- 63.http://en.wikipedia.org/wiki/Force_field_%28chemistry%29#Reactive_Force_Fields.
- 64.Day R, Daggett V. Sensitivity of the folding/unfolding transition state ensemble of chymotrypsin inhibitor 2 to changes in temperature and solvent. Protein Sci. 2005;14:1242–1252. doi: 10.1110/ps.041226005. [DOI] [PMC free article] [PubMed] [Google Scholar]
- 65.Huttmann G, Birngruber R. On the possibility of high-precision photothermal microeffects and the measurement of fast thermal denaturation of proteins. Ieee J Sel Top Quantum Electron. 1999;5:954–962. [Google Scholar]
Associated Data
This section collects any data citations, data availability statements, or supplementary materials included in this article.
Supplementary Materials
Fig. 1S. (A) Distance for three disulfide bridges (Cys6-Cys20, Cys14-Cys31, and Cys33-Cys42); (B) The distribution of three distance (Cys6-Cys20, Cys14-Cys31, and Cys33-Cys42) for six replicas (300.25K, 401.32K, 500.55K, 550.75K, 601.64K and 652.67K).
Fig. 2S. Time series (at 2 ps intervals) of the Cα RMSD sampled by different temperature for each conventional molecular simulation (CMD).


