

Abstract
Probing chromatin structure with DNA methyltransferases offers advantages over more commonly used nuclease-based and chromatin immunoprecipitation methods for detection of nucleosomes and non-histone protein-DNA interactions. Here we describe two related methods in which the readout of MTase accessibility is obtained by assaying 5-methylcytosine in DNA through the PCR-based technique of bisulfite genomic sequencing. The methyltransferase accessibility protocol (MAP) determines the relative frequency at which the enzyme accesses each of its target sites over an entire population of PCR amplified product. While MAP yields much quantitative information about relative accessibility of a region of chromatin, a complementary single-molecule view of methyltransferase accessibility, termed MAP for individual templates (MAP-IT), is provided by analysis of cloned PCR products. Absolute rather than relative methylation frequencies in a region are obtained by summing the methylation status at each site over a cohort of clones. Moreover, as the integrity of individual molecules is maintained in MAP-IT, unique information about the distribution of multiple footprints along continuous regions is gleaned. In principle, the population MAP and single-molecule MAP-IT strategies can be used to analyze chromatin structure in a variety of model systems. Here we describe the application of MAP in living S. cerevisiae cells and MAP-IT in the analysis of a mammalian tumor suppressor gene in nuclei. This application of MAP-IT provides the first means to simultaneously determine CpG methylation of mammalian genes and their overlying chromatin structure in the same single DNA molecule.
Keywords: Bisulfite, Chromatin, GAL1, MAP, MAP-IT, Methylation, Methyltransferases, Nucleosomes, Saccharomyces cerevisiae, SIM2
1. Introduction
DNA-protein interactions are crucial to proper genome function in all living organisms. Effective methods for the detection and quantification of these interactions are therefore needed to facilitate our understanding of both normal and disease states. Classical techniques for footprinting nucleosome positions or sites of protein interaction often assess the accessibility of DNA to chemical or enzymatic probes, such as DNase I or micrococcal nuclease. The resultant DNA damage is invasive and, in the case of strand scission, destroys a priori the integrity of a DNA molecule, which precludes detection of multiple independent cleavages along a single DNA strand.
DNA methyltransferases (MTases) offer an alternative and highly effective means to map chromatin architecture in both population-ensemble and, more recently, single-molecule approaches [1–9]. MTase probing can be performed in vivo by expressing MTase genes in cells, ex vivo in nuclei or in vitro. Cytosine-5 MTases are particularly attractive probes, as a relatively non-intrusive methyl group is introduced at the C5 position of accessible cytosines that can be detected by the powerful PCR-based technique of bisulfite genomic sequencing (BGS) [10,11]. In BGS, 5-methylcytosine (m5C) resists bisulfite deamination and thus is stably replicated as cytosine during PCR amplification. Sequencing in the presence of 2', 3'-dideoxyguanosine triphosphate (ddGTP) positively displays on a sequencing gel residues that were methylated, and hence accessible, in vivo. The overall assay, termed MAP, has successfully detected positioned nucleosomes and a range of non-histone protein-DNA interactions in cell populations [3–6]. In fact, we are unaware of any instance where a known protein-DNA interaction was not footprinted by MAP when MTase sites were within about 8–10 bp of the factor binding site. To the contrary, adaptation of MAP for in vitro footprinting was effective in mapping the association of several mammalian factors (aryl hydrocarbon receptor, Sp1 and estrogen receptor α/Sp1 complex) using nuclear extracts, when conventional DNase I footprinting proved ineffective [12–15]. Two MTases, M.SssI (CpG) [16] and M.CviPI (GpC) [17], currently afford the highest resolution for MAP, as they are the only known enzymes with dinucleotide site specificity.
MAP is readily extended to provide a unique single-molecule view of MTase accessibility called MAP for individual templates (MAP-IT) [9]. As in the original BGS procedure of Frommer et al. [10,11], the cloning and sequencing of individual molecules from a PCR amplicon allows assignment of m5C or non-methylation at each potential MTase target in single molecules. Advantages of the single-molecule MAP-IT platform over MAP include: 1) obtaining absolute methylation frequencies by summing the number of m5C residues at each MTase site among a set of cloned molecules; 2) not being subject to the constraints of single-hit kinetic levels of probe modification (as governed by the Poisson distribution); and 3) detection of factor co-occupancy (or loss of two or more footprints) along a single continuous molecule of DNA. For example, we recently used MAP-IT to show that a variable number of nucleosomes were remodeled in single cells during transcriptional induction of the yeast PHO5 promoter [9]. Moreover, disruption of two or more adjacent nucleosomes in single promoters was disproportionately high at the sites of activator interaction, indicating that chromatin remodeling is localized and possibly spreads from a focus of bound activators. Patches of protection against methylation by M.SssI in cloned molecules have also been suggested to represent positions of individual nucleosomes at an unmethylated CpG island in mammalian nuclei [7]. The use of M.SssI as a chromatin probe in vertebrate systems is restricted to regions lacking m5CpG, such as CpG islands. The GpC specificity of M.CviPI circumvents this limitation, allowing vertebrate chromatin structure to be probed via MAP and MAP-IT at regions with a high density of m5CpG.
2. Methods
2.1. MAP and MAP-IT in S. cerevisiae
Here, we primarily focus on new developments and applications of DNA MTases as chromatin probes. The reader is recommended to consult Jessen et al. [6] and Hoose and Kladde [8] for more detailed descriptions of several procedures, as needed. Vectors for expressing M.CviPI and M.SssI have been described in these manuscripts and are available upon request. Procedures common to MAP and MAP-IT are discussed in Sections 2.1.1 to 2.1.5. Detection of m5C in populations (MAP) and individually cloned molecules (MAP-IT) are the subject of Sections 2.1.6 and 2.1.7, respectively.
2.1.1. Preparation of plasmids expressing MTases
E. coli strains used for subcloning and propagation of plasmids containing genes for foreign DNA MTases must be completely deficient for the methylation-dependent restriction systems, Mrr and McrBC, e.g. ER1821 (New England Biolabs), DH5α and XL1-Blue. Propagation of M.SssI, in particular, is apparently toxic to these hosts, presumably due to leaky expression. Extreme care must thus be exercised when subcloning the MTases to new plasmids or growing cells to purify plasmid DNA. It is recommended that E. coli colonies on plates and liquid cultures be grown for as short a time as possible (8–12 h) to avoid accumulation of mutations that inactivate MTase activity. As an additional precaution, a strongly transcribed, constitutive E. coli promoter is incorporated downstream and in the opposite orientation of the MTase gene, which does not interfere with expression in eukaryotic cells [18]. It is important to sequence all newly constructed recombinant plasmids.
2.1.2. Expression and screening for activity of C5 DNA MTases in budding yeast
Saccharomyces cerevisiae lacks detectable endogenous DNA methylation [19], essentially making it a blank canvas for detection of de novo methylation at accessible sites following MTase expression. Probing in living cells allows experiments to be performed under conditions that maintain physiology and avoid loss of weakly-associated chromatin components. In keeping with these goals, we commonly employ a system that expresses the MTases from an estrogen-inducible promoter that does not affect normal yeast physiology. Control experiments have demonstrated that the MTase expression levels typically employed in the actual footprinting studies do not affect growth or induction of specific genes. Jessen et al. [6] can be consulted for detailed descriptions of this MTase expression system and methods for its integration in yeast. Integration is preferred over episomal expression to ensure that all cells contain a copy of the transgene, which is of increased importance in the single-molecule approach of MAP-IT. If desired, strains can be tested for correct integration of the MTase expression vector by colony PCR. MTase activity can be ascertained through isolation of genomic DNA, described below, and its subsequent digestion with the McrBC endonuclease complex [6]. Positive strains should be frozen as glycerol stocks as soon as possible.
2.1.3. Isolation of yeast genomic DNA
Best results for MAP are obtained when cells plated from these stocks are used as soon as possible, but in any case within 14 d of plating for wild-type strains or sooner if the strain contains one or more mutations that impair cell growth. Cultures are grown under conditions appropriate to the specific experiment, using the guideline that strains should be treated for approximately 90 min with 100 nM 17β-estradiol to induce MTase expression. In addition, cells are typically harvested in early log phase growth (optical density at 600 nm < 1), although MTase induction can probably be performed at other culture densities as required. Genomic DNA is isolated by pelleting the cells by centrifugation, decanting the supernatant and resuspending the cells in 700 μl 1× TE, pH 8.0. The resuspended cells are then transferred to a 2-ml screw-cap microcentrifuge tube containing 0.3 g acid-washed glass beads. The cells are interspersed between the glass beads by a 5-s microcentrifugation at 16,000 × g (i.e. a ‘tap spin’). The supernatant is then decanted and the following are added (in order) to the cell-bead mixture: (i) 200 μl 1× TE, pH 8.0; (ii) 200 μl ‘smash buffer’; (iii) 200 μl CHCl3:IAA (24:1 v/v) and (iv) 200 μl equilibrated phenol. The samples are vortexed for 8 min and the phases separated by centrifugation at 16,000 × g for 5 min. Avoiding the white interphase, the aqueous upper phase is transferred to a new 1.7-ml microcentrifuge tube containing 200 μl 10 M NH4OAc and vortexed. The samples are incubated for 2 h to overnight at 4 °C and insoluble non-nucleic acid material is pelleted by centrifugation at 16,000 × g for 5 min at room temperature (RT). The supernatant is transferred to a new 1.7-ml microcentrifuge tube, 600 μl isopropanol is added, and the tubes are inverted several times to mix. Nucleic acids are pelleted by microcentrifugation at 16,000 × g for 5 min at RT. The supernatant is then drawn off thoroughly and the pellet is washed by addition of 400 μl 70% (v/v) EtOH, diluted with 0.1× TE, pH 8.0 (i.e. 70% EtOH:30% 0.1× TE, pH 8.0) and vortexing. After microcentrifugation for 2 min at 16,000 × g at RT, the supernatant is removed, the pellet is briefly air dried and resuspended in 50 μl 0.1× TE, pH 8.0. For yeast experiments, we have not found removal of RNA to be necessary. If footprints in an unchacterized region are being mapped, genomic DNA isolated from a strain lacking a MTase transgene should be methylated in vitro according to the enzyme manufacturer’s guidelines [9].
2.1.4. Chemical deamination of genomic DNA
We have found the following bisulfite conversion procedure very effective and have not encountered any of the commonly reported artifacts [20]. Solutions of 3 N NaOH and 100 mM hydroquinone are freshly prepared by dissolving each chemical in degassed distilled water (see Appendix), mixing gently by tube inversion to avoid aeration. To a 0.65-ml microcentrifuge tube containing 10 μl 3× denaturation buffer, add 20 μl of total genomic DNA sample.
Saturated sodium metabisulfite solution is prepared by adding 100 μl of 100 mM hydroquinone, ~5 g sodium metabisulfite (from a fresh vial) and 7 ml degassed distilled water to a 20-ml glass scintillation vial that contains a small stir bar. The solution should be gently stirred immediately and increased in pH through quick addition of 1.0 ml 3 N NaOH. The pH of the solution is adjusted to 5.0 at RT by adding more 3 N NaOH as needed and then it is pre-warmed to 50 °C in a water bath. At this point, undissolved crystals of sodium metabisulfite should be visible. Using a saturated solution simplifies reagent preparation and promotes sulfonation of cytosine, the first step of the chemical deamination, which is rapidly reversible [21]. Deamination of cytosine requires thorough separation of DNA strands in 1× denaturation solution at 98 °C for 5 min in a thermocycler, a treatment that probably quantitatively hydrolyzes RNA. After about 4 min of denaturation, gently agitate the preheated sodium metabisulfite solution on a stir plate and then allow any crystals to settle. At the end of the 5 min denaturation, 200 μl sodium metabisulfite solution is directly added to each sample while it remains at 98 °C in the thermocycler. While working rapidly, the samples are capped, vortexed and incubated for 4–6 h at 50 °C in the dark (a covered water bath will suffice). It is not necessary to overlay samples with mineral oil.
After deamination, the samples are desalted by transfer to 1.7-ml microcentrifuge tubes, addition of 1 ml Promega Wizard PCR Preps resin, and vortexing three times over a 1 min period. The resin is then transferred to syringe barrels that have been installed on the Promega vacuum manifold. After applying vacuum and fully evacuating the resin slurry, the resin is washed three times with 2 ml 80% isopropanol, completely evacuating the column between each wash. After the final wash, residual isopropanol is removed and the resin is dried by maintaining vacuum for 30 s, then the minicolumn is detached, inserted into a 1.7-ml microcentrifuge tube and subjected to centrifugation at 16,000 × g for 2 min. At this point, cytosines in the DNA have been chemically modified and deaminated to sulfonyl uracil, whereas m5C residues are retained (Fig. 1). The sulfonyl uracil-containing DNA is eluted from the resin by adding 52 μl 0.1× TE (preheated to 95 °C) to each minicolumn, incubation for 5 min at RT, and centrifugation for 20 s at 16,000 × g into a new 1.7-ml microcentrifuge tube containing 8 μl desulfonation solution, which is alkaline. After vortexing briefly, samples are desulfonated by incubation for 15 min at 37 °C to yield DNA containing uracil residues that were not methylated in vivo as well as m5C at accessed sites. The pH is neutralized by adding 18 μl 10 M NH4OAc and vortexing. The DNA is recovered by adding 200 μl absolute EtOH, vortexing and incubating overnight at –20 °C, which tangibly appears to increase sample recovery. The deaminated DNA is pelleted at 16,000 × g for 20 min at RT and the supernatant is carefully and completely drawn off by pipetting. Note that some silica resin is often present in each tube, however, it does not interfere with desulfonation or subsequent steps of the protocol as it is simply pelleted to separate it from the DNA solution. The pellet is washed by adding 400 μl 70% EtOH:30% 0.1× TE, pH 8.0, followed by centrifugation at 16,000 × g for 2 min at RT. The supernatant is again carefully removed, followed by a 5-sec tap spin at 16,000 × g and complete removal of the supernatant. The pellet is briefly air dried and resuspended in 20–50 μl 0.1× TE, pH 8.0. The deaminated DNA can be stored at –20 °C for years.
Figure 1.
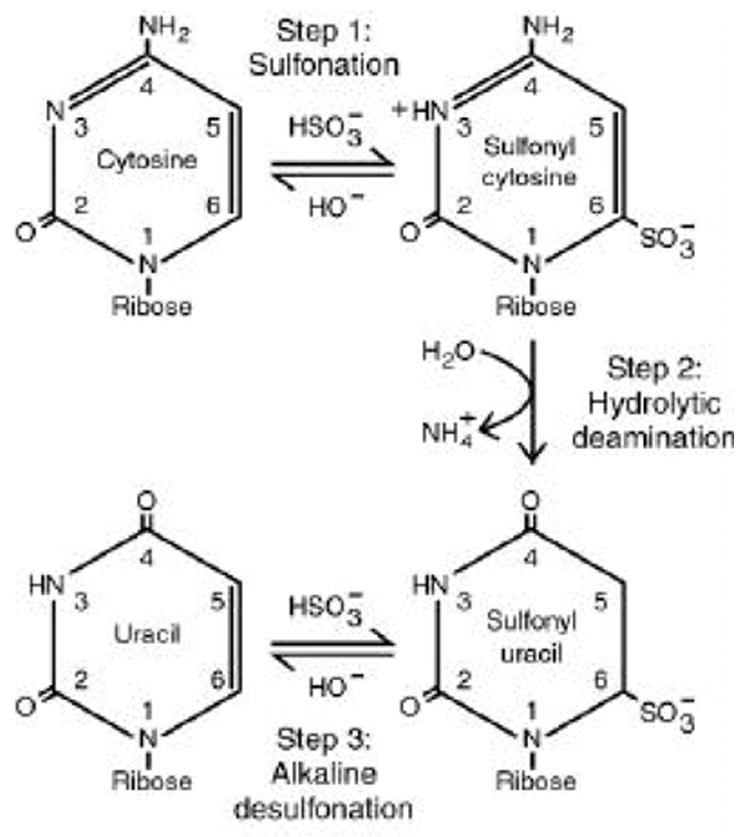
The bisulfite conversion reaction.
2.1.5. PCR amplification of region of interest from deaminated DNA
Primer design is an important aspect of BGS and several principles should be applied to achieve high-quality results [11,22]. First, as the upper and lower strands of DNA are no longer complementary in deaminated DNA (Fig. 2), different primer sets are required to PCR amplify each strand in separate reactions. Second, primers should also amplify only deaminated but not wild-type DNA by making G to A or C to T transitions as appropriate (see Fig. 2B). Degenerate G/A or C/T bases should be incorporated if potential methylation target sites cannot be avoided in primer design. Long of stretches of thymine or adenine should also be avoided, as they reduce the specificity of primer annealing. Finally, primer Tm values should be approximately 55 °C as calculated using nearest-neighbor thermodynamic values for each DNA dinucleotide step [23], a common feature of primer design software packages.
Figure 2.
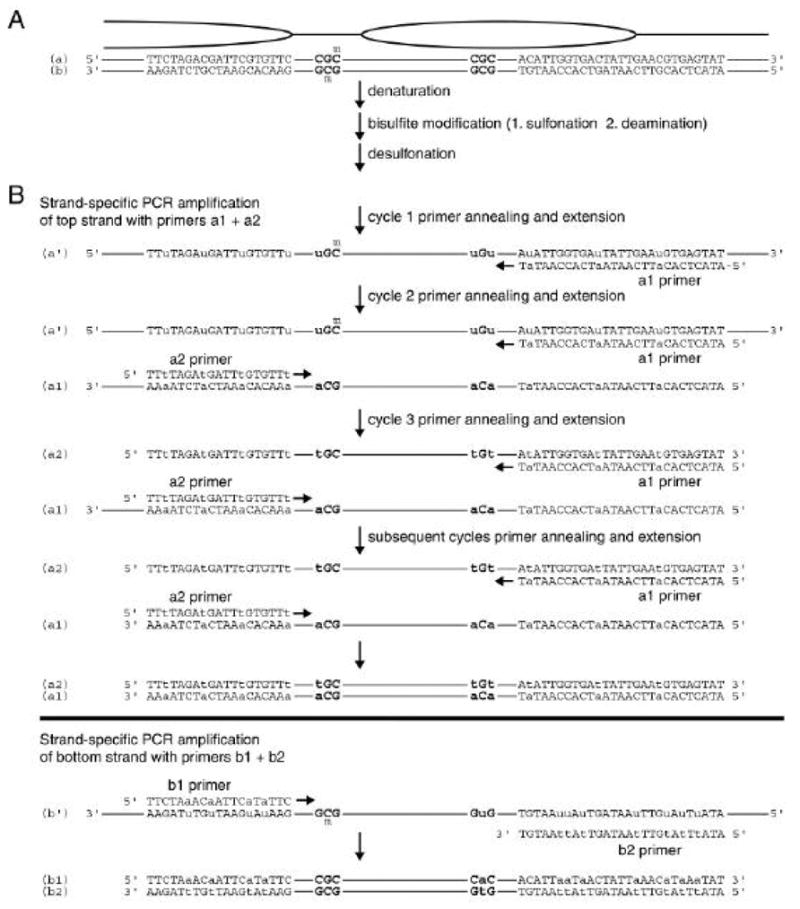
Bisulfite conversion and PCR amplification in the BGS procedure. (A) A hypothetical region of chromatin with an accessible, and hence methylated (m), M.CviPI target site (GpC), and an unmodified site where accessibility is hindered by a positioned nucleosome (ellipse). Total genomic DNA is fully denatured to upper (a) and lower (b) strands and subjected to bisulfite conversion, as detailed in Figure 1. (B) Strand-specific PCR amplification of bisulfite-converted DNA. Unmodified cytosines have been deaminated to uracil (lower case in the upper part of each of the two subpanels in B) to yield non-complementary upper (a') and lower (b') DNA strands. Primer pairs ‘a1’ and ‘a2’ or ‘b1’ and ‘b2’ are used to amplify, in separate reactions, the region of interest from the deaminated DNA. The a1 and b1 primers have guanine to adenine (G to a) transitions, whereas the a2 and b2 primers replace cytosine with thymine (C to t). Remaining cytosines are detected by thermal cycle sequencing of the PCR product in the presence of ddGTP using a1 or b1 primers that have been end labeled with 32P (see Methods, Section 2.1.6).
As the deaminated DNA is single-stranded, ‘hot-start’ PCR amplification must be employed. We use the following conditions (final concentrations): 1× JumpStart Taq buffer, 2.25–3 mM MgCl2 (more is typically required than is used in conventional PCR), 0.2 mM dNTPs, 0.8 μM of each primer, 1.25 U JumpStart Taq (Sigma), 1–3 μl of deaminated genomic DNA and distilled H2O (dH2O) to 50 μl total volume. The PCR cycling parameters are: 94 °C for 3 min; 30 cycles of i) 94 °C for 45 s, ii) ~5 °C below the calculated Tm for 45 s and iii) 72 °C for 1 min per kilobase amplified; and a final extension at 72 °C for 5 min. PCR products should be analyzed by agarose gel electrophoresis for a pure product of the correct size. PCR amplification conditions must be optimized to eliminate non-full-length products. Purification of homogeneous PCR products by Millipore Montage PCR filters, as directed by the manufacturer, produces superior sequencing results compared to resin-based methods as potential residual contamination by chaotropic salts is avoided. PCR products are eluted from the filter by addition of 20–30 μl 0.1× TE, pH 8.0. The product can also be gel purified if PCR optimization does not result in a product of high purity.
2.1.6. Detection of m5C residues in populations (MAP) by thermal cycle sequencing
In MAP, the relative amount of m5C and hence degree of MTase accessibility of each target site is determined by direct thermal cycle sequencing of the PCR product population, using a primer specific to the strand of interest (see Fig. 2). Best results are usually obtained with primers that are internal to the original PCR amplification primer. We use a1 or b1 primers that anneal to deaminated DNA and are end labeled with 32P, but substituting 33P should work equally as well. Primers are end labeled as follows: 1× T4 polynucleotide kinase buffer, 20 pmol primer, 80 μCi [γ-32P] ATP (6000 Ci/mmol), 10 U polynucleotide kinase and dH2O to 20 μl total volume. After incubation for 1 h at 37 °C, the primer is purified through a Sephadex G-50 spin column.
Conditions (final concentrations) for thermal cycle sequencing are: 1× Sequitherm buffer, 50 μM in dATP, dCTP and dTTP, 150 μM ddGTP, 1 pmol radiolabeled a1 or b1 primer (Fig. 2), 0.1 pmol purified PCR product, 1.25 U Sequitherm DNA polymerase (Epicentre, Madison, WI) and dH2O to 8 μl total volume. In principle, ddCTP could be substituted for ddGTP and a2 or b2 for a1 or b1 primers, respectively (i.e. the primer, terminator and template strand must be matched). In either case, the ddGTP (or ddCTP) has to be of high purity (e.g. GE Healthcare ultrapure) to yield good results, as that from many commercial sources is significantly contaminated with dGTP (or dCTP). Sequencing ladders are produced by adding a 4 μl mixture of 1.5× Sequitherm buffer, 1–2 pmol of the same radiolabeled primer, 0.2–0.3 pmol purified PCR product and 1.25 U Sequitherm DNA polymerase to 2 μl each of the ddATP, ddTTP and ddCTP Sequitherm sequencing mixes in separate tubes. The cycling parameters are: 94 °C for 2 min; 12 cycles of i) 94 °C for 30 s, ii) ~5 °C below the calculated Tm for 30 s and iii) 70 °C for 1 min. After completion, 0.5 volume of 3× sequencing stop solution is added to each sample, followed by gentle vortexing. Samples can be stored –20 °C with appropriate plexiglas shielding.
Samples are denatured for 5 min at 70 °C and quick chilled on ice prior to resolving 4 μl per lane on a 4–6% (w/v) polyacrylamide (19:1 (w/w) acrylamide:bis-acrylamide), 50% (w/v) urea sequencing gel buffered with 1× Tris-borate EDTA (TBE). Electrophoresis is performed at 60 W under conditions that establish an external gradient [24], which significantly increases the resolution of higher molecular-weight products: top chamber buffer, 0.5× TBE; lower chamber buffer, 0.66× TBE plus 1–1.5 M NaOAc. Under these conditions, the extension products and tracking dyes migrate as in standard denaturing polyacrylamide electrophoresis [25], except that unextended primer and lower molecular-weight products are compressed at the bottom of the gel rather than running off into the lower buffer chamber. Thus, particular precaution should be taken to avoid contact with this area of the gel during disassembly and drying for visualization by phosphorimager.
2.1.7. MAP-IT for detection of m5C residues in single molecules
Rather than proceeding directly to the sequencing of PCR products, MAP-IT takes advantage of a well-defined capability of BGS; obtaining the methylation status of every MTase target site in clonally propagated single molecules. Cloned products can be obtained by ligation to a T-tailed vector, if standard fluorescent sequencing with dideoxy fluorescent dye terminators is to be performed and insert orientation is not a factor. If the primers used to PCR amplify the region of interest from the deaminated DNA contain restriction sites for cloning, the same amplicons sequenced in the MAP assay can also be cloned and sequenced in the MAP-IT assay. We frequently incorporate different restriction sites into the 5' end of each PCR primer to allow directional cloning and blue/white screening. Directional cloning bypasses the need to screen for insert orientation and is required for thermal cycle sequencing when using a single terminator and universal sequencing primer that anneals to the cloning vector [9].
For MAP-IT, it is advisable that products from at least three separate amplifications are pooled for cloning to minimize stochastic differences between PCR reactions [20]. Prior to cloning, PCR products with restriction enzyme sites at their ends are purified by any standard procedure and digested with the appropriate enzymes under conditions specified by the manufacturer. The insert is ligated to 30–50 ng of vector that has been digested with the same restriction enzymes at a 1:1 to 3:1 ratio of insert to vector. Transformation of chemically competent E. coli is usually sufficient to obtain enough cloned PCR products from each sample. The number of colonies to be analyzed will largely depend on the experiment and desired level of statistical significance. Qualitative results for a given sample can generally be obtained by sequencing about 10 cloned molecules.
A region of interest or the entire cloned insert is sequenced following its PCR amplification from isolated E. coli colonies. After transformation, single colonies are resuspended in 25 μl sterile dH2O. The conditions (final concentrations) for colony PCR amplification are: 1× thermophyllic DNA polymerase buffer (Promega), 1.5 mM MgCl2, 0.2 mM dNTPs, 0.5 μM of each primer, 1.25 U Taq DNA Polymerase (Promega), 1 μl of the resuspended cells and dH2O to 20 μl total volume. The cycling parameters are: 94 °C for 8 min; 30 cycles of 94 °C for 1 min, ~5 °C below the calculated Tm for 1 min, and 72 °C for 1 min per kilobase amplified; and a final extension of 72 °C for 10 min. PCR products (5 μl) are purified by addition of 2 μl ExoSAP-IT (USB) and incubation at 37 °C for 15 min followed by 80 °C for 15 min. Cytosines in the template strand corresponding to m5C residues in the source DNA are detected by direct thermal cycle sequencing of the PCR products amplified from cloned molecules as indicated in Section 2.1.5, except that 2–20 μM dGTP (increasing with cytosine content) is added to each reaction to decrease ddGTP incorporation. Sequencing extension products are resolved by denaturing polyacrylamide electrophoresis with an external gradient as described in Section 2.1.6.
2.2. MAP-IT in mammalian nuclei
M.SssI has recently been used as a chromatin structure probe at an unmethylated CpG island in human tissue culture cells [7]. However, due to the identical specificity of M.SssI and vertebrate MTases, e.g. Dnmt1, the prokaryotic enzyme cannot be used to probe chromatin at regions containing m5CpG. For example, the genome of vertebrate gametes, imprinted regions and tumor suppressor genes in cancerous cells, often contain considerable levels of m5CpG [26]. For such regions, it would be highly advantageous to use an enzymatic probe that recognizes sites other than CpG, especially one with short recognition specificity. Therefore, we have employed M.CviPI [17], recognizing GpC, as a probe in mammalian nuclei of the human SIM2 gene, which has tumor suppressor activity in breast tissue [27].
2.2.1. Isolation of mammalian nuclei and probing with M.CviPI
Immortalized MCF-10A cells are maintained in DMEM/F-12 supplemented as indicated in the Appendix. To harvest the cells, they are washed with warm phosphate-buffered saline (PBS) after aspirating the growth medium, released from the plate by treatment with warm trypsin at 37 °C for 5 min and collected in a 50-ml conical tube. Subsequently, the cells are pelleted at 200 × g for 2 min at 4 °C, the media is aspirated, and the cell pellet is washed with ice cold PBS. Cells (5 × 10⁶) are lysed by addition of 0.5 ml Promega lysis buffer and incubation on ice for 5 min. Nuclei are pelleted by centrifugation at 500 × g for 5 min at 4 °C before each of two washes with ice cold Promega lysis buffer and two subsequent washes with methylation buffer. Nuclei are then resuspended in 100 μl methylation buffer. In executing variations on this protocol, the impact of buffer components and their concentrations should be considered, as solution conditions can dramatically affect the compaction and solubility of chromatin. For example, the concentration of free divalent cation (e.g. Mg2+) should not exceed 1 mM in order to avoid substantial precipitation of chromatin [28,29]. However, note that the absence of Mg2+ increases the DNA-binding affinity and processivity of M.SssI [30].
Nuclei (107 in 100 μl total volume) are prewarmed at 37 °C for 10 min and then treated with 10 U (10 μl at 1 U/μl) M.CviPI at 37 °C for 20 min. The methylation reaction is terminated by adding an equal volume of termination solution prewarmed to 70 °C followed by incubation at 70 °C for 10 min.
2.2.2. Isolation of mammalian genomic DNA and BGS
Genomic DNA is isolated using the Promega Wizard genomic DNA purification kit as follows. Nuclei lysis solution (600 μl) is added and mixed by pipetting until no visible clumps of nuclei remain. Samples are then treated with 3 μl RNase A solution, followed by mixing by inversion, incubation for 15–30 min at 37 °C and cooling to RT for 5 min. Then, 200 μl protein precipitation solution is added, vortexed vigorously for 20 s and chilled on ice for 5 min. Precipitated protein is pelleted by centrifugation at 16,000 × g for 4 min. The supernatant containing the DNA is removed and transferred to a new 1.7-ml microcentrifuge tube already containing 600 μl isopropanol. When the DNA is visible following gentle inversion of the tube, it is pelleted by centrifugation for 1 min at 16,000 × g at RT. The supernatant is decanted, the DNA pellet is washed with 600 μl 70% EtOH:30% 0.1× TE, pH 8.0 and the wash is carefully removed. After the pellet is air dried for 10–15 min, 100 μl DNA rehydration solution is added and then the sample is incubated overnight at 4 °C. DNA (0.5–2 μg) is digested according to the manufacturer's suggestions in 20 μl with a restriction enzyme that cuts frequently in the genome but not between PCR primer binding sites. The entire digestion reaction is directly deaminated following denaturation exactly as described in Section 2.1.4. The desired region is PCR amplified (see Section 2.1.5), then cloned, amplified by colony PCR and sequenced as described above (see Section 2.1.7).
2.3. Data analysis
In MAP analysis of populations, the intensity of each product in sequencing gels is proportional to the amount of m5C that was introduced at a particular site in vivo. This is because it is maintained as m5C during bisulfite treatment and is subsequently replicated as cytosine via PCR amplification [10,11]. Primer extensions that fail to terminate during sequencing of the PCR product, either because templates lack cytosine or ddGTP fails to incorporate at template cytosines, yield the run-off product of lowest mobility in each sequencing lane. While the thermal cycle sequencing conditions described in Section 2.1.6 have improved the quality of our earlier results [3], the termination efficiencies of ddGTP at template cytosines are somewhat lower, at about 60% [9]. Thus, MAP displays the relative accessibilities of sites throughout a population, which yields much information about the chromatin structure of a region. At low levels of m5C that approximate single-hit kinetics, semi-quantitative ‘percent signals’ can be determined by normalizing the intensity of a given band to all summed intensities above it, including the run-off band, in a sequencing lane [9]. Accurate quantification of percent signals at higher amounts of m5C, or at regions increasingly removed from the primer annealing site, requires primer walking (see Fig. 3). In these situations, or if the question being addressed requires determination of MTase accessibility in single molecules, then the more quantitative assay of MAP-IT is employed. Absolute methylation frequencies are obtained by summing the number of m5C residues at each site in a set of cloned and sequenced templates. In sections 2.3.1 and 2.3.2, we give specific examples for MAP in yeast and MAP-IT in mammalian cell nuclei, respectively, which can be used as positive controls (primer sequences provided on request). For a side-by-side of MAP and MAP-IT of the same region, the yeast PHO5 promoter, consult Jessen et al. [9].
Figure 3.
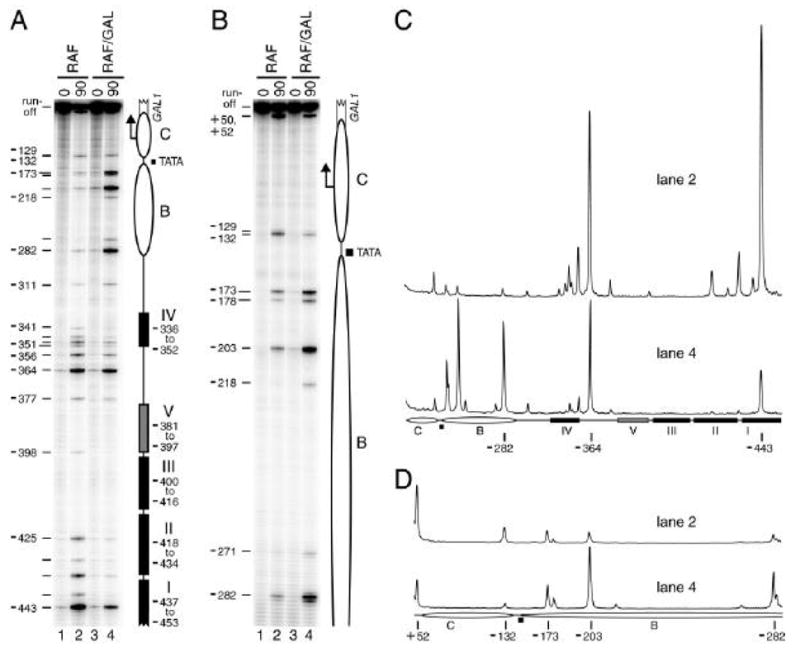
MAP analysis of the non-induced and induced GAL1 promoter. Cells grown under non-inducing (CSM-raffinose, RAF, lanes 1 and 2) or inducing conditions (CSM-raffinose plus galactose, RAF/GAL, lanes 3 and 4) were subsequently left untreated (0 min, lanes 1 and 3) or treated with 100 nM E2 for 90 min to induce M.CviPI synthesis (lanes 2 and 4). The bisulfite sequencing results are shown in the phosphorimages (A, B) or respective quantitative scans (C, D) of the indicated lanes. Improved resolution of bands near the top of the gel in A was obtained by re-extension with an internal primer (i.e. walking) in B. Ellipses, positioned nucleosomes B and C; filled rectangles, Gal4 binding sites I–IV; gray rectangle, Gal4 binding site V (detected previously only by photoaffinity footprinting [43]); filled square, TATA box; bent arrow, major transcription initiation site; and open broken rectangle, GAL1 coding sequence. Nucleotide distances of cytosines in select GpC sites relative to the GAL1 ATG translation start codon are indicated at the left of each phosphorimage and below each pair of scans.
2.3.1. MAP analysis of the GAL1 promoter
The GAL1 promoter is organized into two positioned nucleosomes, B and C, located downstream of the histone-free UASG region, which contains several known binding sites for the transactivator Gal4 [31]. M.CviPI was expressed in vivo to perform MAP analysis of the basally-expressed and induced GAL1 promoter (Fig. 3). Yeast starter cultures were grown at 30 °C with shaking in complete synthetic medium (CSM) containing the trisaccharide raffinose as the sole carbon source. Under these non-repressing conditions, Gal4 associates at GAL1, but transcription is not stimulated as the inducer galactose is absent [31–34]. Following overnight growth in CSM-raffinose, the cells were pelleted, washed and resuspended for 8 h at 30 °C in either CSM-raffinose or CSM-raffinose plus galactose to induce GAL1 transcription. During the last 90 min of this 8-h incubation, M.CviPI expression was either not induced (0 min) or induced for 90 min by addition of 100 nM 17β-estradiol. Genomic DNA was harvested and processed for MAP analysis as described in Sections 2.1.3 to 2.1.6.
Consistent with previous results [6], under galactose-free conditions where GAL1 is uninduced, methylation by M.CviPI at GAL1 accumulated preferentially in the histone-free UASG region (–453 to –3336) as compared to sequences occupied by positioned nucleosome B (Fig. 3A, compare lane 2 to 1). Protection against M.CviPI methylation at the C nucleosome cannot be evaluated as there are no GpC sites, a relatively rare occurrence for a nucleosome-length region. Upon induction of GAL1 in galactose-containing media, m5C increased at six GpC sites in the B nucleosome (Fig. 3; compare lanes 4 to 2), demonstrating chromatin remodeling presumably due to recruitment of coactivator complexes [33,34].
Significant protection of GpC sites from –443 to –341 in UASG against modification by M.CviPI was also reproducibly observed at GAL1 in the galactose-treated cells (Figs. 3A, C; compare lanes 4 to 2). This was unexpected as it is widely accepted that the increased expression of Gal4 upon relief of glucose repression is sufficient to elicit full occupancy of UASG [34–36]. We suggest that inhibition of the Gal80 repressor upon binding to galactose, which unmasks the activation domain surface of Gal4 [37], increases UASG occupancy by Gal4. The establishment of an activation domain-dependent network of protein-protein interactions has been observed to increase DNA site occupancy by Gal4 as well as other transactivators [38–41]. Unlike classical footprinting techniques and chromatin immunoprecipitation (ChIP) that assess a ‘snap shot’ of occupancy at a single time point, in this particular application of MAP, MTase expression has been induced over a 90 min period in intact cells. Thus, MAP may be more sensitive in revealing subtle differences in the dissociation rate constants of protein-DNA complexes under various conditions. In support of this argument, the MAP data in Figure 3 clearly show a greater extent of protection against methylation by M.CviPI of the two high-affinity Gal4 sites I and II compared to the weaker-affinity site IV (Figs. 3A, C; compare lanes 4 to 2), faithfully recapitulating previous genomic footprinting results [35,36,42]. An additional low-affinity Gal4 site V in UASG, which had been detected previously only by photoaffinity footprinting [43], was evidenced by protection of site –377 against M.CviPI, providing further evidence of the sensitivity of MAP in detecting DNA-bound factors. Lastly, clear protection of GpC sites –132 and –129 near TATA, either by recruited TATA-binding protein [44,45] or other components of the assembled transcription preinitiation complex, is observed after galactose induction (Figs. 3B, D; compare lanes 4 to 2).
2.3.2. MAP-IT analysis of a region of the mammalian SIM2 gene
The human breast tumor suppressor gene SIM2 contains a 19-kilobase CpG island that spans exons one and two [46]. Single-molecule MAP-IT analysis of the bottom DNA strand of a part of exon one of SIM2 (+1201 to +1389 relative to the transcription initiation site) for nine cloned molecules is shown in Figure 4. Nuclei prepared from mammalian MCF-10A cells were treated with M.CviPI (see Section 2.2.1), genomic DNA was purified (see Section 2.2.2) and treated with sodium metabisulfite (see Section 2.1.4) and SIM2 sequences were PCR amplified from the deaminated DNA in three separate reactions (see Section 2.1.5). The PCR reactions were pooled, and individual molecules were cloned and sequenced to assign the methylation status of all cytosines (see Section 2.1.7). Each of the nine scored molecules was derived from an independent gene in a cell, as all contained a unique methylation pattern. In the representation of the methylation pattern of each cloned molecule (Fig. 4), m5C residues in GpCpG sites are omitted, as their modification cannot be unequivocally ascribed to M.CviPI (GpC) or endogenous MTases (CpG). In contrast, all unmethylated cytosines are retained in the display. Applying these conventions, CpG sites 1 to 13 were completely unmethylated by endogenous MTases in all nine analyzed single molecules obtained from the MCF-10A cells. In this same region, on average, 3.8 (range, 1–10) GpCs were accessed and methylated during the treatment of nuclei with M.CviPI, demonstrating an ‘open’ chromatin configuration. By contrast, adjacent to CpG sites 14 and 16 that are partially methylated among the 9 clones, two GpC sites were completely unmethylated by M.CviPI, suggesting a transition to a more closed chromatin structure. This conclusion requires further comparison to M.CviPI-treated protein-free DNA. This control and additional studies are ongoing to more fully define the chromatin structure of the first exon and other regions of the SIM2 gene. Nevertheless, these MAP-IT data provide the first proof-of-principle that chromatin accessibility and endogenous CpG methylation can be determined at the level of single molecules.
Figure 4.
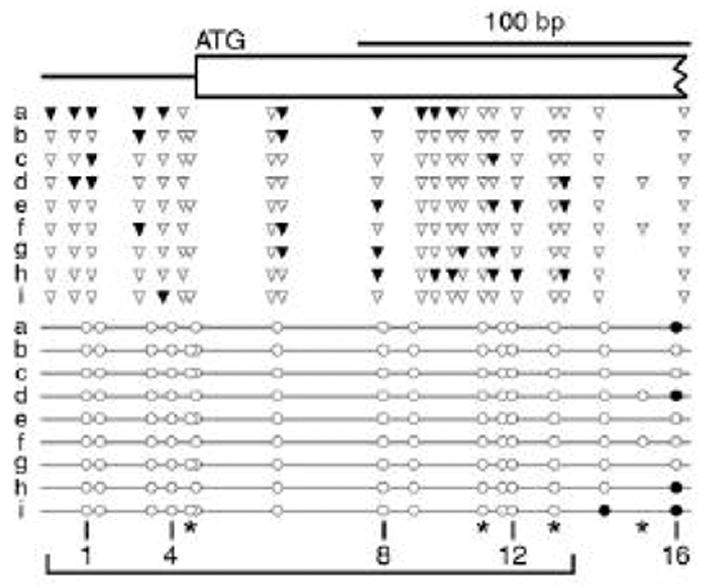
MAP-IT analysis of part of exon 1 of the human SIM2 gene. Nuclei isolated from MCF-10A cells were treated with M.CviPI followed by BGS of sequences encompassing +1,209 to +1,389 relative to the SIM2 transcription initiation site. Nine independent clones from the PCR amplicon (lettered a–i) were sequenced to determine the methylation status of all sites for both endogenous MTases (CpGs, circles) and M.CviPI (GpCs, triangles). Methylated and unmethylated residues are indicated by filled and open symbols, respectively. Methylated cytosines in GpCpG sites (marked by asterisks) are omitted, as modification cannot be unequivocally ascribed to endogenous MTases or M.CviPI. A proposed open region from +1,209 to +1,318 is bracketed. The SIM2 exon 1 sequence is represented as a broken rectangle.
As in all footprinting experiments, the level of probe modification in MAP-IT has a profound effect on data interpretation. Classical, population-based footprinting studies typically employ low concentrations of probe to achieve single-hit conditions that yield an average of 0.5 modifications per molecule. These conditions are inappropriate for MAP-IT analysis in that according to Poisson statistics ~60% of molecules would be predicted to contain zero m5C residues and thus no useful data. A distinct advantage of MAP-IT single-molecule analysis over classical approaches is that the higher levels of probe modification do not impede accurate quantification of accessibility. To the contrary, increased levels of methylation benefit single-molecule analysis in that they reduce the incidence of false positives: sites that appear bound by protein(s) but are not. Additionally, kinetic differences in site methylation [3] are not as apparent at high probe concentrations. In the case of our MAP-IT data in Figure 4, although higher than single-hit levels of methylation by M.CviPI are present, several single molecules (b–f and i in the top panel) have spans of >100 bp that are devoid of m5C. As this SIM2 region is quite accessible to M.CviPI on the whole, it seems unlikely that these spans of protection correspond to individual positioned nucleosomes. However, using about 6-fold more units of MTase (M.SssI) than we have employed, protected ‘patches’ (≥2 consecutive unmethylated CpGs flanked by ≥2 consecutive m5CpGs) at the p16 gene in nuclei were attributed to positioned nucleosomes on single molecules [7]. While further studies in defined biochemical systems are needed to verify this interpretation, it is clear that the probe concentration must be chosen with regard to experimental goals. For example, achieving comparably high levels of methylation in vivo are currently precluded as they can lead to growth defects. Furthermore, making comparisons between independent samples requires that methylation be normalized to that at an unlinked region, one not subject to the same regulation as the experimental region of interest. Lastly, caution needs to be exercised in challenging samples with too much enzymatic probe as competition between MTases and chromatin-associated factors for sites can produce false negatives: sites normally bound by factors that are not protected against methylation. For example, we frequently observe that MTase overexpression can lead to 'invasion' of some positioned nucleosomes via mass action (unpublished observations).
Several further aspects should be considered when single-molecule MAP-IT results are desired. Appropriate controls should be performed to limit BGS-associated artifacts [20], as this procedure is an integral part of MAP-IT (as well as MAP). If in vivo MTase expression is employed, the expression construct should be integrated to ensure that all cells inherit it as a single copy. Along these lines, it is imperative that the MTase is induced by a system that ensures relative uniformity in expression across the population, as opposed to a binary induction scheme, e.g. induction under control of the GAL1 promoter by transfer from glucose to galactose [47]. Likewise, strategies to deliver the MTase such as permeabilization or transfection must be highly efficient to minimize the number of single DNA molecules that are devoid of probe-mediated methylation. Sample size must also be carefully scrutinized to be certain that the analyzed pool of single molecules is representative of the general population. We previously showed that the summed m5C at each MTase target site among 50 cloned molecules recapitulated the relative MTase accessibility patterns seen in the population at the PHO5 promoter [9]. Finally, methods must be devised to ensure that molecules in a cloned pool are derived from single molecules in the source DNA rather than from duplication during PCR amplification [48].
3. Concluding remarks
DNA MTases are highly effective probes of chromatin structure with distinct advantages over more classical techniques. Their introduction of a relatively non-intrusive methyl group, rather than damage, into DNA qualifies them as the least invasive of known probes. Thus, MTases are well suited for chromatin investigations in the most biologically relevant in vivo environment, that of the living cell. By combining MTase probing with the BGS procedure to assay DNA methylation, strategies have been developed for detecting subtle quantitative differences in non-histone protein-DNA interactions as well as in positioned nucleosomes. Chromatin accessibility can be assayed in a conventional population-ensemble format (MAP assay) as well as a powerful format that goes beyond populations to provide a unique view of MTase accessibility in single molecules (MAP-IT). Resolution for these techniques in budding yeast is currently about 12 15 bp in S. cerevisiae, and is significantly improved at mammalian CpG islands that are also highly enriched in GpC sequences. The discovery of additional enzymes, especially ones that do not introduce methylation at CpGs, will further increase the utility of MAP and MAP-IT.
The choice to use MAP, MAP-IT or both largely depends on whether the hypothesis being tested warrants the additional effort and expense of cloning and sequencing many independent molecules. MAP-IT is not constrained by the classical limit of single-hit kinetic levels of modification, and thus provides a more quantitative view of probe accessibility than all other available footprinting techniques. The single-molecule capability of MAP-IT is ideal for deconvoluting the heterogeneity inherent in many biological systems, virtually any situation in chromosome biology where two or more subpopulations may co-exist. Moreover, as the structural integrity of DNA molecules is maintained, a number of formerly unapproachable questions can now be addressed by viewing multiple footprints along a collection of continuous single molecules. It should be emphasized that no other technique can address such questions and many as yet unveiled intricacies in chromatin architecture and protein-DNA interactions are likely to be revealed as MAP-IT is applied in more arenas.
Appendix: equipment and consumables
2.1. MAP and MAP-IT in S. cerevisiae
2.1.1. Preparation of plasmids expressing MTases
Consult Jessen et al. [6].
2.1.2. Expression and screening for activity of C5 DNA MTases in budding yeast
Consult Jessen et al. [6].
2.1.3. Isolation of yeast genomic DNA
Appropriate growth medium.
Ethanol (EtOH). Caution: Highly flammable. Use in a well-ventilated area.
1000× 17 β-estradiol (E2): 105 nM in 95% EtOH. Caution: Toxic and the EtOH solvent is highly flammable. Use in a well-ventilated area.
TE: 10 mM Tris-HCl, pH 8.0, 1 mM EDTA.
Acid-washed glass beads (425–600 μm in diameter). A dispenser can be fashioned from a cut tip of a 1.7-ml microcentrifuge tube and laboratory tape to rapidly dispense 0.3 g glass beads per sample.
Smash buffer: 10 mM Tris-HCl, pH 8.0, 2% Triton X-100, 1 mM EDTA, 1% SDS, 100 mM NaCl.
Chloroform:isoamyl alcohol (CHCl3:IAA). 24:1 (v/v). Caution: Chloroform is a suspected carcinogen, thus wear gloves and safety glasses. Dispose of properly.
Phenol saturated with 0.1 M Tris-HCl, pH 8.0. Store at 4°C. Caution: Highly corrosive and toxic. Wear gloves and safety glasses. Dispose of properly.
10.0 M NH4OAc. The pH should be approximately 7.8 and does not need to be adjusted.
Isopropanol. Caution: Highly flammable. Use in a well-ventilated area and wear gloves.
70% EtOH:30% 0.1× TE, pH 8.0: 70% (v/v) EtOH diluted with 0.1× TE, pH 8.0 (use a value of 95% for absolute EtOH). Caution: Flammable. Use in a well-ventilated area.
0.1× TE.
Vortexer with platform and insert capable of holding several 1.7-ml microcentrifuge tubes.
2.1.4. Chemical deamination of genomic DNA
Degassed dH2O. To decrease the partial pressure of oxygen in water to be used as solvent, dH2O is brought to a boil and used to fill a 125 ml bottle to the brim, which is then tightly capped and cooled to RT. The dH2O can be degassed a few days in advance.
Glass scintillation vials, 20 ml capacity.
3 N NaOH. Freshly prepare before use. Dissolve a few NaOH pellets in degassed dH2O. Avoid vortexing which will cause aeration. Caution: Concentrated solutions of NaOH are caustic. Wear gloves and eye protection.
3 mg/ml sheared calf thymus DNA. Dissolve in sterile TE and shear 10× with a 25 gauge needle. Store at −20°C.
3× denaturation buffer (per sample, to be added to 20 μl genomic DNA): 3.0 μl 3 N NaOH, 0.7 μl 3 mg/ml sheared calf thymus DNA, 0.5 μl 0.5 M EDTA, pH 8.0, 5.8 μl degassed dH2O.
100 mM hydroquinone. Make fresh just before use. Weigh 0.05 g hydroquinone and dissolve in 4.5 ml degassed dH2O. Caution: Hydroquinone is toxic and a suspected carcinogen, wear gloves and eye protection. Do not breathe dust. Dispose of safely.
Sodium metabisulfite. We aliquot 0.5–1 kg sodium metabisulfite (Aldrich) and fill 5-g glass vials nearly to the brim using a funnel in an oxygen- and H2O-free chemical safety hood under argon. Cap the vials tightly while they are under argon in the safety hood and store in the dark in a sealed vessel that contains Drierite. It is unnecessary for this vessel to contain argon. The reagent is stable for at least 2 yr. Caution: Bisulfite is mutagenic, thus wear gloves and safety glasses. Dispose of solutions properly.
Promega Wizard PCR Preps resin (cat. #A7181). Caution: The resin contains 6 M guanidine thiocyanate, which is an irritant.
Promega Wizard minicolumns (cat. #A7211).
Promega Vac-Man laboratory vacuum manifold (cat. #A7231).
3 ml Luer-Lok syringes.
80% isopropanol. Caution: Flammable. Use in a well-ventilated area.
0.1× TE.
Desulfonation solution (per sample): 7 μl 3 N NaOH, 1 μl 3 mg/ml calf thymus DNA.
10.0 M NH4OAc.
2.1.5. PCR amplification of region of interest from deaminated DNA
25× DNA oligonucleotides to be used as PCR primers with bisulfite-treated DNA: Dilute to 20 μM in sterile 0.1× TE.
12.5× dNTP mix: 2.5 mM dATP, dCTP, dGTP, and dTTP, diluted in sterile dH2O. Store at −20°C in aliquots of 50–100 μl.
JumpStart Taq DNA polymerase (Sigma).
10× JumpStart Taq DNA polymerase buffer: 100 mM Tris-HCl, pH 8.3, 500 mM KCl. Supplied with enzyme.
25 mM MgCl2, supplied with enzyme.
Millipore Montage PCR Filters (cat. #UFC7PC250).
0.1× TE.
2.1.6. Detection of m5C residues in populations (MAP) by thermal cycle sequencing
Appropriate oligonucleotides for primer extension (see section 2.1.5).
[γ-32P]ATP (6000 Ci/mmole). Caution: Use radioisotope safety precautions.
T4 polynucleotide kinase (New England BioLabs).
10× T4 polynucleotide kinase buffer: 700 mM Tris-HCl, pH 7.6, 100 mM MgCl2, 50 mM dithiothreitol. Supplied with enzyme.
Sephadex G-50 spin columns [25]. It is important to re-equilibrate commercially purchased columns with three washes of sterile dH2O.
Sequitherm DNA polymerase (Epicentre, Madison, WI).
10× Sequitherm DNA polymerase buffer: 0.5 M Tris-HCl, pH 9.3, 25 mM MgCl2.
50× dNTP mix: 2.5 mM each dATP, dCTP, and dTTP; dGTP omitted. Diluted in sterile dH2O.
33.3× GE Healthcare ultrapure ddGTP (cat. #27-2071-01): 5 mM in sterile dH2O.
3× sequencing termination mixes: Each containing 15 μM each dATP, dCTP, dTTP, and 7-deaza-dGTP. In addition, respective termination mixes contain: A mix, 0.23 mM ddATP; C mix, 0.3 mM ddCTP; and T mix, 0.9 mM ddTTP (the G mix is not needed as template cytosines are assayed separately).
3× sequencing stop solution: 95% (v/v) deionized formamide, 10 mM EDTA, pH 7.6, 0.025% (w/v) bromophenol blue, 0.025% (w/v) xylene cyanole FF.
2.1.7. MAP-IT for detection of m5C residues in single molecules
Appropriate restriction endonucleases (New England BioLabs). Store at −20°C.
Appropriate restriction enzyme buffer(s) (New England BioLabs). Supplied with enzymes. Store at −20°C or 4°C.
Appropriate strain of E. coli made competent for DNA transformation.
Appropriate cloning vector.
Appropriate growth medium for selection of positive transformants.
40× DNA oligonucleotides to be used as PCR primers: Dilute to 20 μM in sterile 0.1× TE.
12.5× dNTP mix (see section 2.1.5.).
Taq DNA polymerase (Promega).
10× Taq DNA polymerase buffer: 100 mM Tris-HCl, pH 9.0, 500 mM KCl, 15 mM MgCl2, 1% Triton X-100. Supplied with enzyme. Store at −20°C or 4°C.
ExoSAP-IT (USB Corporation). Store at −20°C.
dGTP (20 μM was included in the sequencing reactions of the molecules in Figure 4).
2.2. MAP-IT in mammalian nuclei
2.2.1. Isolation of mammalian nuclei and probing with M.CviPI
DMEM/F-12 media (Invitrogen cat. #11330-032) supplemented with 5% fetal bovine serum, 1% penicillin, 1% streptomycin, 20 ng/ml EGF, 0.5 μg/ml hydrocortisone, 100 ng/ml cholera toxin and 10 μg/ml insulin.
Phosphate-buffered saline (PBS): 137 mM NaCl, 2.7 mM KCl, 4.3 mM Na2HPO4, 1.4 mM KH2PO4.
Trypsin.
5× Promega reporter lysis buffer (cat. #E3971).
β-mercaptoethanol. Caution: Toxic and flammable. Use in a well-ventilated area.
32 mM S-adenosyl-L-methonine (SAM): Store at −20°C.
100 mM phenylmethylsulfonyl fluoride (PMSF): Dissolve in isopronanol. Caution: Highly flammable. Use in a well-ventilated area.
Methylation buffer: 30 mM Na-HEPES, pH 7.8, 70 mM NaCl, 0.45% glycerol, 1 mM β-mercaptoethanol, 0.24 mM PMSF, 0.12 mM EGTA, pH 8.0, 0.024 mM EDTA, pH 8.0, 160 μM SAM. Add β-mercaptoethanol, PMSF and SAM fresh before use. Caution: β-mercaptoethanol and PMSF are toxic and flammable. Wear gloves and safety glasses.
M.CviPI [17], 1 U/μl. Store at −20°C.
Termination solution: 1% SDS, 10 mM EDTA, pH 8.0, 100 mM NaCl.
2.2.2. Isolation of mammalian genomic DNA and BGS
Promega Wizard genomic DNA purification kit (cat. #A1120).
Promega nuclei lysis solution (cat. #A7941).
Promega RNase A solution, 4 mg/ml (cat. #A7973).
Promega protein precipitation solution (cat. #A7951).
Isopropanol. Caution: Highly flammable. Use in a well-ventilated area and wear gloves.
70% EtOH:30% 0.1× TE, pH 8.0. Caution: Flammable. Use in a well-ventilated area.
Promega DNA rehydration solution (cat. #A7963): 10 mM Tris-HCl, pH 7.4, 1 mM EDTA, pH 8.0.
Appropriate restriction endonuclease(s) (New England BioLabs). Store at −20°C.
Appropriate restriction enzyme buffer(s) (New Englad BioLabs). Supplied with enzyme(s). Store at −20°C or 4°C.
2.3. Data analysis
Storm 860 phosphorimager or equivalent.
ImageQuant software or equivalent.
2.3.1. MAP analysis of the GAL1 promoter
YPD rich medium: 1% yeast extract (US Biological), 2% Bacto-peptone, 2% glucose. Dissolve in dH2O, measure to volume, and autoclave for 20 min. For plates, add 20 g/l agar prior to autoclaving. Pour plates aseptically, invert after cooling, and dry at RT for 2–3 d. Plates can be wrapped and stored for many months at 4°C.
Complete synthetic medium (CSM)-raffinose: Per liter add 6.7 g yeast nitrogen base (YNB) with ammonium sulfate and without amino acids (US Biological), 20 g raffinose and appropriate CSM supplement mix (Bio101, Vista, CA; the amount to add is indicated on the container label). Measure to volume and filter sterilize. Liquid medium can be stored at RT.
CSM-raffinose plus galactose: CSM-raffinose with 20 g/l galactose. Dissolve in dH2O, measure to volume, and filter sterilize.
1000× 17 β-estradiol (E2): 105 nM in 95% EtOH. Caution: Toxic and the EtOH solvent is highly flammable. Use in a well-ventilated area.
Footnotes
Publisher's Disclaimer: This is a PDF file of an unedited manuscript that has been accepted for publication. As a service to our customers we are providing this early version of the manuscript. The manuscript will undergo copyediting, typesetting, and review of the resulting proof before it is published in its final citable form. Please note that during the production process errors may be discovered which could affect the content, and all legal disclaimers that apply to the journal pertain.
References
- 1.Gottschling DE. Proc Natl Acad Sci USA. 1992;89:4062–4065. doi: 10.1073/pnas.89.9.4062. [DOI] [PMC free article] [PubMed] [Google Scholar]
- 2.Singh J, Klar AJS. Genes Dev. 1992;6:186–196. doi: 10.1101/gad.6.2.186. [DOI] [PubMed] [Google Scholar]
- 3.Kladde MP, Xu M, Simpson RT. EMBO J. 1996;15:6290–6300. [PMC free article] [PubMed] [Google Scholar]
- 4.Xu M, Simpson RT, Kladde MP. Mol Cell Biol. 1998;18:1201–1212. doi: 10.1128/mcb.18.3.1201. [DOI] [PMC free article] [PubMed] [Google Scholar]
- 5.Carvin CD, Dhasarathy A, Friesenhahn LB, Jessen WJ, Kladde MP. Proc Natl Acad Sci USA. 2003;100:7743–7748. doi: 10.1073/pnas.1332672100. [DOI] [PMC free article] [PubMed] [Google Scholar]
- 6.Jessen WJ, Dhasarathy A, Hoose SA, Carvin CD, Risinger AL, Kladde MP. Methods. 2004;33:68–80. doi: 10.1016/j.ymeth.2003.10.025. [DOI] [PubMed] [Google Scholar]
- 7.Fatemi M, Pao MM, Jeong S, Gal-Yam EN, Egger G, Weisenberger DJ, Jones PA. Nucleic Acids Res. 2005;33:e176. doi: 10.1093/nar/gni180. [DOI] [PMC free article] [PubMed] [Google Scholar]
- 8.Hoose SA, Kladde MP, Bina M, editors. Methods in Molecular Biology. Vol. 338. Humana Press; Totowa, NJ: 2006. pp. 225–244. [DOI] [PubMed] [Google Scholar]
- 9.Jessen WJ, Hoose SA, Kilgore JA, Kladde MP. Nat Struct Mol Biol. 2006;13:256–263. doi: 10.1038/nsmb1062. [DOI] [PubMed] [Google Scholar]
- 10.Frommer M, MacDonald LE, Millar DS, Collis CM, Watt F, Grigg GS, Molloy PL, Paul CL. Proc Natl Acad Sci USA. 1992;89:1827–1831. doi: 10.1073/pnas.89.5.1827. [DOI] [PMC free article] [PubMed] [Google Scholar]
- 11.Clark SJ, Harrison J, Paul CL, Frommer M. Nucleic Acids Res. 1994;22:2990–2997. doi: 10.1093/nar/22.15.2990. [DOI] [PMC free article] [PubMed] [Google Scholar]
- 12.Dong L, Wang W, Wang F, Stoner M, Reed JC, Harigai M, Samudio I, Kladde MP, Vyhlidal C, Safe S. J Biol Chem. 1999;274:32099–32107. doi: 10.1074/jbc.274.45.32099. [DOI] [PubMed] [Google Scholar]
- 13.Duan R, Porter W, Samudio I, Vyhlidal C, Kladde M, Safe S. Mol Endocrinol. 1999;13:1511–1521. doi: 10.1210/mend.13.9.0338. [DOI] [PubMed] [Google Scholar]
- 14.Vyhlidal C, Samudio I, Kladde M, Safe S. J Mol Endocrinol. 2000;24:329–338. doi: 10.1677/jme.0.0240329. [DOI] [PubMed] [Google Scholar]
- 15.Samudio I, Vyhlidal C, Wang F, Stoner M, Chen I, Kladde M, Barhoumi R, Burghardt R, Safe S. Endocrinology. 2001;142:1000–1008. doi: 10.1210/endo.142.3.8022. [DOI] [PubMed] [Google Scholar]
- 16.Renbaum P, Abrahamove D, Fainsod A, Wilson GG, Rottem S, Razin A. Nucleic Acids Res. 1990;18:1145–1152. doi: 10.1093/nar/18.5.1145. [DOI] [PMC free article] [PubMed] [Google Scholar]
- 17.Xu M, Kladde MP, Van Etten JL, Simpson RT. Nucleic Acids Res. 1998;26:3961–3966. doi: 10.1093/nar/26.17.3961. [DOI] [PMC free article] [PubMed] [Google Scholar]
- 18.Dorner LF, Schildkraut I. Nucleic Acids Res. 1994;22:1068–1074. doi: 10.1093/nar/22.6.1068. [DOI] [PMC free article] [PubMed] [Google Scholar]
- 19.Proffitt JH, Davie JR, Swinton D, Hattman S. Mol Cell Biol. 1984;4:985–988. doi: 10.1128/mcb.4.5.985. [DOI] [PMC free article] [PubMed] [Google Scholar]
- 20.Warnecke PM, Stirzaker C, Song J, Grunau C, Melki JR, Clark SJ. Methods. 2002;27:101–107. doi: 10.1016/s1046-2023(02)00060-9. [DOI] [PubMed] [Google Scholar]
- 21.Hayatsu H. Prog Nucleic Acid Res Mol Biol. 1976;16:75–124. doi: 10.1016/s0079-6603(08)60756-4. [DOI] [PubMed] [Google Scholar]
- 22.Grunau C, Clark SJ, Rosenthal A. Nucleic Acids Res. 2001;29:e65. doi: 10.1093/nar/29.13.e65. [DOI] [PMC free article] [PubMed] [Google Scholar]
- 23.Breslauer KJ, Frank R, Blocker H, Marky LA. Proc Natl Acad Sci USA. 1986;83:3746–3750. doi: 10.1073/pnas.83.11.3746. [DOI] [PMC free article] [PubMed] [Google Scholar]
- 24.Sheen J, Seed B. Biotechniques. 1998;6:942–944. [PubMed] [Google Scholar]
- 25.Sambrook J, Fritsch EF, Maniatis T. Molecular Cloning: A Laboratory Manual. Cold Spring Harbor Laboratory Press; New York: 1989. [Google Scholar]
- 26.Baylin S, Bestor TH. Cancer Cell. 2002;1:299–305. doi: 10.1016/s1535-6108(02)00061-2. [DOI] [PubMed] [Google Scholar]
- 27.Kwak HI, Gustafson T, Metz RP, Laffin B, Schedin P, Porter WW. Carcinogenesis. 2006 July 13; doi: 10.1093/carcin/bgl122. epub ahead of print. [DOI] [PubMed] [Google Scholar]
- 28.Ausio J, Sasi R, Fasman GD. Biochemistry. 1986;25:1981–1988. doi: 10.1021/bi00356a022. [DOI] [PubMed] [Google Scholar]
- 29.Hansen JC, Wolffe AP. Biochemistry. 1992;31:7977–7988. doi: 10.1021/bi00149a032. [DOI] [PubMed] [Google Scholar]
- 30.Matsuo K, Silke J, Gramatikoff K, Schaffner W. Nucleic Acids Res. 1994;22:5354–5359. doi: 10.1093/nar/22.24.5354. [DOI] [PMC free article] [PubMed] [Google Scholar]
- 31.Bash R, Lohr D. Prog Nucleic Acid Res Mol Biol. 2001;65:197–259. doi: 10.1016/s0079-6603(00)65006-7. [DOI] [PubMed] [Google Scholar]
- 32.Johnston M. Microbiol Rev. 1987;51:458–476. doi: 10.1128/mr.51.4.458-476.1987. [DOI] [PMC free article] [PubMed] [Google Scholar]
- 33.Larschan E, Winston F. Genes Dev. 2001;15:1946–1956. doi: 10.1101/gad.911501. [DOI] [PMC free article] [PubMed] [Google Scholar]
- 34.Bhaumik SR, Green MR. Genes Dev. 2001;15:1935–1945. doi: 10.1101/gad.911401. [DOI] [PMC free article] [PubMed] [Google Scholar]
- 35.Giniger E, Varnum SM, Ptashne M. Cell. 1985;40:767–774. doi: 10.1016/0092-8674(85)90336-8. [DOI] [PubMed] [Google Scholar]
- 36.Giniger E, Ptashne M. Proc Natl Acad Sci USA. 1988;85:382–386. doi: 10.1073/pnas.85.2.382. [DOI] [PMC free article] [PubMed] [Google Scholar]
- 37.Ma J, Ptashne M. Cell. 1987;51:113–119. doi: 10.1016/0092-8674(87)90015-8. [DOI] [PubMed] [Google Scholar]
- 38.Vashee S, Kodadek T. Proc Natl Acad Sci USA. 1995;92:10683–10687. doi: 10.1073/pnas.92.23.10683. [DOI] [PMC free article] [PubMed] [Google Scholar]
- 39.Xu H, Kodadek T, Johnston S. Proc Natl Acad Sci USA. 1995;92:7677–7680. doi: 10.1073/pnas.92.17.7677. [DOI] [PMC free article] [PubMed] [Google Scholar]
- 40.Bunker CA, Kingston RE. Proc Natl Acad Sci USA. 1996;93:10820–10825. doi: 10.1073/pnas.93.20.10820. [DOI] [PMC free article] [PubMed] [Google Scholar]
- 41.Tanaka M. Proc Natl Acad Sci USA. 1996;93:4311–4315. doi: 10.1073/pnas.93.9.4311. [DOI] [PMC free article] [PubMed] [Google Scholar]
- 42.Vashee S, Xu H, Johnston S, Kodadek T. J Biol Chem. 1993;268:24699–24706. [PubMed] [Google Scholar]
- 43.Selleck SB, Majors JE. Mol Cell Biol. 1987;7:3260–3267. doi: 10.1128/mcb.7.9.3260. [DOI] [PMC free article] [PubMed] [Google Scholar]
- 44.Kuras L, Struhl K. Nature. 1999;399:609–613. doi: 10.1038/21239. [DOI] [PubMed] [Google Scholar]
- 45.Li XY, Virbasius A, Zhu X, Green MR. Nature. 1999;399:605–609. doi: 10.1038/21232. [DOI] [PubMed] [Google Scholar]
- 46.Osoegawa K, Okano S, Kato Y, Nishimura Y, Soeda E. DNA Res. 1996;3:175–179. doi: 10.1093/dnares/3.3.175. [DOI] [PubMed] [Google Scholar]
- 47.Biggar SR, Crabtree GR. EMBO J. 2001;20:3167–3176. doi: 10.1093/emboj/20.12.3167. [DOI] [PMC free article] [PubMed] [Google Scholar]
- 48.Miner BE, Stoger RJ, Burden AF, Laird CD, Hansen RS. Nucleic Acids Res. 2004;32:e135. doi: 10.1093/nar/gnh132. [DOI] [PMC free article] [PubMed] [Google Scholar]