

Abstract
Optical properties of bovine ocular tissues were determined at laser wavelengths in the visible region. The inverse adding doubling (IAD), Kubelka–Munk (KM), and inverse Monte Carlo (IMC) methods were applied to the measured values of the total diffuse transmission, total diffuse reflection, and collimated transmission to determine the optical absorption and scattering coefficients of the bovine cornea, lens and retina at 457.9 nm, 488 nm, and 514.5 nm laser lines from an argon ion laser. The optical properties obtained from these three methods were compared, and their validity is discussed.
Keywords: Lasers, Bovine ocular tissues, Optical properties
Introduction
In recent years there has been considerable interest in the accurate measurement of the optical properties of ocular tissues and, in particular, scattering and absorption coefficients. These are fundamental optical properties of biological tissues and can be used for the diagnosis of various diseases. Since the application of medical lasers in ocular diseases has steadily increased over the past several years, it is critical that we have a clear understanding of the fundamental optical properties of ocular tissues. The optical properties may, indeed, influence the distribution and propagation of light in a tissue medium. Unfortunately, a systematic study of the optical properties of ocular tissues is lacking. Therefore, we present in this article an in-depth characterization of the optical properties of bovine cornea, lens, and retina.
A number of researchers have described the optical properties of ocular tissues [1–5] from various animals such as cattle and pigs. Furthermore, there have been studies contrasting different models to track light distribution in particular tissues [6–8]. However, to the best of our knowledge, there has never been a study of bovine ocular tissues comparing three models: (a) inverse adding doubling (IAD), (b) inverse Monte Carlo (IMC), and (c) Kubelka–Munk (KM). In concurrence with the three models we were able to provide a more accurate estimate of the optical properties, using the MC model. We employed two integrating spheres to measure the diffuse reflectance, diffuse transmittance, and collimated transmittance, for the cornea, lens, and retina of bovine eyes, at 457.9 nm, 488 nm and 514.5 nm lines from an argon ion laser. These values were subsequently applied to these models to determine scattering and absorption coefficients of bovine corneal, lens and retinal tissues at three visible wavelengths of laser light.
Background theory and computational models
The quantitative distribution of light intensity in biological media can be obtained from the radiative transport equation [9].
| (1) |
where I(r,s) is the intensity per unit solid angle at the target location r in the direction s (s is the unit directional vector), μa and μs are the absorption and scattering coefficients, respectively, p(s,s′) is the phase function, representing contributions due to scattering from the direction s′ to s, and Ω′ is the solid angle. The first term on the right hand side represents the loss in intensity per unit length in the direction s due to absorption and scattering, whereas the second term denotes the gain per unit length due to scattering in the direction s′. The details of the radiative transport equation and the application of the Henyey–Greenstein scattering approximation to biological media can be found in Prahl et al. [10]. Although Eq. (1) is difficult to solve analytically for biological media, due to the inherent inhomogeneities and irregularities in their physical shapes, only an approximate solution can be obtained by assuming homogeneity and regular geometry of the medium, and, thereby, an estimate of the light intensity distribution can be obtained by solving the radiative transport equation.
The form of the phase function p(s,s′) is usually not known for applications, especially for biological media. The Henyey–Greenstein phase function provides a good approximation for turbid media:
| (2) |
where ν = cos(θ), and θ is the angle between s and s′. The Henyey–Greenstein phase function depends only on the scattering anisotropy coefficient and is defined as the mean of the scattering angle:
| (3) |
The scattering anisotropy coefficient can also be obtained as the average cosine of the scattering angle [11]. The value of g ranges from −1 for complete backward scattering to +1 for complete forward scattering. The anisotropy value of 0 indicates isotropic scattering. The phase function is normalized so its integral over all space is unity.
In order to solve the transport equation (1), we require the values of μa, μs, and g. Therefore, an appropriate experimental method is necessary to measure these fundamental optical properties. It is, however, impossible to measure directly either absorption or scattering in a single experiment. This difficult problem of separating the scattering from the absorption in the total attenuation of light flux in a turbid medium such as biological tissue had been resolved by the use of different theoretical models as well as numerical or computational techniques.
Kubelka–Munk method
The one-dimensional, two-flux, KM model [12] has been widely used to determine both the absorption and scattering coefficients of biological media [13–18], provided the scattering is significantly dominant over the absorption. This model provides rather simple mathematical expressions for determining the optical parameters from the measured values of diffuse reflectance and transmission. In the past, researchers have applied the diffusion approximation to the transport equation to study biological media [15, 16]. Most notably, following the KM model and diffusion approximation, an excellent experimental method has been described by Van Gemert et al. for determining the absorption and scattering coefficients.
Inverse adding doubling method
Even though an analytical solution to Eq. (1) is not available, an elaborate numerical solution is possible using the Monte Carlo (MC) simulation technique [1, 19, 20]. Furthermore, an important numerical approach known as the IAD [10] method has been employed to solve the radiative transport equation [9]. Both the IAD method and MC simulation technique have provided more accurate estimates of optical properties (μa, μs, g) for biological tissues than any other models previously used. Since the details are available in the literature, only a synopsis of the IAD method is provided here. Two dimensionless quantities used in the entire process of IAD are the albedo (a) and optical depth (τ), which are defined as follows:
| (4) |
and
| (5) |
where t is the physical thickness of the sample entered into the program in millimeters. The measured values of the total diffuse reflectance (Rd), total diffuse transmittance (Td), and unscattered collimated transmittance (Tc) are applied to the IAD algorithm in order to determine the optical absorption and scattering coefficients of freshly harvested ocular tissues. Further details of the IAD method can be found in Sardar et al. [2] and Jacques and Wang [20].
Inverse Monte Carlo method
The MC method has been used to describe a variety of phenomena that require simulation of random processes. In the case of turbid media, the inhomogeneities and varying refractive indices may be modeled by using this method. When an electromagnetic field is applied to a tissue medium, it responds to the field. As the photons travel through the tissue medium, they may be scattered or absorbed. If a large number of photons is used, these events may be tracked and outcomes tabulated in accordance with probability density distributions. The specific inputs required for the MC method will be described in detail.
The inverse problem is termed the IMC method. In this scheme, the Rd and Td are used to determine the μa and μs which are modeled by a stochastic simulation of light interaction with biological media. This method has been employed by several researchers to calculate the absorption and scattering coefficients [8, 21]. The IMC calculations include the direct solution, a forward MC calculation, sphere geometrical parameters, the optical properties of the component media (e.g., refractive indices of boundaries, sample geometry, beam diameter), and the inverse solution that determines a minimum by iteration.
In this article, we describe the scattering and absorption coefficients of the cornea, lens, and retina of bovine ocular tissues at 457.9 nm, 488 nm, and 514.5 nm, and compare the values obtained using different models. Finally, the validity of these methods as applied to our experiment is discussed with the results.
Materials and methods
Ocular tissue preparation
Samples of bovine ocular tissues were provided by the local beef packer plants. A pair of eyes was enucleated freshly and transported in ice (within 1 h) to the research laboratory. Immediately upon their arrival at the research laboratory, the fresh (not frozen) whole eyes were dissected on ice with phosphate-buffered saline (PBS) solution to separate and remove the desired ocular tissues for optical measurement. Each eye was carefully dissected to allow access to the inner structures of the eye (e.g., vitreous humor). The eye was cut and separated into two hemispheres: (1) an anterior segment containing the cornea, and (2) the posterior cup containing the retina and the optic nerve. The cornea, lens and retina were dissected and studied separately. The retina was dissected from the posterior eye cup last. Tissue samples were mounted between glass slides, and spacers were used to ensure the samples were not distorted due to excessive compression. Individual sample thicknesses were measured. A small amount of vacuum grease was applied to the edges of the glass slides to preserve moisture of the tissue samples. The data were collected at room temperature within 2 h of sample preparation.
Measurement of diffuse reflectance and transmittance
The total diffuse reflectance (Rd), total diffuse transmittance (Td), and collimated transmittance (Tc) were measured, using two identical integrating spheres (Oriel model 70674). The tissue sample was placed in a specially designed holder which fit on the ports connecting the integrating spheres. The measurements were performed on the bovine lens, cornea and retina at 457.9 nm, 488 nm and 514.5 nm from an argon ion laser (Spectra Physics, model 2025). Although the maximum output power of the argon ion laser varied from 1 W to 2 W, the average output power was kept at its minimum value of approximately 5 mW for all optical measurements. The diameter of the argon laser beam at 1/e2 was 1.18 mm, 1.22 mm, and 1.25 mm at 457.9 nm, 488 nm and 514.5 nm, and the beam divergence was 0.65 mrad, 0.67 mrad, and 0.69 mrad, respectively.
The schematic of the experimental setup for measuring the total diffuse reflectance and total diffuse transmittance is shown in Fig. 1. The experimental setup was similar to that used by previous authors [21]. The intensity of each laser beam was reduced by neutral density filters to prevent oversaturation of the photomultiplier tube (PMT). The laser beam was directed into the entrance port, A, of integrating sphere 1 (Oriel 70674), whose exit port was coupled with the entrance port of integrating sphere 2. The sample was mounted at the coupling port C. The exit port B of integrating sphere 2 was covered with a cap with a reflective surface identical to that of the integrating spheres. The diameter of each sphere was 6 in., and each port had a diameter of 1.5 in. Light leaving the sample was reflected multiple times from the inner surfaces of the spheres before reaching the PMTs. The inner surfaces of the spheres were coated with a layer of barium sulfate. This coating ensured a highly reflective Lambertian surface.
Fig.1.
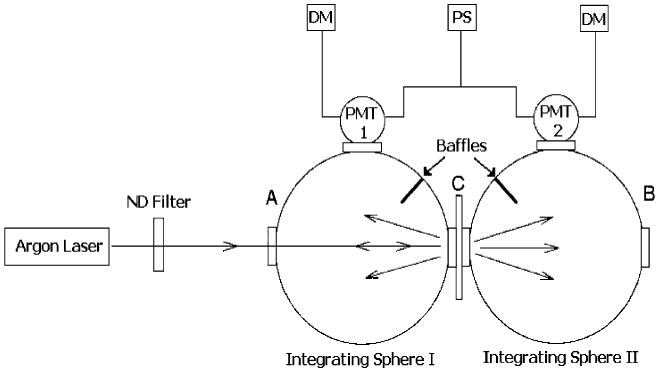
Schematic for the diffuse reflection and transmission measurements of bovine ocular tissues. DM=Digital multimeter, PS=Power source, PMT=Photomultiplier tube, ND=Neutral density filter, Arrows indicate laser beam path
Reflecting baffles within the spheres shielded the PMTs from the direct light from the sample. Port A was equipped with a variable aperture so that the beam diameter could be properly controlled. The reflected and transmitted light intensities were detected by two identical PMTs (Newport model 77348). These detectors were attached to the two measuring ports of integrating spheres 1 and 2. The PMTs were powered by a common high voltage power supply (Spectra Physics model 70705). The high voltage was kept at 400 V for all measurements. The signals from the PMTs were measured by two identical Fluke digital multimeters (model 77 series II). The measured light intensities were then utilized to determine the total diffuse reflectance (Rd) and total diffuse transmittance (Td) by the following expressions:
| (6) |
and
| (7) |
where Xr is the reflected intensity detected by PMT-1 with the sample at C, Zr is the incident intensity detected by PMT-1 without the sample at C and with the reflective surface at the exit port C of the integrating sphere 1, Xt is the transmitted intensity detected by PMT-2 with the sample at C and Zt is the incident intensity detected by PMT-2 with no sample at C and with a reflective surface at B, and Y is the correction factor for the stray light measured by PMTs 1 and 2 with no sample at C or reflective surface at B.
Measurement of collimated transmittance
The unscattered collimated transmittance (Tc) was measured to determine the total attenuation coefficient. We measured the collimated laser beam intensities by placing an integrating sphere approximately 2 m behind the sample so that the photons scattered off the sample would not be able to enter the aperture of approximately 3 mm in diameter at the entrance port of the sphere. The sample was aligned at a right angle to the incident beam. The Tc was calculated from the following relationship:
| (8) |
where Xc is the collimated light intensity detected by a PMT (Newport model 77348) attached to the measuring port C of the integrating sphere and Zc is the incident light intensity detected by the PMT with no sample in the light path; the reflective surface was placed at exit port B of the integrating sphere in both cases.
Additional details on the experimental design can be found in Sardar et al. [22].
Data analysis
Kubelka–Munk method
The KM coefficients, K and S, can be expressed in terms of μa and μs in the following forms:
| (9) |
where g is the scattering anisotropy coefficient. These coefficients can be expressed in terms of sample thickness (t), diffuse reflectance (Rd), and diffuse transmittance (Td) as follows [18]:
| (10) |
where
| (11) |
The collimated transmittance (Tc) can be written in terms of the absorption and scattering coefficients following Beer's law:
| (12) |
where t is the sample thickness, measured in centimeters. By combining equations (9) through (11), we can solve for the values of μa, μs, and g.
Inverse adding doubling method
In order to obtain the values of μa and μs using the IAD method [10], we supplied the measured values of Rd, Td, and Tc to the IAD algorithm. The IAD algorithm iteratively chose the values for the dimensionless quantities: a and τ, defined in Eqs. (4) and (5), respectively, and then adjusted the value of g until it matched the measured values of Rd and Td. We then used the values of a and τ provided by the IAD method to calculate μa and μs, using Eqs. (4) and (5). Returned values were selected when the error tolerance had been achieved, where the error function was defined as
| (13) |
The default tolerance was set at 0.0001.
Inverse Monte Carlo method
The scattering, absorption, and scattering anisotropy coefficients were obtained from a Monte Carlo (MC) simulation. The simulation involved the tracking of a large number of photons through a turbid medium, and it kept a tally of the absorption and scattering events, using a probability distribution. This was an iterative process. The values of Rd, and Td, were measured experimentally. In the IMC mode these values were provided as an initial set of inputs. The MC simulation was performed using a gradient algorithm and took into account sphere parameters, geometries of the sample, and the incident beam to calculate Rd, Td, and Tc. Acceptable calculated values were selected by minimizing a squared error function,
| (14) |
If the difference was smaller than the error threshold as determined by the program, δ < 0.0004, the values of μa, μs, and g were validated.
Monte Carlo simulation
The accuracy of values of the absorption coefficient (μa) and scattering coefficient (μs) determined by each of the computational methods was verified by the MC simulation. The MC simulation uses the stochastic model to simulate light transport through biological media. The μa and μs calculated by each method, together with the reported index of refraction (n) [2, 23] and scattering anisotropy coefficient (g), were used to compute an expected Rd and Td. These values were then compared for accuracy, through an unpaired Student's t-test, with the experimental values of Rd and Td. A detailed theoretical description of the MC model in biological media is given by Prahl et al. [24].
Results and discussion
Measurements of Rd, Td, and Tc were repeated three times on the bovine lens, corneal and the retinal tissues at 457.9 nm, 488 nm, and 514.5 nm, and the values agreed to within 5%. The refractive indices used for our calculations were 1.37 for cornea, 1.40 for lens, and 1.34 for retina, with a range of 0.85–0.99 for the scattering anisotropy coefficient (g) [2, 23]. These experimental values are given in Tables 1, 2 and 3. Using the KM method, we used the experimental values to calculate the μa, μs for comparison. The experimental values of Rd, Td, Tc, and accepted values for the index of refraction and the scattering anisotropy coefficient, were input into the IAD program. The output of the IAD program provided the dimensional quantities a and τ, defined by Eqs. (4) and (5), respectively. The absorption and scattering coefficients were then calculated from the values of a and τ. Furthermore, the same initial values that were input into the IAD program were used for the IMC program in which the μs and μa were also computed. All the calculated values for each method can be found in Tables 1–3. Finally, to verify the accuracy of our coefficients, we ran the calculated μa and μs values from the IAD and KM methods through the MC simulation to output expected Rd and Td values. A detailed theoretical description of the MC simulation is provided by Prahl et al. [24]. The comparison between experimental and expected Rd and Td values is given in Table 4 and Fig. 2.
Table 1.
Wavelength-dependent absorption coefficient (μa) and scattering coefficient (μs) as determined by the Kubelka–Munk formula, IAD, and IMC, using the measured diffuse reflectance (Rd), diffuse transmittance (Td), and collimated transmittance (Tc) for bovine cornea (n=1.37). The thickness (t) was measured at 1.71 mm
| Wavelength (nm) | Experimental | KM | IAD | IMC | |||||
|---|---|---|---|---|---|---|---|---|---|
| Rd | Tc | Td | μa (cm−1) | μs (cm−1) | μa (cm−1) | μs (cm−1) | μa (cm−1) | μs (cm−1) | |
| 457.9 | 0.08 | 0.758 | 0.149 | 0.517 | 10.6 | 0.57 | 10.3 | 0.342 | 10.53 |
| 488 | 0.079 | 0.753 | 0.152 | 0.542 | 10.5 | 0.61 | 10.1 | 0.488 | 10.2 |
| 514.5 | 0.081 | 0.742 | 0.186 | 0.572 | 9.25 | 0.63 | 8.9 | 0.315 | 9.22 |
Table 2.
Wavelength-dependent absorption coefficient (μa) and scattering coefficient (μs) as determined by the Kubelka—Munk formula, IAD, and IMC, using the measured diffuse reflectance (Rd), diffuse transmittance (Td), and collimated transmittance (Tc) for bovine lens (n=1.40). The thickness (t) was measured at 10.12 mm
| Wavelength (nm) | Experimental | KM | IAD | IMC | |||||
|---|---|---|---|---|---|---|---|---|---|
| Rd | Tc | Td | μa (cm−1) | μs (cm−1) | μa (cm−1) | μs (cm−1) | μa (cm−1) | μs (cm−1) | |
| 457.9 | 0.059 | 0.796 | 0.002 | 0.08 | 6.34 | 0.11 | 5.94 | 0.055 | 6 |
| 488 | 0.028 | 0.58 | 0.131 | 0.25 | 1.77 | 0.246 | 1.766 | 0.922 | 1.92 |
| 514.5 | 0.058 | 0.884 | 0.327 | 0.03 | 1.07 | 0.042 | 1.01 | 0.002 | 1.05 |
Table 3.
Wavelength-dependent absorption coefficient (μa) and scattering coefficient (μs) as determined by the Kubelka–Munk formula, IAD, and IMC, using the measured diffuse reflectance (Rd), diffuse transmittance (Td), and collimated transmittance (Tc) for bovine retina (n=1.34). The thickness (t) was measured at 0.12 mm
| Wavelength (nm) | Experimental | KM | IAD | IMC | |||||
|---|---|---|---|---|---|---|---|---|---|
| Rd | Tc | Td | μa (cm−1) | μs (cm−1) | μa (cm−1) | μs (cm−1) | μa (cm−1) | μs (cm−1) | |
| 457.9 | 0.054 | 0.869 | 0.031 | 3.35 | 287.2 | 4.82 | 280.3 | 2.41 | 282.7 |
| 488 | 0.038 | 0.792 | 0.013 | 7.76 | 363.7 | 7.3 | 350.8 | 3.15 | 355 |
| 514.5 | 0.051 | 0.867 | 0.036 | 3.57 | 273.3 | 5.51 | 267 | 1.93 | 290.8 |
Table 4.
Wavelength-dependent average diffuse reflectance (Rd) and diffuse transmittance (Td) determined by experimental and computational techniques
| Wavelength (nm) | Sample | Experimental | KM through MC | Percent difference | IAD through MC | Percent difference | |||||
|---|---|---|---|---|---|---|---|---|---|---|---|
| Rd | Td | Rd | Td | Rd | Td | Rd | Td | Rd | Td | ||
| 457.9 | Cornea | 0.080 | 0.758 | 0.073 | 0.745 | 8.955 | 1.750 | 0.080 | 0.758 | 0.035 | 0.005 |
| Lens | 0.054 | 0.869 | 0.048 | 0.864 | 12.134 | 0.545 | 0.036 | 0.865 | 40.087 | 0.418 | |
| Retina | 0.059 | 0.796 | 0.051 | 0.792 | 15.613 | 0.551 | 0.034 | 0.789 | 53.484 | 0.918 | |
| 488 | Cornea | 0.079 | 0.753 | 0.066 | 0.749 | 17.493 | 0.521 | 0.079 | 0.753 | 0.066 | 0.001 |
| Lens | 0.038 | 0.792 | 0.031 | 0.824 | 21.267 | 3.987 | 0.048 | 0.788 | 22.281 | 0.542 | |
| Retina | 0.028 | 0.580 | 0.046 | 0.573 | 47.680 | 1.250 | 0.039 | 0.553 | 31.333 | 4.838 | |
| 514 | Cornea | 0.081 | 0.742 | 0.056 | 0.759 | 36.698 | 2.325 | 0.059 | 0.737 | 31.340 | 0.615 |
| Lens | 0.051 | 0.867 | 0.046 | 0.863 | 9.813 | 0.490 | 0.032 | 0.865 | 45.311 | 0.248 | |
| Retina | 0.058 | 0.884 | 0.047 | 0.871 | 21.368 | 1.391 | 0.032 | 0.880 | 57.201 | 0.352 | |
Fig. 2.

P values of unpaired t-test. Comparison of measured and expected values for diffuse reflectance (Rd) and diffuse transmittance (Td). KM Kubelka–Munk method (IAD inverse adding doubling method)
The measured values of Rd and Td were used to calculate μa and μs by the KM, IAD, and IMC methods, as discussed in the computational methods section. Taking each set of the computed scattering and absorption coefficients, we employed MC simulation to obtain expected diffuse reflectance and diffuse transmittance values based on these parameters. These expected values of Rd and Td based on the μa and μs computed by the different methods are compared with the measured values, through percent difference and the P values of an unpaired Student's t-test, in Table 4 and Fig. 2. It is clear from the percent differences of average measured and expected Rd and Td values that the diffuse transmission expectations were closer to those observed in the laboratory than the diffuse reflectance was. This is also evident from the P values of the t-test, which describe the probability that differences between measured and expected populations were caused by random fluctuations. As is common in biological work, we used a threshold of P ≤ 0.01 to determine if differences were statistically significant. Again, the expected diffuse transmittance matched well with the measured transmittance, with only one case showing significant difference. The expected diffuse reflectance from both KM and IAD tended to vary significantly from the measured values. In fact, the expected reflectances tended to be lower, which indicated that the thin layer of saline solution on our samples may have reflected more of the incoming light and altered our measured signal. The discrepancies in diffuse reflectance could also be an artifact of the computational methods, since the thickness regime in which we were measuring was near the limit of algorithmic assumptions.
The computed scattering coefficients for all tissues and wavelengths agreed very well, within 9% difference between the computational methods, as can be seen in Tables 1–3. There was a wider degree of variation among the absorption coefficients, particularly in the IMC-computed values of μa, which were significantly lower than those calculated by the other methods. This was likely because the IMC algorithm only converged to a solution for smaller computational photon packets (hundreds or thousands of photons). Despite this difficulty in achieving the optical coefficients using IMC, we found that the results for μs were consistent with those obtained through the other methods, indicating that these were, indeed, good approximations. The data obtained through IMC had been included as a comparison to highlight how well KM and IAD agreed.
The scattering and absorption coefficients of the cornea showed some variation across the wavelength studied. When the blood supply is removed from corneal tissues, the cornea tends to absorb the aqueous humor and the transparent cornea becomes opaque. This may alter any unique variations of the coefficients at any wavelengths, but, since our data were obtained 2–3 h after the animal had been killed, the errors in the coefficients were kept at a minimum.
However, the coefficients of the lens at all wavelengths investigated were significantly lower than those of the retina. This was because the primary function of the lens is to focus the light onto the retina and any loss of light would affect the resultant image, as in cataracts and presbyopia. The retina is also more opaque than the clear biconvex lens, which also explains why the absorption and scattering coefficients were the lowest of all the tissues examined.
The scattering in the retinal tissue was found to be significantly higher than the absorption, which concurred with previous studies that reported high transmittance values for retinal tissues in the visible region of the spectrum. The low absorption coefficients could be caused by the unreplenished visual pigments within the retina that absorb the photons in the process that turns light into electrical signals. Once the visual pigments have been exhausted, there is an oversaturation of light in which the laser light cannot be absorbed and just passes through the thin tissue, causing a high scattering value. If the visual pigments were constantly replenished, then we should see a much higher absorption value, but the only way this could be possible is if a sample were to be used in vivo. The values of the attenuation coefficients of retina can also be attributed to some inadvertent cross-contamination of the retina with melanin granules from the retinal pigment epithelium (RPE) during sample preparation. The transmittance values in the visible region have been reported in previous studies on retinal tissues [3, 25]. Geerates and Berry reported that in the visible region transmittance was greater than 80% in human, rabbit, and monkey retinal tissues [25]. However, van den Berg and Spekreijse argued that the data presented by Boettner and Wolter [26] could be explained only on the basis of pure water content in the ocular tissues [3].
The scattering coefficients for each tissue in this study at all wavelengths were consistently higher than the absorption coefficients, showing that, at these wavelengths, light passes through each layer effectively. Additional studies on the spectral properties of ocular media, ranging from ultra violet (UV) through near-infrared, have been reported by other authors, which have been taken into consideration in this report [4, 5, 11, 23, 27–29]. The high transmittance and very low reflectance in the visible region reported by those authors did, in fact, correspond with our values, although there may have been some slight differences due to sample variation and preparation. For example, Hammer et al. [1] reported on the absorption and scattering coefficients of the bovine retina obtained through a similar double integrating sphere setup; our values were in general agreement with the trends and relative scale of values reported in that study. However, there was some difference between our values and those of Hammer et al. Specifically, those coefficients obtained through KM and IAD were closest to those of Hammer and colleagues, differing by less than a factor of two. Again, IMC values differed the most, which was due to the same reasons discussed previously. That study had a different approach towards the preparation of the whole retina sample, placing the excised tissue flat in a cuvette and filling the remaining volume with saline solution, as opposed to our slide technique. Also, that study assumed accepted values for tissue layer thicknesses, while we did physically measure this parameter. Because of differences in sample preparation such as this, some amount of disagreement between the optical properties reported herein and those previously reported, such as in Hammer et al., is to be expected.
The actual values of the absorption and scattering coefficients for the retinal tissues reported in this study have importance for practical applications requiring the prediction of light transport through pigmented tissue, e.g., in the design of treatment models for laser-induced thermotherapy or photodynamic therapy in the eye, where the degree of pigmentation at the target sites may vary. Variable pigmentation obviously complicates the laser dosimetry for such treatment modes, because the amount of light delivered will have to be adjusted, based on the amount of tissue pigmentation, in order to achieve some standard clinical effect [22].
The suitability of the KM theory for use in biological tissues is currently the subject of a lively discussion in the light–tissue interaction community. Although the linearity of the relationship between K and S and the true physical optical parameters was questioned by Yang and Kruse [30], their proposed revisions to the theory were evaluated theoretically and experimentally by Edström [31] and shown to yield significant errors. The available literature is inconclusive on the validity of the revised theory. As this was the case at the time this paper was written, the original KM theory, a cornerstone in radiative transport studies, was utilized for obtaining μa and μs to compare with the other computational methods.
All of the methods used to determine the absorption and scattering coefficients in this work operate under the assumption of diffuse light transport. This is a valid and very useful approximation, which is widely used when biological materials are being studied. However, it does begin to break down as the sample thickness decreases. In the case of the retina, which is indeed quite thin, some skepticism towards the calculated optical properties is warranted when one is working under the diffuse light assumption, because the total sample thickness may only allow for one or two scattering events along the propagation axis. Despite this shortcoming of the theory, the diffuse light techniques are still some of the best and most straightforward methods available to determine properties, such as absorption and scattering coefficients, of turbid media. Indeed, comparisons of work done under this approximation with those utilizing ballistic transport models would only add to the understanding of light transport in turbid media and illuminate how the different treatments of data differ. This is an area which requires more study, however, and is beyond the scope of this paper.
Acknowledgments
This work was supported by the National Science Foundation (NSF)-sponsored Center for Biophotonics Science and Technology at the University of California (UC) Davis under cooperative agreement no. PHY 0120999. The authors would like to thank Scott Prahl (Oregon Medical Laser Center) for the use of the IAD source code, Steven L. Jacques (Oregon Medical Laser Center), and Lihong Wang (Washington University, St. Louis, MO) for the use of the source code for the Monte Carlo model. The source codes for both of these programs are available at http://omlc.ogi.edu/software/. Additionally, we acknowledge Xin-Hua Hu (East Carolina University) for the use of the Inverse Monte Carlo (IMC) code. This is available at http://bmlaser.physics.ecu.edu/. We also thank C.D. Clark for his assistance with the code for the inverse Monte Carlo model.
Contributor Information
Dhiraj K. Sardar, Email: dsardar@utsa.edu, Department of Physics and Astronomy, University of Texas at San Antonio, San Antonio, TX 78249-0697, USA.
Brian G. Yust, Department of Physics and Astronomy, University of Texas at San Antonio, San Antonio, TX 78249-0697, USA
Frederick J. Barrera, Department of Physics and Astronomy, University of Texas at San Antonio, San Antonio, TX 78249-0697, USA
Lawrence C. Mimun, Department of Physics and Astronomy, University of Texas at San Antonio, San Antonio, TX 78249-0697, USA
Andrew T. C. Tsin, Department of Biology, University of Texas at San Antonio, San Antonio, TX, USA
References
- 1.Hammer M, Roggan A, Schweitzer D, Muller G. Optical properties of ocular tissues—an in vitro study using the double-integrating-sphere technique and inverse Monte Carlo simulation. Phys Med Biol. 1995;40:963–978. doi: 10.1088/0031-9155/40/6/001. [DOI] [PubMed] [Google Scholar]
- 2.Sardar DK, Swanland GY, Yow RY, Thomas RJ, Tsin ATC. Optical properties of ocular tissues in the near infrared region. Lasers Med Sci. 2007;22:46–52. doi: 10.1007/s10103-006-0421-y. [DOI] [PubMed] [Google Scholar]
- 3.van den Berg TJ, Spekreijse H. Near infrared light absorption in the human eye media. Vision Res. 1997;37:249–253. doi: 10.1016/S0042-6989(96)00120-4. [DOI] [PubMed] [Google Scholar]
- 4.Vos JJ, Munnik AA, Boogaard J. Absolute spectral reflectance of the fundus oculi. J Opt Soc Am. 1965;55:573–574. doi: 10.1364/JOSA.55.000573. [DOI] [Google Scholar]
- 5.Maher EF. Transmission and absorption coefficients for ocular media of the rhesus monkey. USAF School of Aerospace Med; Brooks AF Base, TX: 1978. Report SAM-TR-78-32. [Google Scholar]
- 6.Bashkatov AN, Genina EA, Kochubey VI, Gavrilova AA, Kapralov SV, Grishaev VA, Tuchin VV. Optical properties of human stomach mucosa in the spectral range from 400 to 2000 nm: prognosis for gastroenterology. Med Laser Appl. 2007;22:95–104. doi: 10.1016/j.mla.2007.07.003. [DOI] [Google Scholar]
- 7.Gebhart SC, Lin WC, Mahadevan-Jansen A. In vitro determination of normal and neoplastic human brain tissue optical properties using inverse adding-doubling. Phys Med Biol. 2006;51:2011–2027. doi: 10.1088/0031-9155/51/8/004. [DOI] [PubMed] [Google Scholar]
- 8.Yaroslavsky AN, Schulze PC, Yaroslavsky IV, Schober R, Ulrich F, Schwarzmaier HJ. Optical properties of selected native and coagulated human brain tissues in vitro in the visible and near infrared spectral range. Phys Med Biol. 2002;47:2059–2073. doi: 10.1088/0031-9155/47/12/305. [DOI] [PubMed] [Google Scholar]
- 9.Chandrasekhar S. Radiative transfer. Dover; New York: 1960. [Google Scholar]
- 10.Prahl SA, Van Gemert MJC, Welch AJ. Determining the optical properties of turbid media by using the adding-doubling method. Appl Opt. 1993;32:559–568. doi: 10.1364/AO.32.000559. [DOI] [PubMed] [Google Scholar]
- 11.Sardar DK, Yow RM, Tsin ATC, Sardar R. Optical scattering, absorption, and polarization of healthy and neovascularized human retinal tissues. J Biomed Opt. 2005;10:515011–515018. doi: 10.1117/1.2065867. [DOI] [PubMed] [Google Scholar]
- 12.Kubelka P. New contributions for the optics of intensely light-scattering materials. J Opt Soc Am. 1948;38:448–457. doi: 10.1364/JOSA.38.000448. [DOI] [PubMed] [Google Scholar]
- 13.Wan S, Anderson RR, Parish JA. Analytical modeling for the optical properties of the skin with in vitro and in vivo applications. Photochem Photobiol. 1981;34:493–499. doi: 10.1111/j.1751-1097.1981.tb09391.x. [DOI] [PubMed] [Google Scholar]
- 14.Ertefai S, Profio AE. Spectral transmittance and contrast in breast diaphanography. Med Phys. 1985;12:393–400. doi: 10.1118/1.595701. [DOI] [PubMed] [Google Scholar]
- 15.Reynolds L, Johnson CC, Ishimaru A. Diffuse reflectance from a finite blood medium: application to the modeling of fiberoptic catheters. Appl Opt. 1978;15:2059–2067. doi: 10.1364/AO.15.002059. [DOI] [PubMed] [Google Scholar]
- 16.Groenhuis RJA, Ferwerda HA, Ten Bosch JJ. Scattering and absorption of turbid materials determined from reflection measurements. 1: Theory. Appl Opt. 1983;22:2456–2462. doi: 10.1364/ao.22.002456. [DOI] [PubMed] [Google Scholar]
- 17.Van Gemert MJC, Welch AJ, Star WM, Motamedi M. Tissue optics for a slab geometry in diffusion approximation. Lasers Med Sci. 1987;2:295–302. doi: 10.1007/BF02594174. [DOI] [Google Scholar]
- 18.Kottler F. Turbid media with plane-parallel surfaces. J Opt Soc Am. 1960;50:483–490. doi: 10.1364/JOSA.50.000483. [DOI] [Google Scholar]
- 19.Hourdakis J, Perris A. A Monte Carlo estimation of tissue optical properties for use in laser dosimetry. Phys Med Biol. 1995;40:351–364. doi: 10.1088/0031-9155/40/3/002. [DOI] [PubMed] [Google Scholar]
- 20.Jacques SL, Wang L. Monte Carlo modeling of light transport in tissues. In: Welch AJ, van Gemert MJC, editors. Optical-thermal response of laser-irradiated tissue. Plenum; New York: 1995. [Google Scholar]
- 21.Beek JF, Staveren HJ, Posthumus P, Sternborg HJCM, van Gemert MJC. In vitro double-integrating-sphere optical properties of tissue between 630 and 1064 nm. Phys Med Biol. 1997;42:2255–2261. doi: 10.1088/0031-9155/42/11/017. [DOI] [PubMed] [Google Scholar]
- 22.Sardar DK, Mayo ML, Glickman RD. Optical characterization of melanin. J Biomed Opt. 2001;6:404–411. doi: 10.1117/1.1411978. [DOI] [PubMed] [Google Scholar]
- 23.Fowler RW, McLeod DS, Pitts SM. The effect of blood on ocular fundus reflectance and determination of some optical properties of retinal blood vessels. Invest Ophthalmol Vis Sci. 1978;17:562–565. [PubMed] [Google Scholar]
- 24.Prahl SA, Keijzer M, Jacques SL, Welch AJ. A Monte Carlo model of light propagation in tissue. SPIE Inst Adv Opt Technol Ser. 1989;5:102–111. [Google Scholar]
- 25.Geerates WJ, Berry ER. Ocular spectral characteristics as related to hazards from lasers and other light sources. Am J Ophthalmol. 1968;66:15–20. doi: 10.1016/0002-9394(68)91780-7. [DOI] [PubMed] [Google Scholar]
- 26.Boettner EA, Wolter JR. Transmission of the ocular media. Invest Ophthalmol. 1962;1:776–783. [Google Scholar]
- 27.Delori FC, Pflibsen KP. Spectral reflectance of the human ocular fundus. Appl Opt. 1989;28:1061–1077. doi: 10.1364/AO.28.001061. [DOI] [PubMed] [Google Scholar]
- 28.Knighton RW, Jacobson SG, Kemp CM. The spectral reflectance of the nerve fiber layer of the macaque retina. Invest Ophthalmol Vis Sci. 1989;30:2393–2402. [PubMed] [Google Scholar]
- 29.Sardar DK, Salinas FS, Perez JC, Tsin ATC. Optical characterization of bovine retinal tissues. J Biomed Opt. 2004;9:624–631. doi: 10.1117/1.1688813. [DOI] [PubMed] [Google Scholar]
- 30.Yang L, Kruse B. Revised Kubelka-Munk theory. I. Theory and application. J Opt Soc Am. 2004;21:1933–1941. doi: 10.1364/josaa.21.001933. [DOI] [PubMed] [Google Scholar]
- 31.Edström P. Examination of the revised Kubelka-Munk theory: considerations of modeling strategies. J Opt Soc Am. 2007;24:548–556. doi: 10.1364/josaa.24.000548. [DOI] [PubMed] [Google Scholar]