

Abstract
A new biflavonoid (1), a new xanthone enantiomer (2), five new caged xanthones (3–7), and several known compounds were isolated from the stem bark of Garcinia lateriflora, collected in Indonesia. The structures of the new compounds were determined by analysis of spectroscopic data, and the absolute configuration of the caged xanthones was shown for the first time at carbons 5, 7, 8, 8a, 10a, and 27, by analysis of COSY and NOESY NMR and ECD spectra. The biflavonoids exhibited proteasome inhibitory activity, and the known compound, morelloflavone (8) was found to have the greatest potency (IC50 = 1.3 μM). The caged xanthones were cytotoxic towards HT-29 cells, with the known compound, morellic acid (10) being the most active (ED50 = 0.36 μM). However, when tested in an in vivo hollow fiber assay, it was inactive at the highest dose tested (20 mg/kg).
Keywords: Garcinia lateriflora, Biflavonoids, Caged xanthones, Proteasome inhibition, Cytotoxicity
1. Introduction
The genus Garcinia (Clusiaceae) comprises over 200 species, of which some are used in traditional medicine.1 This genus is the known source of the so-called “caged xanthones”, a cluster of polyprenylated xanthones with a saturated ring A, a highly substituted tetrahydrofuran ring, and three quaternary carbon centers each.2–4 This type of compounds along with biflavonoids are the most characteristic secondary metabolites of Garcinia species,3–7 and both compound classes have been found to exhibit diverse biological activities.8–13 For example, several caged xanthones are cytotoxic against human tumor cells,12–15 including gambogic acid, a typical caged xanthone isolated from the resin of Garcinia hanburyi Hook. f., which inhibited human SPC-A1 cell growth both in vitro and in vivo.14 This compound induces tumor cell apoptosis by binding to topoisomerase IIα to prevent DNA cleavage and ATP hydrolysis, 15 and it is presently in a phase II clinical trial as an antitumor agent in the People’s Republic of China.15
Garcinia lateriflora Blume is a tropical medicinal herb, with only one compound reported from this plant before, namely, lateriflorone, a novel spiroxalactone for which a methyl ether derivative was later synthesized.16 As a part of a multidisciplinary collaborative natural product drug discovery project,17 a crude methanol extract of G. lateriflora stem bark exhibited both proteasome inhibitory activity and cytotoxicity towards HT-29 human colon cancer cells. Using column chromatography, a new biflavonoid (1), a new xanthone enantiomer (2), five new caged xanthones (3–7), and several known compounds were isolated in the present investigation. The isolation, structure elucidation, and bioactivity evaluation of the isolates obtained from the stem bark of G. lateriflora are reported herein.
2. Results and discussion
2.1. Structure elucidation of new compounds
The ethyl acetate-soluble extract of the methanol extract of the dried ground stem bark of G. lateriflora, collected in Indonesia, was separated by column chromatography over silica gel and yielded nine fractions. Combined fractions six and seven were further purified by silica gel column chromatography to afford a new compound, lateriflavanone (1), a new enantiomer, laterixanthone (2), along with the known compounds, morelloflavone (8),18 talbotaflavone (9),19 rhusflavanone,20 and stigma-5,13-diene 3β-O-D-glucoside.21 The n-hexane-soluble extract was fractionated by silica gel column chromatography, affording seven fractions. Chromatographic separation of combined fractions five and six yielded the new compounds, isomoreollic acid (3), isogaudichaudiic acid (4), isogaudichaudiic acid E (5), 11,12-dihydro-12-hydroxymorellic acid (6), isogaudichaudiic acid B (7), along with the known morellic acid (10)22 and 3β-acetoxyurs-12-en-28-oic acid.23 The known compounds were identified by comparison of their spectroscopic data with literature values.
Compound 1 was obtained as an amorphous white powder showing a purple color under UV light at 365 nm, with a molecular formula of C30H22O11 determined by HRESIMS (m/z, 581.1032 [M + Na]+, calcd 581.1060). Its UV (λmax 216, 291 nm) and IR (νmax 3320 and 1633 cm−1) spectra showed absorption bands characteristic of a biflavanone.24,25 The 1H and 13C NMR spectra (Table 1) were similar to those of rhusflavanone.20 In the decoupled 13C NMR spectrum of 1, 30 signals were displayed, consistent with this compound being a biflavonoid. Two carbonyl related signals at δ 198.1 and δ 197.8 confirmed the presence of two flavanone units.20,24,25 The DEPT 90 and DEPT 135 spectra showed two methylene carbon signals at δ 44.7 indicating that the constituent monomeric units of 1 are not connected at their C-3 positions.20 Similarities of the 13C NMR spectrum with that of rhusflavanone20 were consistent with the structure of 1 being a C-6/C-8-linked naringenin-dihydroluteolin dimer, which was confirmed by the absence of H-6 and H-8″ signals, the downfield shifts of C-6 (δ 103.2) and C-8″ (δ 102.6), and the HMBC correlations between OH-5 and C-5, C-6, and C-10, OH-5″ and C-5″, C-6″, and C-10″, H-8 and C-10, and H-6″ and C-8″ and C-10″ (Figure 1). The structure of 1 was confirmed from additional HMBC correlations between H-2′ and C-2, H-2 and C-3, H-3 and C-10, H-2‴ and C-2″, H-2″ and C-4″, and H-3″ and C-10″ (Figure 1). The CD spectrum of 1 exhibited a high-amplitude positive Cotton effect at 292 nm and a low-amplitude negative Cotton effect at 320 nm for the electronic π → π* and n → π* transitions, respectively, of the two constituent flavanone moieties, thus confirming the 2R absolute configuration at both C-2 and C-2″.26 Therefore, compound 1 was defined as ent-naringenin-(6→8″)-ent-dihydroluteolin.
Table 1.
1H and 13C NMR data of 1
| Position | δHa (m, J/Hz) | δCc |
|---|---|---|
| 2 | 5.51 (m) | 82.9, CH |
| 3 | 2.94 (m) 2.68 (m) |
44.7, CH2 |
| 4 | 198.1, C | |
| 5-OH | 11.80 (sb) | 165.8, C |
| 6 | 103.2, C | |
| 7 | 168.0, C | |
| 8 | 5.82 (s) | 96.2, CH |
| 9 | 164.8, C | |
| 10 | 103.1, C | |
| 1′ | 131.8, C | |
| 2′ | 7.11 (d, 8.4) | 129.9, CH |
| 3′ | 6.83 (d, 7.8) | 115.7, CH |
| 4′-OH | 9.40 (sb) | 158.7, C |
| 5′ | 6.99 (d, 7.8) | 115.7, CH |
| 6′ | 7.11 (d, 8.4) | 129.5, CH |
| 2″ | 5.20 (m) | 80.8, CH |
| 3″ | 2.89 (m) 2.54 (m) |
44.7, CH2 |
| 4″ | 197.8, C | |
| 5″-OH | 11.80 (sb) | 165.6, C |
| 6″ | 5.87 (s) | 97.3, CH |
| 7″ | 168.0, C | |
| 8″ | 102.6, C | |
| 9″ | 162.8, C | |
| 10″ | 102.6, C | |
| 1‴ | 130.1, C | |
| 2‴ | 6.67 (s) | 115.7, CH |
| 3‴-OH | 8.90 (sb) | 146.5, C |
| 4‴-OH | 8.90 (sb) | 146.8, C |
| 5‴ | 6.59 (d, 7.8) | 116.4, CH |
| 6‴ | 6.72 (d, 7.8) | 119.1, CH |
Data were measured in methanol-d4 at 600 MHz. Chemical shifts (δ) are in ppm from TMS. J values are in Hz and omitted if the signals were overlapped as multiplets. s = singlet, d = doublet, t = triplet, m = multiplet.
Hydroxy group, data were measured in acetone-d6 at 600 MHz and then in DMSO-d6 at 800 MHz for measurement of HMBC spectrum (Figure 1).
Data were measured in methanol-d4 at 75.5 MHz. Chemical shifts (δ) are in ppm from TMS.
Figure 1.

COSY and key HMBC correlations for 1.
Compound 2 was isolated as colorless needles. The UV and IR spectra showed absorption characteristics of a xanthone derivative.27–29 The molecular formula of C18H16O8 was determined by HRESIMS, and is consistent with a 13-carbon xanthone nucleus with a prenyl substituent. The 1H NMR spectrum (Table 2) showed signals for a gem-dimethyl group at δ 1.60 (s) and 1.28 (s), two typical trans-oriented oxymethine protons at δ 4.59 (d, J = 8.4 Hz) and 3.59 (d, J = 8.4 Hz), a one-proton singlet at δ 7.86 due to an aromatic proton, and two meta-substituted aromatic protons at δ 6.16 and 6.41 (both d, both J = 1.8 Hz). This suggested that 2 is a 1,3,5,6-tetraoxygenated xanthone with a prenyl group linking C-6-O and C-7.27,28 The presence of three oxygen-substituted aromatic carbons was confirmed by signals at δ 134.1 (C-5), 146.1 (C-6), and 147.6 (C-10a) in its 13C NMR spectrum (Table 3).28,29 Comparison of the 1H and 13C NMR data of 2 with those of 1,3,5-trihydroxy-13,13-dimethyl-2H-pyran[7,6-b]xanthone-9-one28,29 implied the presence of two extra oxygen-substituted carbons and the absence of a vinyl group at C-11 and C-12 in 2,27,28 which was confirmed by the COSY correlation between H-11 and H-12, and the HMBC correlations between H-2 and C-4 and C-9a, H-8 and C-6, C-9, C-10a, and C-11, H-11 and C-6 and C-13, and H-12 and C-14 and C-15 (Figure 2).
Table 2.
1H NMR data of compounds 2–7 and 10
| Position | 2a | 3b | 4b | 5b | 6b | 7b | 10b |
|---|---|---|---|---|---|---|---|
| 1-OH | 11.90 (s) | 12.80 (s) | 12.80 (s) | 12.80 (s) | 12.80 (s) | 12.72 (s) | |
| 2 | 6.16 (d, 1.8) | ||||||
| 3-OH | 6.42 (s) | ||||||
| 4 | 6.41 (d, 1.8) | ||||||
| 7 | 2.82 (m) | 3.46 (m) | 3.50 (m) | 3.49 (m) | 3.49 (m) | 3.45 (m) | |
| 8 | 7.86 (s) | 4.32 (m) | 7.52 (d, 6.6) | 7.54 (d, 6.6) | 7.50 (d, 6.9) | 7.53 (d, 6.5) | 7.53 d (6.3) |
| 8a | 3.25 (d, 7.8) | ||||||
| 11 | 4.59 (d, 8.4) | 6.60 (d, 9.9) | 3.27 (m) | 6.63 (d, 10.0) | 3.08 (m) 3.10 (m) |
3.28 (m) | 6.52 (d, 10.0) |
| 12 | 3.59 (d, 8.4) | 5.50 (d, 9.9) | 5.18 (t, 6.0) | 5.51 (d, 10.0) | 4.65 (d, 4.5) | 5.20 (t, 6.6) | 5.42 (d, 10.0) |
| 14 | 1.60 (s) | 1.37 (s) | 1.67 (s) | 1.27 (s) | 1.28 (s) | 1.75 (s) | 1.33 (s) |
| 15 | 1.28 (s) | 1.43 (s) | 1.74 (s) | 1.49 (s) | 1.17 (s) | 1.66 (s) | 1.37 (s) |
| 16 | 3.16 (d, 6.0) | 3.23 (m) | 2.91 (m) | 3.15 (d, 6.0) 3.19 (d, 6.0) |
2.79 (brs) 3.06( brs) |
3.31 (m) 3.13 (m) |
|
| 17 | 4.99 (t, 6.0) | 5.05 (t, 6.0) | 4.35 (m) | 5.18 (t, 6.0) | 4.29 (d, 9.3) | 5.00 (t, 5.4) | |
| 19 | 1.60 (s) | 1.67 (s) | 4.85 (brs) 5.00 (brs) |
1.63 (s) | 4.86 (brs) 4.87 (brs) |
1.61 (s) | |
| 20 | 1.71 (s) | 1.71 (s) | 1.83 (s) | 1.70 (s) | 1.85 s | 1.70 (s) | |
| 21 | 3.14 (d, 6.0) | 2.80 (m) 3.29 (m) |
3.30 (m) | 2.86 (m) 2.98 (m) |
2.84 (m) 3.12 (m) |
2.98 (d, 6.0) | |
| 22 | 6.65 (t, 6.0) | 5.78 (t, 6.0) | 5.58 (m) | 5.81 (t, 7.2) | 5.76 (t, 6.6) | 6.05 (t, 6.0) | |
| 25 | 1.93 (s) | 1.73 (s) | 1.70 s | 1.74 (s) | 1.70 (s) | 1.70 (s) | |
| 26 | 1.40 (brs) 1.35 (brs) |
1.10 (m) 2.32 (m) |
1.35 (m) 2.36 (m) |
1.10 (m) 2.30 (m) |
1.37 (m) 2.47 (m) |
1.36 (m) 2.32 (m) |
|
| 27 | 2.48 (m) | 2.48 (m) | 2.51 (m) | 2.47 (m) | 2.75 (t, 4.5) | 2.51 (m) | |
| 29 | 1.33 (s) | 1.64 (s) | 1.63 (s) | 1.66 (s) | 1.57 (s) | 1.66 (s) | |
| 30 | 1.12 (s) | 1.26 (s) | 1.23 (s) | 1.28 (s) | 1.24 (s) | 1.26 (s) | |
| 7-OCH3 | 3.28 (s) |
Data were measured in methanol-d4 at 600 MHz.
Data were measured in CDCl3 at 300 MHz. Chemical shifts (δ) are in ppm from TMS.
s = singlet, d = doublet, t = triplet, m = multiplet, dd = double doublet. J values are omitted if the signals were overlapped as multiplets.
Table 3.
13C NMR data of compounds 2–7, and 10
| Position | 2a | 3b | 4b | 5b | 6b | 7b | 10b |
|---|---|---|---|---|---|---|---|
| 1 | 164.8, C | 156.4, C | 160.4, C | 158.5, C | 163.1, C | 161.2, C | 157.6, C |
| 2 | 99.0, CH | 103.1, C | 106.2, C | 103.3, C | 103.9, C | 104.4, C | 103.2, C |
| 3 | 167.0, C | 161.0, C | 163.5, C | 161.2, C | 163.1, C | 164.8, C | 161.2, C |
| 4 | 95.2, CH | 109.1, C | 107.7, C | 104.3, C | 105.2, C | 104.6, C | 108.0, C |
| 4a | 159.4, C | 155.7, C | 155.9, C | 158.3, C | 153.0, C | 156.1, C | 157.3, C |
| 5 | 134.1, C | 86.4, C | 83.9, C | 83.7, C | 83.9, C | 83.8, C | 83.8, C |
| 6 | 146.1, C | 208.4, C | 203.3, C | 202.8, C | 202.7, C | 203.1, C | 203.3, C |
| 7 | 124.1, C | 43.9, CH | 46.9, CH | 47.0, CH | 46.8, CH | 46.9, CH | 46.9, CH |
| 8 | 116.0, CH | 74.0, CH | 135.1, CH | 135.0, CH | 134.8, CH | 133.5, CH | 135.3, CH |
| 8a | 115.7, C | 48.0, CH | 133.7, C | 133.4, C | 133.7, C | 133.5, C | 133.4, C |
| 9 | 181.7, C | 193.8, C | 179.2, C | 179.1, C | 178.2, C | 179.0, C | 179.0, C |
| 9a | 103.3, C | 101.9, C | 100.7, C | 100.7, C | 100.9, C | 100.6, C | 100.6, C |
| 10a | 147.6, C | 88.4, C | 90.5, C | 90.9, C | 90.3, C | 90.6, C | 90.9, C |
| 11 | 69.7, CH | 115.3, CH | 21.1, CH2 | 115.6, CH | 26.9, CH2 | 21.5, CH2 | 115.4, CH |
| 12 | 76.4, CH | 126.3, CH | 121.5, CH | 125.8, CH | 91.5, CH | 122.3, CH | 126.0, CH |
| 13 | 82.0, C | 78.4, C | 135.0, C | 79.2, C | 71.7, C | 132.2, C | 78.6, C |
| 14 | 26.9, CH3 | 28.2, CH3 | 25.7, CH3 | 28.7, CH3 | 28.8, CH3 | 25.7, CH3 | 28.9, CH3 |
| 15 | 19.9, CH3 | 28.6, CH3 | 17.8, CH3 | 28.4, CH3 | 24.3, CH3 | 17.8, CH3 | 28.5, CH3 |
| 16 | 21.5, CH2 | 22.1, CH2 | 30.1, CH2 | 21.4, CH2 | 29.7, CH2 | 21.6, CH2 | |
| 17 | 122.6, CH | 121.9, CH | 74.3, CH | 121.7, CH | 78.6, CH | 122.2, CH | |
| 18 | 131.2, C | 134.2, C | 147.1, C | 131.9, C | 146.2, C | 131.4, C | |
| 19 | 25.6, CH3 | 25.8, CH3 | 110.8, CH2 | 25.7, CH3 | 110.6, CH2 | 25.7, CH3 | |
| 20 | 18.0, CH3 | 18.0, CH3 | 18.0, CH3 | 17.7, CH3 | 16.8, CH3 | 18.1, CH3 | |
| 21 | 28.0, CH2 | 29.6, CH2 | 29.6, CH2 | 29.5, CH2 | 29.5, CH2 | 29.3, CH2 | |
| 22 | 139.4, CH | 137.5, CH | 135.6, CH | 136.4, CH | 135.0, CH | 138.2, CH | |
| 23 | 127.2, C | 128.3, C | 129.2, C | 129.2, C | 128.9, C | 127.6, C | |
| 24 | 172.1, C | 171.2, C | 168.5, C | 174.9, C | 172.1, C | 171.4, C | |
| 25 | 20.5, CH3 | 20.6, CH3 | 20.5, CH3 | 20.7, CH3 | 20.8, CH3 | 20.7, CH3 | |
| 26 | 20.0, CH2 | 25.3, CH2 | 25.3, CH2 | 25.0, CH2 | 25.3, CH2 | 25.2, CH2 | |
| 27 | 43.5, CH | 49.0, CH | 49.3, CH | 48.8, CH | 49.1, CH | 49.1, CH | |
| 28 | 82.2, C | 83.8, C | 84.5, C | 84.3, C | 83.9, C | 83.8, C | |
| 29 | 29.8, CH3 | 30.0, CH3 | 30.7, CH3 | 29.9, CH3 | 30.8, CH3 | 29.9, CH3 | |
| 30 | 27.2, CH3 | 29.0, CH3 | 29.0, CH3 | 25.9, CH3 | 28.8, CH3 | 28.3, CH3 | |
| OCH3 | 55.8, CH3 |
Data were measured in methanol-d4 at 151 MHz.
Data were measured in CDCl3 at 75.5 MHz. Chemical shifts (δ) are in ppm from TMS.
Figure 2.

COSY and key HMBC correlations for 2.
The coupling constant of 8.4 Hz suggested the 11,12-trans relative configuration of ring D in 2. The NOESY correlations between H-11 and H-15 and between H-12 and H-14 (Figure 3) indicated the equatorially-oriented hydroxy groups at both C-11 and C-12. Ring D assumes a sofa conformation with C-12 projecting below and C-13 above the xanthone plane, respectively. The (11S, 12R) absolute configuration was evident from the specific rotation of + 43 compared to +38 of a synthetic (3R,4S)-2,2-dimethylchroman-3,4-diol.30 Accordingly, 2 was determined as (3R,4S)-3,4,7,9,12-pentahydroxy-2,2-dimethyl-3,4-dihydropyrano[3,2-b]xanthen-6(2H)-one, which has the same planar but different stereochemical structure as a reported compound, based on their different specific rotation values.29
Figure 3.
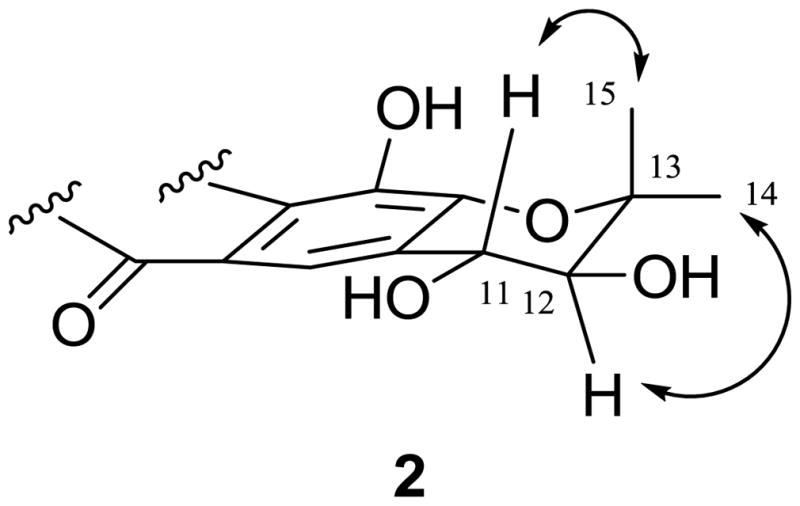
Selected NOESY correlations of 2.
Compound 3 was isolated as an amorphous light yellow powder, with a molecular formula of C34H40O9, as determined by HRESIMS (m/z 615.2556 [M + Na]+, calcd for 615.2570). Both the UV (λmax 229, 269, 278, 304, 320 nm) and IR [νmax 1743 (unconjugated carbonyl group), 1688 (α,β-conjugated carboxylic group), 1644 (hydrogen-bonded α,β-conjugated carbonyl group) cm−1] spectra showed absorption characteristics of a caged xanthone.22,31 In the 1H NMR spectrum, seven three-proton methyl singlets at δ 1.12, 1.33, 1.37, 1.43, 1.60, 1.71, and 1.93, two one-proton doublets at δ 6.60 (J = 9.9 Hz) and 5.50 (J = 9.9 Hz), and two one-proton triplets at δ 4.99 and 6.65, due to olefinic protons, indicated the presence of four prenyl groups in 3, as supported by its elemental formula. In addition, the 1H NMR spectrum also revealed a hydrogen-bonded hydroxy group (δ 11.90, s) at C-1 and a methoxy group (δ 3.28, s) at C-8, which were confirmed by HMBC correlations between the methoxy protons and C-8, and between the hydrogen-bonded hydroxy group and C-1 (Figure 4). The HMBC correlations between H-11 and C-1, H-12 and C-2, H-17 and C-4, H-22 and C-5, and H-27 and C-7 indicated that 3 is a 1,3-dihydroxy-2,4,5,7-tetraprenylxanthone derivative (Figure 4).
Figure 4.

COSY and key HMBC correlations for 3.
The absence of aromatic A ring hydrogen and carbon resonances in the 1H and 13C NMR spectra of 3 indicated a saturated and hence substituted cyclohexane moiety. The HMBC correlations between H-7 and a carbonyl carbon indicated the ketone to be at C-6. The COSY correlations showed a contiguous spin system comprising H-8a, H-8, H-7, H2-26, and H-27 (Figure 4), and, together with the HMBC correlations of H-29 and H-30 with C-28, H-29 and C-27, and H-27 and C-7, was in accordance with the presence of a prenyl group at C-7, with a gem-dimethyl group connected to an oxygen-substituted carbon (C-28). Two olefinic signals, H-11 at δ 5.50 and H-12 at δ 6.60 (both J = 9.9 Hz), were typical of a 2H-pyran ring in the presence of a free hydroxy group ortho to C-2.31 The HMBC correlations between H-11 and C-1 and C-3, H-12 and C-2, and H-14 and H-15 and C-12 were consistent with a dimethylpyran ring linked to C-2 and C-3 of the C ring bearing an isoprenyl group at C-4. The last prenyl group was assigned to C-5 on the basis of HMBC correlations of H-22 and C-5. In addition, the 13C NMR spectrum showed a carboxylic carbon resonance at δ 172.1, which correlated with H-22 in the HMBC spectrum, indicating that the C-5 prenyl group comprises an α,β-unsaturated carboxylic acid group. The appearance of three resonances of oxygenated quaternary carbons at δ 82.2, 86.4, and 88.4 implied a direct connection between C-10a and C-27, and a connection between C-5 and C-28 through an oxygen atom, which was strongly supported by HMBC correlations between H-8a and C-27, and H-29 and C-27 and C-28. Therefore, 3 was partially characterized as a tetraprenylxanthone, comprised of a tricyclic system, a dimethylpyran moiety, and a 2-methylbut-2-enyl carboxylate group.
The NMR data of 3 was similar to those of moreollic acid.31 The 13C NMR spectrum of moreollic acid contained resonances of C-22, C-23 and C-24 at δ 138.1, 127.9, and 171.3, respectively, while these signals of 3 occurred at δ 139.4 (C-22), 127.2 (C-23), and 172.1 (C-24). These differences suggested that 3 is an isomer of moreollic acid. Observation of a NOESY correlation between H-22 and H-25 (Figure 5), along with the lack of any correlation between H-21 and H-25 confirmed a Z-configured C-22-C-23 double bond.
Figure 5.

Selected NOESY correlations of 3.
Despite the fact that the first caged Garcinia xanthone, morellin, was described as early as 1937,32 and that approximately 100 of these bioactive compounds have since been reported, the issue of defining their absolute configuration has not been addressed. Thus, we initiated a study based on the chiroptical properties of this class of natural products in order to probe their absolute configuration, using (−)-morellic acid (10) (usually depicted as e11) as a model. The electronic circular dichroism (ECD) spectrum of 10 displayed negative and positive Cotton effects (CE) near 360 and 290 nm, respectively, reminiscent of the n→π*, π→π*, and 1Lb of electronic transitions of the appropriate chromophores. The ECD spectrum additionally displayed sequential negative and positive CEs at 246 and 215 nm. A UV absorption maximum at ca. 230 nm indicates that these CEs are indicative of exciton coupling33 arising from the α,β-unsaturated carbonyl and carboxylic acid chromophores. From Dreiding models and the energy minimized molecular model of compound 10 (Figure 6), it is evident that the electronic transition dipole moments of these chromophores, aligning C-8–C-9 and C-22–C-24, constitute negative exciton chirality, thus, indicating that the bridgehead C-26 and the C-6 carbonyl group extends, respectively, below and above the plane of the B, C-ring system. Such an arrangement defines unambiguously the S configuration of C-7. The ECD spectrum of (−)-isomoreollic acid (3) exhibited a high-amplitude positive CE at 214 nm. Due to the absence of the α,β-unsaturated carbonyl chromophore, the spectrum did not show exciton coupling. Based on presumed similar biosynthetic origins for 3 and (−)-morellic acid (10), C-7 of 3 was also assigned as a S configuration.
Figure 6.

Optimized geometries of predominant conformers of compound e11 at the B3LYP/6-31G** level in the gas phase.
The relative configuration of 3 was assessed by analysis of the NOESY data. The B-, C-, and D- rings of 3 were connected in the form of a conjugated plane. In turn, the A-ring occurred in a boat conformation connected with the B ring, with a C-26 and C-27 bridge above or below the plane to form a bicyclic [2.2.2]-octane unit (Figure 5).34,35 NOESY correlations were observed between H-7 and H-8, H-8a, H-21, H-29, and H-25, H-8 and H-8a, H-8a and H-22, and H-25, H-27 and H-30 and H-26a, H-25 and H-29, H-30, and H-22 (Figure 5). Based on these NOESY correlations and 7S configuration of 3, a S configuration for both C-10a and C-27 and a R configuration for C-5 and C-8a were assigned for 3. Thus, the absolute configuration of compound 3 may be defined as 5R, 7S, 8S, 8aR, 10aS, and 27S. Such an assignment was unambiguously confirmed by the theoretically calculated ECD spectrum of (−)-morellic acid (10, Figure S10).
Compound 4 gave a molecular formula of C33H38O8, 32 mass units (CH3OH) less than 3 and two mass units (2H) more than 10, as determined by HRESIMS (m/z 585.2417 [M + Na]+, calcd 585.2464). When the NMR spectra of 4 were compared with those of 3, an extra doublet at δ 7.52 (1H, d, J = 6.6 Hz) and an extra triplet at δ 5.18 (1H, t, J = 6.0 Hz) were evident. In turn, the doublets at δ 6.60 and δ 5.50 (both 1H, d, both J = 9.9 Hz) and the singlet at δ 3.28 (3H, s) in the spectrum of 3 were absent, indicating that 4 has an olefinic group and lacks a methoxy group at C-8.22 The HMBC spectrum of 4 displayed correlations between H-11 and C-1, H-12 and C-2, H-17 and C-4, suggesting the linkage of one prenyl group each at C-2 and C-4. Other HMBC correlations between H-29 and H-30 and C-28 and C-27, and H-27 and C-7, suggested the presence of a prenyl group at C-7. A 2-methylbut-2-enyl carboxylate group was assigned to C-5 on the basis of HMBC correlations of H-22 with C-5 and C-24.
Comparison of 4 and its isomer, gaudichaudiic acid22 showed that the compounds exhibit similar NMR spectra, except that gaudichaudiic acid presented a signal at δ 170.1 (C-24),22 while in the 13C NMR spectrum of 4, this signal appeared at δ 171.2. A NOESY correlation between H-25 and H-21 suggested an E-configured C-22, C-23 olefinic bond for 4. The closely comparable NOESY profiles of 4 and 10 (Supplementary Data, Figure S1) indicated their similar relative configurations. The ECD spectrum of 4 showed sequential negative and positive CEs near 240 and 220 nm, respectively, reminiscent of exciton coupling, hence reflecting the same 5R, 7S, 10aS, 27S absolute configuration as for (−)-morellic acid (10). Thus, the structure of 4 was determined as isogaudichaudiic acid.
Compound 5 was found to have a molecular formula of C33H36O9, as determined by HRESIMS (m/z 599.2260 [M + Na]+, calcd 599.2257). The similarities of its NMR spectra with those of 3, 4, and 10, indicated 5 to be a further caged xanthone. The appearance of an extra signal for an oxygenated carbon at δ 74.3 in the 13C NMR spectrum and a signal at δ 4.35 in the 1H NMR spectrum, when compared with 4, together with the HMBC correlations between H-17 and C-19 and C-20, suggested that 5 possesses a hydroxy group at C-17. Comparison of the NMR data of 5 with those of gaudichaudiic acid E,36 revealed that these two compounds are structurally similar. However, the specific rotation of 5 is −82, and that of gaudichaudiic acid E is -160.1. The NOESY spectrum of 5 showed a correlation between H2-21 and H-25, and, accordingly, 5 could be assigned as the (E)-C-22-C-23 isomer of gaudichaudiic acid E. The ECD spectrum of compound 5 showed negative and positive CEs near 240 and 220 nm, respectively, and together with the similar NOESY profiles of 5 and 4, indicated the same 5R, 7S, 10aS, 27S absolute configuration for 5. Owing to insufficient sample quantities, it was not possible to perform chiral derivatization in order to define the absolute configuration at C-17. Therefore, 5 was assigned as isogaudichaudiic acid E.
Compound 6 gave a molecular formula of C33H38O9, as established by HREIMS. Since 6 was found to be 18 mass units (H2O) greater in molecular weight than 10, the presence of an extra hydroxy group and the absence of one of the double bonds were concluded for 6. The signals at δ 3.10 and 4.65 in the 1H NMR spectrum and the signals at δ 26.9 and 91.5 in the 13C NMR spectrum indicated replacement of the C-11–C-12 double bond in 10 by the carbinol functionality in compound 6, which was supported by the correlations between H-14 and H-15 and C-12 in the HMBC spectrum of 6. The NOESY correlation between H-25 and H-22 indicated a Z-configured C-22–C-23 olefinic bond. The ECD spectrum of compound 6 showed positive CEs near 225 nm, and together with the similar NOESY profiles of 6 and 10 indicated the same 5R, 7S, 10aS, and 27S absolute configuration for 6. Due to insufficient sample quantities, we could not define the absolute configuration at C-12. Therefore, 6 was assigned as (5R,7S,10aS,27S)-11,12-dihydro-12-hydroxymorellic acid.
Compound 7 was assigned a molecular formula of C33H38O9 from its HREIMS (m/z 601.2436 [M + Na]+, calcd 601.2414), two mass units higher than that of 5. The lack of the two olefinic hydrogen doublets (H-11, H-12) in its 1H NMR spectrum indicated an acylic prenyl moiety in 7. Comparison of the NMR data of 7 with those of gaudichaudiic acid B,36 revealed that these two compounds are similar except for the chemical shift of the respective carboxylic carbon, which appeared at δ 170.0 for gaudichaudiic acid B but at δ 172.1 for 7. The NOESY correlation between H-25 and H-21 indicated an E-configured C-22, C-23 double bond. The ECD spectrum of compound 7 again showed sequential negative and positive CEs near 240 and 220 nm, respectively. When taken in conjunction with similar NOESY profiles, these Cotton effects indicated the same 5R, 7S, 10aS, 27S absolute configuration for 7. Owing to an insufficient sample quantity, chiral derivatization could not be performed to define the absolute configuration at C-17. Consequently, the structure of 7 was determined as isogaudichaudiic acid B.
The 13C NMR data of the known morellic acid (10) are shown for the first time in Table 3, and its absolute configuration was tentatively assigned as 5R, 7S, 10aS, and 27S by analysis of its COSY, NOESY, and ECD spectra. A theoretical ECD calculation approach using time dependent density functional theory37 was employed to unambiguously determine the absolute configuration of morellic acid (10). The geometry was built on the basis of a 5S, 7R, 10aR, 27R absolute configuration based on a 3D-structure of e11. A systematic conformational search was carried out using MMFF94 molecular mechanics force-field calculation in the SYBYL 8.1 program. An energy cutoff of 10 kcal/mol generated 47 conformers. The 22 conformers within 5 kcal/mol were geometrically optimized in the gas phase using density functional theory (DFT) at the B3LYP/6-31G** level. Seventeen of the conformers were relocated and confirmed as minima by harmonic vibrational frequency calculations at the same level. The 11 predominant conformers were found to contribute Boltzmann distributions greater than 98% by electronic and zero point energy (Table 4). The major differences between the conformers are merely the orientations of the two side chains at C-4 and C-5 (Supplementary Data). The ECD spectra of the 11 conformers were calculated at the B3LYP/6-31G** level in the gas phase. The weighted ECD spectrum (Figure 7) was found to exhibit a mirror-image relationship to the experimental ECD spectrum of (−)-morellic acid (10). Thus, its absolute configuration should be 5R, 7S, 10aS, 27S.
Table 4.
Important dihedral angles (degrees) of predominant conformers of e11
| e11- | 1 | 2 | 3 | 4 | 5 | 6 | 7 | 8 | 9 | 10 | 11 |
|---|---|---|---|---|---|---|---|---|---|---|---|
| C6-C5-C21-C22 | 165 | 162 | 64 | 168 | 66 | 64 | −63 | −62 | −61 | 161 | 66 |
| C5-C21-C22-C23 | 137 | 135 | −152 | −72 | −155 | −154 | −134 | −139 | −138 | 134 | −157 |
| (H)O-C24-C23-C22 | −174 | 4 | 174 | −177 | 175 | 175 | 177 | 168 | 167 | 4 | −6 |
| C3-C4-C16-C17 | 88 | 88 | 91 | 91 | −72 | −91 | 92 | −94 | −91 | 87 | −68 |
| C4-C16-C17-C18 | 124 | 123 | 124 | 126 | −113 | 132 | 124 | −127 | −125 | −179 | −102 |
Figure 7.

Calculated ECD spectra of the nine predominant conformers of compound e11 in the gas phase at the B3LYP/6-31G** level.
Weighted ECD spectrum of compound e11 (dashed line) in the gas phase at the B3LYP/6-31G** level and its mirror-image (red line) and experimental ECD spectrum (blue line) of (−)-morellic acid (10) in MeOH.
2.2. Bioactivity evaluation of the isolated compounds
The compounds isolated from G. lateriflora were evaluated for their ability to inhibit proteasome activity, using bortezomib as the positive control (Table 5). The biflavonoids were active with morelloflavone (8) being the most potent compound (IC50 = 1.3 μM). This is the first report of biflavonoids inhibiting the enzymatic activity at the proteasome. The compounds were also evaluated for their cytotoxicity against the HT-29 human colon cancer cell line, using paclitaxel as the positive control (Table 5). Interestingly, only the caged xanthones showed potent cytotoxicity towards HT-29 cells, with compound 10 being the most active (ED50 = 0.36 μM). This compound was tested further in an in vivo hollow fiber assay, using LNCaP, HT-29, MCF-7 and MDA-MB 435 human cancer cells, with the tubes administered intraperitoneally. However, it was found to be inactive at the highest dose tested (20 mg/kg) for all cell lines.
Table 5.
Proteasome inhibition and cytotoxicity of compounds from G. laterifloraa
| Compound | Proteasome Inhibitionb IC50 (μM) | Cytotoxicityd ED50 (μM) |
|---|---|---|
| 2 | NTc | >10 |
| 3 | >10 | 1.9 |
| 4 | >10 | 3.2 |
| 5 | >10 | 2.6 |
| 6 | NTc | 2.9 |
| 7 | NTc | >10 |
| 8 | 1.3 | >10 |
| 9 | 4.4 | >10 |
| 10 | >10 | 0.36 |
All other compounds isolated in this study are inactive in these assay systems.
Bortezomib was used as positive control (IC50, 2.5 nM) towards HT-29 cell line.
Not tested.
Paclitaxel was used as positive control (ED50, 0.10 nM).
3. Experimental
3.1. General experimental procedures
Melting points were measured using a Fisher Scientific apparatus and are uncorrected. Optical rotations were measured with a Perkin-Elmer 343 polarimeter. UV spectra were recorded on a Shimadzu UV-2401 PC UV-vis recording spectrophotometer. CD measurements were performed using a JASCO ORDM-401 CD spectrometer. IR spectra were recorded on a Nicolet 6700 FT-IR spectrometer. 1H and 13C NMR data, including DEPT, HMQC, HMBC, NOESY, and COSY spectra, were recorded at room temperature on a Bruker Avance DRX-800, DRX-600 or DPX-300 MHz spectrometer with TMS as internal standard. ESIMS and HRESIMS were recorded on a VG 7070-HF mass spectrometer. Column chromatography was conducted using silica gel (70–230 mesh, Merck, Darmstadt, Germany). Analytical and preparative thin-layer chromatography (TLC) were performed on precoated silica gel 60 F254 (Sorbent Technologies, Atlanta, GA, 0.20 mm layer thickness) plates. Sephadex LH-20 was purchased from Amersham iosciences, Uppsala, Sweden. For visualization of TLC plates, sulfuric acid reagent was used. Fluorescence was tested under a Spectroline (Model ENF-260C) UV light. For the proteasome inhibition assay, the Suc-LLVY-AMC substrate was obtained from Calbiochem (San Diego, CA).
3.2. Plant material
The stem bark of Garcinia lateriflora Blume (Clusiaceae) was collected at Gunung Kancana, Cianjur, West Java, Indonesia in August, 2003, and identified by S. R. A voucher specimen (A05777) has been deposited at the Field Museum of Natural History, Chicago, IL, under the accession number B-97.
3.3. Extraction and isolation
The milled, air-dried stem bark of G. lateriflora (840 g) was extracted with MeOH (3 L × 5) at room temperature, and the solvent evaporated in vacuo. The dried MeOH extract (140 g, 16.67%) was resuspended in 10% H2O in MeOH (500 mL) and partitioned with n-hexane (500 mL × 3) to yield a hexane-soluble residue (1.5 g, 0.18%). The aqueous layer was partitioned with CHCl3 (500 mL × 3) to afford a chloroform-soluble extract (0.1 g, 0.01%), which was followed by washing with a 1% aqueous solution of NaCl, to partially remove tannins. Partition of the aqueous layer with EtOAc (500 mL × 3) afforded an ethyl acetate-soluble extract (61 g, 7.26%), which was also washed with a 1% aqueous solution of NaCl. The hexane-soluble extract exhibited cytotoxicity towards the HT29 cell line (ED50 < 5.0 μg/mL), and the ethyl acetate-soluble extract exhibited proteasome inhibition (IC50 < 5.0 μg/mL). Both the chloroform-soluble and aqueous-soluble extracts were inactive in the two bioassay systems used.
The hexane-soluble extract (1.5 g) was subjected to silica gel column chromatography (2.5 × 20 cm) and eluted with a gradient of n-hexane–acetone (100:1, 80:1, 60:1, 40:1, 10:1, 5:1, 1:1, 200 mL each). Fractions were pooled after TLC analysis to give seven combined fractions (D001F01 D001F07). Of these, D001F05 and D001F06 (ED50 < 2.0 μg/mL) were further chromatographed on a silica gel column (2.5 × 20 cm) and eluted with a gradient of n-hexane-acetone (20:1, 15:1, 10:1, 8:1, 5:1, 3:1, 1:1, 200 mL each), to yield seven combined fractions (D001F0501-D001F0507). Fraction D001F0501 was chromatographed over silica gel using n-hexane-acetone (10:1) as solvent, and purified by Sephadex LH-20 column (3.5 × 25 cm) chromatography, eluted with chloroform-methanol (1:1), affording 3 (20 mg). Fraction D001F0502 was purified by silica gel chromatography, eluted by n-hexane-acetone (10:1), and further purified by Sephadex LH-20 chromatography, eluted with a mixture of chloroform-methanol (1:1), to afford 10 (25 mg). Fraction D001F0503 was chromatographed over silica gel, eluted by n-hexane-acetone (8:1), affording 3β-acetoxyurs-12-en-28-oic acid (4 mg). Fraction D001F0504 was chromatographed over silica gel, eluted by n-hexane-acetone (3:1), and then purified by Sephadex LH-20 column chromatography, using chloroform-methanol (1:1), affording 4 (20 mg). Fraction D001F0505 was chromatographed over silica gel, eluted with n-hexane-acetone (3:1), and purified by Sephadex LH-20 column chromatography, eluted by chloroform-methanol (1:1), producing 5 (15 mg). Fraction D001F0506 was chromatographed over silica gel, eluted by n-hexane-acetone (3:1), and purified by preparative TLC in n-hexane-acetone (3:1), yielding 6 (2 mg, Rf 0.51). Fraction D001F0507 was chromatographed over silica gel, eluted by n-hexane-acetone (3:1), and purified by preparative TLC, in n-hexane-acetone (3:1), yielding 7 (2 mg, Rf 0.49).
The ethyl acetate-soluble extract (61 g) was subjected to silica gel column chromatography (4.5 × 40 cm), eluted by a gradient of CHCl3-MeOH (100:1, 80:1, 60:1, 40:1, 30:1, 20:1, 10:1, 5:1, 1:1, 1000 mL each). Fractions were pooled after TLC analysis and afforded nine combined fractions (D003F01-D003F09). Fractions D003F06 and D003F07 showed proteasome inhibitory activity (IC50 < 5.0 μg/mL), and were combined (8.9 g), and chromatographed over a silica gel column (2.5 × 20 cm), eluted by a gradient of CHCl3-MeOH (50:1, 40:1, 30:1, 20:1, 10:1, 5:1, 1:1, 200 mL each), to yield seven fractions (D003F0601-D003F0607). Fraction D003F0601 was chromatographed over silica gel, eluted by CHCl3-MeOH (10:1), and purified by preparative TLC, in CHCl3-MeOH (10:1), affording 9 (5 mg, Rf 0.30 ). Fraction D003F0602 was chromatographed over silica gel, eluted by CHCl3-MeOH (10:1), and then purified by preparative TLC, in CHCl3-MeOH (10:1), affording rhusflavanone (20 mg, Rf 0.27). Fraction D003F0603 and D003F0604 was purified by chromatography over silica gel, eluted with CHCl3-MeOH (10:1), and then purified by preparative TLC in CHCl3-MeOH (10:1), yielding 2 (1.5 mg, Rf 0.23). Fraction D003F0605 was chromatographed over silica gel, eluted by CHCl3-MeOH (10:1), to produce stigma-5,13-diene-3β-O-D-glucoside (5 mg). Fraction D003F0606 was chromatographed over silica gel, eluted by CHCl3-MeOH (6:1), and purified by Sephadex LH-20 column chromatography, eluted by methanol, and finally purified by preparative TLC, in CHCl3-MeOH (6:1), to yield 1 (10 mg, Rf 0.25). Fraction D003F0607 was chromatographed over silica gel, eluted by CHCl3-MeOH (6:1), and purified by Sephadex LH-20 column chromatography, eluted by methanol, yielding 8 (25 mg).
3.3.1. Lateriflavanone (1)
Amorphous white powder (CHCl3) showing a yellow color under UV light at 365 nm; [α] 20D + 29 (c 0.1, MeOH); UV (MeOH) λmax (log ε) 216 (4.67), 291 (4.52) nm; CD (MeOH) λmax (Δε) 244 (−9.3 × 10³), 292 (+3.5 × 10⁴), 320 (−8.3 × 10³) nm; IR (dried film) νmax 3320, 1633, 1519, 1446, 1264, 1088 cm−1; 1H and 13C NMR data, see Table 1; positive ESIMS m/z 581.1 [M + Na]+; positive HRESIMS (m/z) found 581.1032, calcd 581.1060 for C30H22O11Na.
3.3.2. Laterixanthone (2)
Colorless needles (acetone) showing a pink color under UV light at 365 nm; mp 160–161 °C; [α]20D + 43 (c 0.1, MeOH); UV (MeOH) λmax (log ε) 204 (4.37), 254 (4.51), 284 (3.84), 326 (4.17) nm; CD (MeOH) λmax (Δε) 246.0 (−2.0 × 10³), 253 (−1.4 × 10³), 301 (−1.8 × 10³), 327 (−8.2 × 10³) nm; IR (dried film) νmax 3362, 2922, 2851, 1633, 1606, 1582, 1469, 1349.3, 1254, 1167, 1083 cm−1; 1H and 13C NMR data, see Tables 2 and 3; positive ESIMS m/z 383.1 [M + Na]+; positive HRESIMS (m/z) found 383.0769, calcd 383.0743 for C18H16O8Na.
3.3.3.(−)-Isomoreollic acid (3)
Amorphous light-yellow powder showing a brown color under UV light at 365 nm; [α]20D - 52 (c 0.1, CH2Cl2); UV (CH2Cl2) λmax (log ε) 229 (4.23), 269 (4.38), 278 (4.42), 304 (3.95), 320 (4.01) nm; CD (CH2Cl2) λmax (Δε) 227 (+8.2 × 10⁴), 244 (+1.3 × 10⁴), 279 (−2.3 × 10⁴), 327.5 (−2.7 × 10⁴), 361.5 (−1.9 × 10⁴) nm; IR (dried film) νmax 2977, 1743, 1688, 1644, 1459, 1255, 1187, 1046 cm−1; 1H and 13C NMR data, see Tables 2 and 3; positive ESIMS m/z 615.2 [M + Na]+; positive HRESIMS (m/z) found 615.2556, calcd 615.2570 for C34H40O9Na.
3.3.4. (−)-Isogaudichaudiic acid (4)
Amorphous orange-powder showing a brown color under UV light at 365 nm; [α]20D - 87 (c 0.1, CH2Cl2); UV (CH2Cl2) λmax (log ε) 230 (4.26), 268 (3.72), 277 (3.72), 355 (3.93) nm; CD (CH2Cl2) λmax (Δε) 219 (+3.2 × 10⁴), 238 (−9.3 × 10³), 284 (+1.3 × 10⁴), 315 (+9.0 × 10³), 353 (−3.2 × 10⁴) nm; IR (dried film) νmax 3400, 1737, 1690, 1633, 1441, 1260, 1139, 1047 cm−1; 1H and 13C NMR data, see Tables 2 and 3; positive ESIMS m/z 585.2 [M + Na]+; positive HRESIMS (m/z) found 585.2417, calcd 585.2464 for C33H38O8Na.
3.3.5. (−)-Isogaudichaudiic acid E (5)
Amorphous yellow powder showing a brown color under UV light at 365 nm; [α]20D - 82 (c 0.1, CH2Cl2); UV (CH2Cl2) λmax (log ε) 230 (4.36), 279 (4.08), 290 (4.08), 357 (4.08) nm; CD (CH2Cl2) λmax (Δε) 224.5 (+2.8 × 10⁴), 243.5 (−3.4 × 10³), 291.5 (+1.8 × 10⁴), 354.0 (−2.8 × 10⁴) nm; IR (dried film) νmax 2975, 1738, 1693, 1633, 1435, 1260, 1141 cm−1; 1H and 13C NMR data, see Tables 2 and 3; positive ESIMS m/z 599.2 [M + Na]+; positive HRESIMS (m/z) found 599.2260, calcd 599.2257 for C33H36O9Na.
3.3.6. (−)-11,12-Dihydro-12-hydroxymorellic acid (6)
Amorphous yellow powder showing a brown color under UV light at 365 nm; [α]20D - 458 (c 0.1, CH2Cl2); UV (CH2Cl2) λmax (log ε) 232 (4.49), 268 (4.08), 277 (4.08), 359 (4.25) nm; CD (CH2Cl2) λmax (Δε) 225.5 (+1.7 × 10⁴), 284 (+2.3 × 10⁴), 317 (+1.5 × 10⁴), 354.5 (−5.4 × 10⁴) nm; IR (dried film) νmax 3459, 1736, 1687, 1633, 1594, 1399, 1266, 1106 cm−1; 1H and 13C NMR data, see Tables 2 and 3; positive ESIMS m/z 601.2 [M + Na]+; positive HRESIMS (m/z) found 601.2394, calcd 601.2414 for C33H38O9Na.
3.3.7. (−)-Isogaudichaudiic acid B (7)
Amorphous yellow powder showing a brown color under UV light at 365 nm; [α]20D - 378 (c 0.1, CH2Cl2); UV (CH2Cl2) λmax (log ε) 231 (4.32), 268 (3.74), 355 (4.05) nm; CD (CH2Cl2) λmax (Δε) 225 (+1.5 × 10⁴), 238 (−8.8 × 10³), 285 (+1.8 × 10⁴), 315 (+1.9 × 10⁴), 353 (−4.9 × 10⁴) nm; IR (dried film) νmax 2980, 1738, 1690, 1634, 1435, 1262, 1137, 1050 cm−1; 1H and 13C NMR data, see Tables 2 and 3; positive ESIMS m/z 601.2 [M + Na]+; positive HRESIMS (m/z) found 601.2436, calcd 610.2414 for C33H38O9Na.
3.3.8. (−)-Morellic acid (10)
Amorphous orange powder showing brown fluorescence under an UV light at 365 nm; mp 108–109 °C; [α]20D - 373 (c 0.1, CH2Cl2); UV (CH2Cl2) λmax (log ε) 229.0 (4.02), 280.5 (3.92), 289.5 (3.90), 363.5 (3.83) nm; IR (dried film) νmax 2977.0, 2928.2, 1737.7, 1689.6, 1632.7, 1593.5, 1259.1, 1188.4, 670.1 cm−1; CD (CH2Cl2) λmax (Δε) 217.5 (+5.6 × 10³), 224 (+2.1 × 10⁴), 246 (−1.1 × 10⁴), 293.5 (+1.7 × 10⁴), 360.5 (−2.0 × 10⁴) nm; 1H and 13C NMR data, see Tables 2 and 3; positive ESIMS m/z 583.2 [M + Na]+; positive HRESIMS (m/z) found 583.2314, calcd 583.2308 for C33H36O8Na.
3.4. Methods of computational calculations
The calculations were performed by the SYBYL 8.1 program (Tripos International, St. Louis, MO) and the Gaussian03 program package. MMFF94 molecular mechanics force-field calculations were employed to search the possible conformations. All ground-state geometries were optimized at the B3LYP/6-31G** level at 298 K, and harmonic frequency analysis was computed to confirm the minima. TDDFT at the same level was employed to calculate excitation energy (in nm) and rotatory strength R (velocity form Rvel and length form Rlen in 10−40 erg-esu-cm/Gauss) between different states. The ECD spectra were then simulated by overlapping Gaussian functions for each transition according to where σ is, the width of the band at 1/e height and ΔEi and Ri are the excitation energies and rotatory strengths for transition i, respectively. In this work, σ = 0.15 eV and Rlen were used.
3.5. Proteasome inhibition assay
A proteasome inhibition assay was performed by a reported method.38 The test samples, positive control, and proteasome fraction were prepared or diluted in the assay buffer. The enzyme reaction was started by adding Suc-LLVY-AMC substrate with a final concentration of 10 μM. The plates were incubated, and the chymotrypsin-like proteasome activity was determined by measuring the generation of free AMC using a fluorescent plate reader.
3.6. Cytotoxicity assay
Cytotoxicity of the samples was screened against HT-29 human colon cancer cells by a previously reported procedure.39 The samples were dissolved in DMSO. The cells cultured under the standard condition were trypsinized. The harvested cells were added to 96-well plates and treated by either the samples or DMSO (the negative control). The plates were incubated at 37 °C in 5% CO2 for three days, and the cells were fixed to the plates. The fixed cells were incubated at room temperature for 30 min, washed with water once, dried at room temperature overnight, and dyed by sulforhodamine B. After the dyed cells were lysed in the tris-base buffer, the plates were read at 515 nm with an ELISA reader. Cytotoxicity was calculated by comparison of the values measured from the cells treated with the samples and the negative control.
3.7. Hollow fiber assay
The hollow fiber assay was conducted as described previously40 and summarized here. Human cancer cell lines designated LNCaP (prostate adenocarcinoma), HT29 (colon adenocarcinoma), MCF-7 (breast cancer cells), MDA-MB-435 (melanoma cells) and were propagated in RPMI-1640 medium supplemented with fetal bovine serum (5% vol/vol) and 2 mM glutamine at 37 °C in a 5% CO2 atmosphere. Monolayer cultures in late log-phase growth were released by digestion with trypsin, and suspended in medium. Sterile conditioned polyvinylidene fluoride hollow fibers perforated41 with 500 kDa molecular weight exclusion pores were filled with the cells (HT29: 1.5 × 10⁴; MCF-7 and MDA-MB 435: 7.5 × 10⁴ per fiber). The fibers were then heat sealed at two-cm intervals and cut to generate the fibers used for the study. The mice were treated with morellic acid (10) at 0.5, 1, 5, and 10 mg/kg in four daily ip injections on days 3, 4, 5 and 6 followed by fiber retrieval on day 7. Paclitaxel was administered at 2 mg/kg in a 10% EtOH:Tween 80 (1:1) solution. The vehicle group was split so that half received the 2.5% DMSO vehicle and the other half received 10% EtOH:Tween 80 (1:1) vehicle. The percent net growth for each cell line in each treatment group was calculated by subtracting the day-zero absorbance from the day 7 absorbance and dividing this difference by the net growth in the day 7 vehicle-treated controls minus the day-zero values.
Supplementary Material
Acknowledgments
This investigation was supported by grants U01 CA52956 and P01 CA125066, funded by the National Cancer Institute, NIH, Bethesda, MD. We wish to acknowledge the late Mr. Agus Ruskandi for assistance with the plant collection, and we also thank the Mississippi center for Super computing Research (MCSR) for computational facilities.
Footnotes
COSY and key HMBC correlations of compounds 1, 4–7, and 10, selected NOESY correlations of compounds 4–7, and 10, mass and 1H, 13C, and HMBC NMR spectra of compounds 1 from G. lateriflora, mass and 1H and 13C NMR spectra of compounds 2–7 from G. lateriflora, calculated spectra of the nine predominant conformers of compound e11 in the gas phase at the B3LYP/6-31G** level, important thermodynamic parameters of compound e11 and conformational analyses, evaluation of morellic acid (10) in an in vivo hollow fiber assay. Supplementary data associated with this article can be found in the online version.
Publisher's Disclaimer: This is a PDF file of an unedited manuscript that has been accepted for publication. As a service to our customers we are providing this early version of the manuscript. The manuscript will undergo copyediting, typesetting, and review of the resulting proof before it is published in its final citable form. Please note that during the production process errors may be discovered which could affect the content, and all legal disclaimers that apply to the journal pertain.
References and notes
- 1.Perry LM, Metzger J. Medicinal Plants of East and South-East Asia. MIT Press; London: 1980. p. 175. [Google Scholar]
- 2.Sukpondma Y, Rukachaisirikul V, Phongpaichit S. J Nat Prod. 2005;68:1010–1017. doi: 10.1021/np0580098. [DOI] [PubMed] [Google Scholar]
- 3.Rukachaisirikul V, Kaewnok W, Koysomboon S, Phongpaichit S, Taylor WC. Tetrahedron. 2000;56:8539–8543. [Google Scholar]
- 4.Rukachaisirikul V, Painuphong P, Sukpondma Y, Koysomboon S, Sawangchote P, Taylor WC. J Nat Prod. 2003;66:933–938. doi: 10.1021/np030080v. [DOI] [PubMed] [Google Scholar]
- 5.Lin YM, Chen FC, Lee KH. Planta Med. 1989;55:166–168. doi: 10.1055/s-2006-961914. [DOI] [PubMed] [Google Scholar]
- 6.Liu WK, Cheung FWK, Liu BPL, Li CM, Ye WC, Che CT. J Nat Prod. 2008;71:842–846. doi: 10.1021/np8001223. [DOI] [PubMed] [Google Scholar]
- 7.Lin YM, Anderson H, Flavin MT, Pai YHS. J Nat Prod. 1997;60:884–888. doi: 10.1021/np9700275. [DOI] [PubMed] [Google Scholar]
- 8.Lin YM, Flavin MT, Schure R, Chen FC, Sidwell R, Barnard DL, Huffman JH, Kern ER. Planta Med. 1999;65:120–125. doi: 10.1055/s-1999-13971. [DOI] [PubMed] [Google Scholar]
- 9.Feng BM, Wang T, Zhang Y, Hua HM, Jia JM, Zhang HL, Pei YH, Shi LY, Wang YQ. Pharm Biol. 2005;43:12–14. [Google Scholar]
- 10.Mbwambo ZH, Kapingu MC, Moshi MJ, Machumi F, Apers S, Cos P, Ferreira D, Marais JPJ, Vanden-Berghe D, Maes L, Vlietinck A, Pieters L. J Nat Prod. 2006;69:369–372. doi: 10.1021/np050406v. [DOI] [PubMed] [Google Scholar]
- 11.Cao SG, Wu XH, Sim KY, Tan BKH, Pereira JT, Wong WH, Hew NF, Goh SH. Tetrahedron Lett. 1998;39:3353–3356. [Google Scholar]
- 12.Thoison O, Fahy J, Dumontet V, Chiaroni A, Riche C, Tri MV, Sevenet T. J Nat Prod. 2000;63:441–446. doi: 10.1021/np9903088. [DOI] [PubMed] [Google Scholar]
- 13.Xu YJ, Yip SC, Kosela S, Fitri E, Hana M, Goh SH, Sim KY. Org Lett. 2000;2:3945–3948. doi: 10.1021/ol006730t. [DOI] [PubMed] [Google Scholar]
- 14.Wu ZQ, Guo QL, You QD, Zhao L, Gu HY. Biol Pharm Bull. 2004;27:1769–1774. doi: 10.1248/bpb.27.1769. [DOI] [PubMed] [Google Scholar]
- 15.Qin YX, Meng LH, Hu CX, Duan WH, Zuo ZL, Lin LP, Zhang XW, Ding J. Mol Cancer Ther. 2007;6:2429–2440. doi: 10.1158/1535-7163.MCT-07-0147. [DOI] [PubMed] [Google Scholar]
- 16.(a) Kosela S, Cao SG, Wu XH, Vittal JJ, Sukri T, Masdianto, Goh SH, Sim KY. Tetrahedron Lett. 1999;40:157–160. [Google Scholar]; (b) Nicolaou KC, Sasmal PK, Xu H, Namoto K, Ritzen A. Angew Chem Int Ed. 2003;42:4225–4229. doi: 10.1002/anie.200351805. [DOI] [PubMed] [Google Scholar]; (c) Nicolaou KC, Sasmal PK, Xu H. J Am Chem Soc. 2004;126:5493–5506. doi: 10.1021/ja040037+. [DOI] [PubMed] [Google Scholar]
- 17.Kinghorn AD, Carcache-Blanco EJ, Chai HB, Orjala J, Farnsworth NR, Soejarto DD, Oberlies NH, Wani MC, Kroll DJ, Pearce CJ, Swanson SM, Kramer RA, Rose WC, Fairchild CR, Vite GD, Emanuel S, Jarjoura D, Cope FO. Pure Appl Chem. 2009;81:1051–1063. doi: 10.1351/PAC-CON-08-10-16. [DOI] [PMC free article] [PubMed] [Google Scholar]
- 18.Duddeck H, Snatzke G, Yemul SS. Phytochemistry. 1978;17:1369–1373. [Google Scholar]
- 19.Joshi BS, Kamat VN, Viswanathan N. Phytochemistry. 1970;9:881–888. [Google Scholar]
- 20.Chari VM, Ilyas M, Wagner H, Neszmelyi A, Chen FC, Chen LK, Lin YC, Lin YM. Phytochemistry. 1977;16:1273–1278. [Google Scholar]
- 21.Faizi S, Ali M, Saleem R, Irfanullah, Bibi S. Magn Reson Chem. 2001;39:399–405. [Google Scholar]
- 22.Han QB, Wang YL, Yang L, Tso TF, Qiao CF, Song JZ, Xu LJ, Chen SL, Yang DJ, Xu HX. Chem Pharm Bull. 2006;54:265–267. doi: 10.1248/cpb.54.265. [DOI] [PubMed] [Google Scholar]
- 23.Fujita R, Duan HQ, Takaishi Y. Phytochemistry. 2000;53:715–722. doi: 10.1016/s0031-9422(99)00557-9. [DOI] [PubMed] [Google Scholar]
- 24.Bandaranayake WM, Selliah SS, Sultanbawa MUS. Phytochemistry. 1975;14:1878–1880. [Google Scholar]
- 25.Waterman PG, Crichton EG. Phytochemistry. 1980;19:2723–2726. [Google Scholar]
- 26.(a) Gaffield W. Tetrahedron. 1970;26:4093–4108. [Google Scholar]; (b) Li XC, Joshi AS, Tan B, Elsohly HN, Walker LA, Zjawiony JK, Ferreira D. Tetrahedron. 2002;58:8709–8717. [Google Scholar]
- 27.Ito C, Itoigawa M, Takakura T, Ruangrungsi N, Enjo F, Tokuda H, Nishino H, Furukawa H. J Nat Prod. 2003;66:200–205. doi: 10.1021/np020290s. [DOI] [PubMed] [Google Scholar]
- 28.Nilar, Nguyen LHD, Venkatraman G, Sim KY, Harrison LJ. Phytochemistry. 2005;66:1718–1723. doi: 10.1016/j.phytochem.2005.04.032. [DOI] [PubMed] [Google Scholar]
- 29.(a) Shen J, Yang JS. Chem Pharm Bull. 2006;54:126–128. doi: 10.1248/cpb.54.126. [DOI] [PubMed] [Google Scholar]; (b) Han QB, Tian HL, Yang NY, Qiao CF, Song JZ, Chang DC, Luo KQ, Xu HX. Chem Biodiv. 2008;5:2710–2717. doi: 10.1002/cbdv.200890225. [DOI] [PubMed] [Google Scholar]
- 30.Boyd DR, Sharma ND, Boyle R, Evans TA, Malone JF, McCombe KM, Dalton H, Chima J. J Chem Soc Perkin Trans. 1996;1:1757–1765. [Google Scholar]
- 31.Asano J, Chiba K, Tada M, Yoshii T. Phytochemistry. 1996;41:815–20. doi: 10.1016/0031-9422(95)00682-6. [DOI] [PubMed] [Google Scholar]
- 32.Rao B. J Chem Soc. 1937;1937:853–855. [Google Scholar]
- 33.Berova N, Nakanishi K. In: In Circular Dichroic Principles and Applications. Berova N, Nakanishi K, Woody RW, editors. Chapter 12. John Wiley & Sons; New York: 2000. pp. 337–382. [Google Scholar]
- 34.Almqvist F, Ekman N, Frejd T. J Org Chem. 1996;61:3794–3798. doi: 10.1021/jo9601167. [DOI] [PubMed] [Google Scholar]
- 35.Friberg A, Sarvary I, Wendt OF, Frejd T. Tetrahedron Asymm. 2008;19:1765–1777. [Google Scholar]
- 36.Cao SG, Sng VHL, Wu XH, Sim KY, Tan BKH, Pereira JT, Goh SH. Tetrahedron. 1998;54:10915–10924. [Google Scholar]
- 37.(a) Diedrich C, Grimme S. J Phys Chem A. 2003;107:2524–2539. [Google Scholar]; (b) Crawford TD, Tam MC, Abrams ML. J Phys Chem A. 2007;111:12058–12068. doi: 10.1021/jp075046u. [DOI] [PubMed] [Google Scholar]; (c) Stephens PJ, Devlin FJ, Gasparrini F, Ciogli A, Spinelli D, Cosimelli B. J Org Chem. 2007;72:4707–4715. doi: 10.1021/jo070302k. [DOI] [PubMed] [Google Scholar]; (d) Ding Y, Li XC, Ferreira D. J Org Chem. 2007;72:9010–9017. doi: 10.1021/jo071134z. [DOI] [PubMed] [Google Scholar]; (e) Berova N, Bari LD, Pescitelli G. Chem Soc Rev. 2007;36:914–931. doi: 10.1039/b515476f. [DOI] [PubMed] [Google Scholar]; (f) Ding Y, Li XC, Ferreira D. J Nat Prod. 2009;72:327–335. doi: 10.1021/np800146v. [DOI] [PMC free article] [PubMed] [Google Scholar]
- 38.Deng Y, Balunas MJ, Kim JA, Lantvit DD, Chin YW, Chai HB, Sugiarso S, Kardono LBS, Fong HHS, Pezzuto JM, Swanson SM, Carcache de Blanco EJ, Kinghorn AD. J Nat Prod. 2009;72:1165–1169. doi: 10.1021/np9001724. [DOI] [PMC free article] [PubMed] [Google Scholar]
- 39.Seo EK, Kim N-C, Mi QW, Chai HB, Wall ME, Wani MC, Navarro HA, Burgess JP, Graham JG, Cabieses F, Tan GT, Farnsworth NR, Pezzuto JM, Kinghorn AD. J Nat Prod. 2001;64:1483–1485. doi: 10.1021/np0103158. [DOI] [PubMed] [Google Scholar]
- 40.Mi Q, Pezzuto JM, Farnsworth NR, Wani MC, Kinghorn AD, Swanson SM. J Nat Prod. 2009;72:573–80. doi: 10.1021/np800767a. [DOI] [PMC free article] [PubMed] [Google Scholar]
- 41.Hollingshead MG, Alley MC, Camalier RF, Abbott BJ, Mayo JG, Malspeis L, Grever MR. Life Sci. 1995;57:131–141. doi: 10.1016/0024-3205(95)00254-4. [DOI] [PubMed] [Google Scholar]
Associated Data
This section collects any data citations, data availability statements, or supplementary materials included in this article.