

The causes of glioblastoma and other devastating gliomas remain obscure 1,2. To discover new candidate genes that might influence glioma susceptibility, we conducted a principal component 3 adjusted genome wide association study (GWAS) of 275,895 autosomal variants among 692 adult high grade glioma patients (622 from the San Francisco Adult Glioma Study (AGS) and 70 from the Cancer Genome Atlas (TCGA) 4 versus 3992 controls (602 from AGS and 3390 from Illumina iControlDB (iControls)). For replication, we then analyzed the 13 SNPs with p<10−6 using completely independent data from 176 high grade glioma patients versus 174 controls from the Mayo Clinic. Rs1412829 in chromosome 9p21 (near CDKN2B) had discovery p-value 3.4*10−8, replication p-value 0.0038, and combined p-value 1.85*10−10. Rs6010620 intronic to RTEL1 had discovery p-value 1.5*10−7, replication p-value 0.00035, and combined p-value 3.40*10−9. For both SNPs, the direction of association was the same in discovery and replication phases.
Supplementary Tables 1a and 1b give subject characteristics including participation rates for the discovery GWAS and replication phases, respectively. The distribution of p-values from the principal component adjusted logistic regression additive model across the genome for high grade glioma cases versus controls (Figure 1) suggests potentially meaningful associations for several SNPs (single nucleotide polymorphisms) in chromosomes 1, 5, 9, 11 and 20. Supplementary Table 2 summarizes results for the 13 SNPs with p-values <10−6 for association with high grade glioma in discovery data along with results from replication data; SNPs with Hardy-Weinberg p<10−5 in controls or with >5% missing data in any case or control group were excluded. Three of these 13 SNPs (rs1412829 in 9p21, and rs6010620 and rs4809324 intronic to RTEL1) had significant association with high grade glioma risk in the discovery phase (principal component analysis p-values less than 1.8*10−7), were independent risk predictors in a multivariable analysis of 13 top hits, and were replicated in the Mayo Clinic dataset (Table 1). As shown in Table 1 and Supplementary Table 2, the minor allele frequencies for the three SNPs consistently differ in the same direction between high grade glioma cases and controls regardless of data source (AGS, TCGA, iControls or Mayo Clinic). Supplementary Table 3 shows results from the multivariable model of discovery data that included all thirteen SNPs (four from the 9p21 region, three in RTEL1, plus six others in other locations). Eight SNPs including one in the 9p21 region and two intronic to RTEL1 remained independently associated with high grade glioma risk after adjustment for other SNPs. This was expected given the strong linkage disequilibrium evident for the four 9p21 SNPs and two of the three RTEL1 SNPs (Supplementary Table 4).
Figure 1.
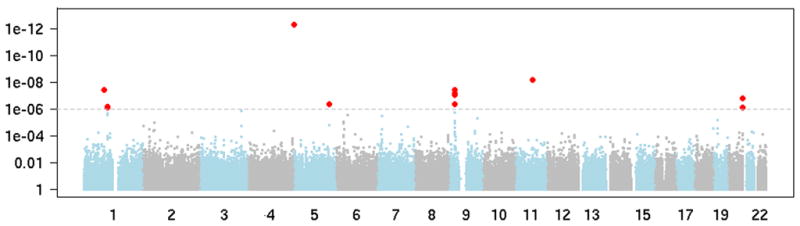
The distribution of p-values from principal component adjusted logistic regression additive model across the genome for high grade glioma cases versus controls. The 13 SNPs with p<10−6 are shown in red.
Table 1.
Three independent single nucleotide polymorphisms (SNPs) from high grade glioma discovery GWAS replicated in independent data from the Mayo Clinic. A. Discovery results from the San Francisco Bay Area Adult Glioma Study (AGS) and The Cancer Genome Atlas (TCGA) high grade glioma cases versus AGS and Illumina controls (iControls). B. Replication data from Mayo Clinic high grade glioma cases versus Mayo General Medicine controls. C. Mantel-Haenszel combined p-values.*
| SNP | rs1412829 | rs6010620 | rs4809324 |
| Chromosome | 9 | 20 | 20 |
| Position | 22033926 | 61780283 | 61788664 |
| Gene Symbol | RTEL1 | RTEL1 | |
| Minor Allele | C | A | C |
| A. Discovery set: 692 UCSF AGS and TCGA cases and 3992 AGS and iControls | |||
| Number genotyped | |||
| Cases | 692 | 692 | 692 |
| Controls | 3989 | 3991 | 3979 |
| Minor allele frequencies | |||
| Cases | 0.47 | 0.17 | 0.15 |
| Controls | 0.39 | 0.23 | 0.10 |
| Principal component* adjusted P-value cases versus controls | 3.40E-08 | 1.50E-07 | 1.50E-07 |
| Odds ratio and 95% confidence intervals for 0, 1, or 2 minor alleles | 1.39 (1.24–1.57) | 0.68 (0.58–0.79) | 1.54 (1.31–1.82) |
| B. Replication set: 176 Mayo Clinic glioblastoma and anaplastic astrocytoma cases and 174 Mayo Clinic general medicine controls | |||
| Number genotyped | |||
| Cases | 175 | 175 | 176 |
| Controls | 173 | 174 | 174 |
| Minor allele frequencies | |||
| Cases | 0.53 | 0.15 | 0.16 |
| Controls | 0.41 | 0.26 | 0.10 |
| Principal component* adjusted P-value cases versus controls | 0.0038 | 0.00035 | 0.03 |
| Odds ratio and 95% confidence intervals for 0, 1, or 2 minor alleles | 1.56 (1.16–2.12) | 0.48 (0.32–0.72) | 1.66 (1.06–2.61) |
| Combined results | |||
| Mantel-Haenszel combined P-values | 1.85E-10 | 3.40E-09 | 1.70E-09 |
| Odds ratio and 95% confidence intervals | 1.42 (1.27–1.58) | 0.66 (0.57–0.76) | 1.60 (1.37–1.87) |
Principal component analysis implemented with Eigenstrat software. Complete results for thirteen top hits with p<10−6 from UCSF GWAS and Mayo Clinic replication p-values are shown in Supplementary Table 2, with Mantel-Haenszel combined results presented in Supplementary Table 6.
In discovery data, only the interaction between chromosome 9p21 SNP rs1412829 and TERT SNP rs2736100 on chromosome 5 was statistically significant with Wald test p=0.019 (see Supplementary Table 5 and its accompanying graph). However, close inspection revealed that the interaction probably resulted from an association of the two SNPs in the controls.
P-values of SNPs on Chromosome 9 and the linkage disequilibrium plot (Figure 2) show that the top Chromosome 9 SNPs are located in or around CDKN2B. Haplotype analyses (Table 2A) showed that a single haplotype for the four 9p21 SNPs were more common in cases than controls. Two haplotypes in RTEL1 were associated with increased and decreased risk respectively (Table 2A). The Mayo replication data also defined the identical haplotype associated with high grade glioma risk for the four linked 9p21 SNPs as identified during the discovery phase (Table 2B). In addition, one of the two RTEL1 haplotypes identified in the discovery phase was also statistically significant in the replication (Table 2B). Mantel-Haenszel combined p-values for UCSF and Mayo for the thirteen SNPs are shown in Supplementary Table 6. The UCSF GWAS and Mayo replication suggest that regions of 9p21 and RTEL1 immediately warrant further exploration for SNPs associated with high grade glioma risk.
Figure 2.

Map of the associated 9p region in high grade glioma. A. Genes within region. B. Location of hemizygous deletion regions previously linked to familial melanoma/glioblastoma syndrome (blue) 5. SNPs within the region that have been previously reported to be associated with heart disease and diabetes risk 11. C. −log p for SNPs within region; note different scales for UCSF discovery phase (blue bars, left x-axis) and Mayo Clinic replication phase (red bars, right x-axis). P-values are from single point association tests of principal component adjusted additive logistic regression of cases versus controls for 0, 1, or 2 minor alleles. D. Linkage disequilibrium of HapMap SNPs in region.
Table 2.
Haplotype analysis of associations of high grade glioma risk with single nucleotide polymorphisms (SNPs) in 9p21 region and RTEL1.
| Cases % | iControls % | Odds ratio a | p-value a | |
|---|---|---|---|---|
| A. UCSF Adult Glioma Study (AGS) and the Cancer Genome Atlas high grade glioma cases (n=692) and AGS and Illumina controls (n=3992) | ||||
| Chromosome 9p21: rs1063192, rs2157719, rs1412829, rs4977756 | ||||
| T-A-T-A | 50.0 | 58.5 | Referent | |
| C-G-C-G | 43.2 | 35.1 | 1.42 (1.26–1.60) | 1.4 × 10⁻⁸ |
| Rare haplotypes b | 6.8 | 6.4 | 1.22 (0.96–1.56) | 0.110 |
| Global p-value: 7.4× 10⁻⁸a | ||||
| RTEL1: rs4809324, rs6010620, rs6089953 | ||||
| T-G-G | 68.0 | 66.9 | Referent | |
| T-A-A | 16.1 | 21.7 | 0.71 (0.61–0.83) | 1.8 × 10⁻⁵ |
| C-G-G | 15.0 | 10.3 | 1.40 (1.18–1.66) | 9.6 × 10⁻⁵ |
| Rare haplotypes b | 0.9 | 1.1 | 1.12 (0.57–2.19) | 0.750 |
| Global p-value: 3.6 × 10⁻⁹ a | ||||
| B. 176 Mayo Clinic glioblastoma and anaplastic astrocytoma cases and 174 Mayo Clinic general medicine controls. | ||||
| Chromosome 9p21: rs1063192, rs2157719, rs1412829, rs4977756 | ||||
| T-A-T-A | 44.6 | 56.6 | Referent | |
| C-G-C-G | 49.7 | 36.5 | 1.68 (1.23–2.29) | 0.001 |
| Rare haplotypes b | 5.7 | 6.9 | 0.96 (0.50–1.84) | 0.900 |
| Global p-value: 0.002a | ||||
| RTEL1: rs4809324, rs6010620, rs6089953 | ||||
| T-G-G | 68.1 | 63.2 | Referent | |
| T-A-A | 14.8 | 25.0 | 0.52 (0.35–0.79) | 0.002 |
| C-G-G | 16.5 | 10.3 | 1.42 (0.89–2.26) | 0.144 |
| Rare haplotypes b | 0.6 | 1.5 | 0.41 (0.08–2.22) | 0.303 |
| Global p-value: 0.002a | ||||
Principal component adjusted odds ratios, confidence intervals and p-values were estimated using Eigenstrat software; SNPs with individual p<10−6 were included in the haplotype analyses.
Rare haplotypes (<5%) were grouped together for these analyses.
CDKN2A/B
The strongest and most consistent associations in the present whole genome scan were with a series of four SNPs within non-coding regions of the CDKN2B locus on Chromosome 9p21. CDKN2B lies adjacent to the well known tumor suppressor genes CDKN2A (p16INK4A) and p14ARF in a region that is frequently mutated, deleted or hypermethylated in a wide variety of tumors including high grade glioma. The region is within 20kb of constitutional deletions, including the hemizygous germline deletion of CDKN2A(ARF), that has been reported by the Mayo group and others to be linked to familial melanoma/glioblastoma syndrome (see Figure 2)5. Mice with homozygous deletion of CDKN2A, CDKN2B, and/or ARF are predisposed to develop tumors, including gliomas 6. CDKN2B, like CDKN2A, is a cyclin-dependent kinase inhibitor, which forms a complex with CDK4 or CDK6, and prevents the activation of the Cyclin-D dependent kinases, thus regulating cell growth and the cell cycle G1 progression. CDKN2B is inactivated in glioma frequently by homozygous deletion along with CDKN2A; 50–70% of primary high grade gliomas display deletion of this region. Whereas the tumor suppressor functions for CDKN2A have been firmly established, only recently has CDKN2B been recognized as an effective “backup” for loss of CDKN2A 7. In glioblastoma cells, over-expression of CDKN2B in a CDKN2A deficient background inhibited cell growth, induced replicative senescence, and inhibited telomerase activity 8. In contrast to CDKN2A, CDKN2B is dramatically induced by TGF-β. It has thus been hypothesized that CDKN2B may be engaged under special circumstances whereas CDKN2A plays a more general tumor suppressor function in response to DNA damage and hyperproliferative signals 8. TGF-β signaling information is relayed from the cell surface to the nucleus via the phosphorylation of SMAD proteins. A recent study identified a SMAD-binding region in the CDKN2B promoter; it is of interest that the SNPs associated with glioma in the current study are in linkage with the rs2069418 G>C SNP that lies in the crucial conserved 3′ box adjacent to the SMAD binding element 9. If a SNP in this region reduces the response of CDKN2B to TGF-β it could allow cancer precursor cell populations to expand, thereby promoting gliomagenesis. It is, however, unknown whether any SNP in the region can affect TGF-β or any other cytokine signaling processes.
Although recent studies 10–13 have identified chromosome 9p21 as an important region for coronary artery diseases (CAD) and type 2 Diabetes (T2D), the four glioma associated chromosome 9p21 SNPs are not in linkage disequilibrium with SNPs associated with CAD/T2D (Supplementary Figure 1). This suggests separate regions on chromosome 9p21 may be contributing to the risk of high grade glioma and CAD/T2D, respectively.
TERT and RTEL1
Although replication results were not statistically significant, the human telomerase, TERT, is another interesting gene identified in our GWAS; it encodes human telomerase, which is a ribonucleoprotein polymerase that maintains telomere ends by addition of the telomere repeat TTAGGG. TERT activity is increased in glioblastoma 14,15 and contributes to glioma cell growth16. A recent GWAS linked the region containing TERT with idiopathic pulmonary fibrosis 17. Another GWAS study reported a significant association between lung cancer and TERT SNP rs2736100 18. On Chromosome 20, a related gene, RTEL1, contains two SNPs within intron 12 (rs6010620) and intron 17 (rs4809324) significantly associated with high grade glioma. RTEL1 is a DNA helicase critical for regulation of telomere length in mice and its loss is associated with shortened telomere length, chromosome breaks, and translocations 19.
This study is strengthened by the use of principal components 3 to adjust for any residual population stratification after using several quality control measures to assure that only unrelated white subjects were included in the analyses (see methods section and supplementary materials for details). Because glioma is a relatively rare disease, very large matched sets of glioma cases and controls are not currently available for GWAS. Consequently, we used a publicly available control group of whites from Illumina to provide large numbers of controls for the discovery phase. To minimize the possibility of false positives that might result from using a non-matched control set, we used carefully matched high grade glioma patients and controls from the Mayo Clinic for replication analyses. In summary, this report identifies and confirms that high grade glioma risk is associated with inherited variation in a region containing CDKN2B on Chromosome 9p21 and in two SNPs in RTEL1. That the 9p21 region is frequently deleted in high-grade glioma tumors lends further biologic plausibility to these findings.
METHODS
These studies were approved by the University of California San Francisco Committee on Human Research and Mayo Clinic Office for Human Research Protection. Informed consent was obtained from all study participants.
The Discovery Study - screening for top SNPs using data from the San Francisco Adult Glioma Study, the Cancer Genome Atlas, and Illumina
Study subjects (see Supplementary Table 1a)
Genotyping data comes from four groups of subjects, 622 high grade astrocytic glioma cases and 602 controls from AGS, 3390 controls from Illumina controls (iControls), and 70 glioblastoma cases from TCGA 4 (Supplementary Table 1a) that passed quality control measures described below, including checks for relatedness and European ancestry. Details of subject recruitment for AGS have been provided previously 20,21. Briefly, cases aged 20 or older, diagnosed with histologically confirmed incident gliomas (International Classification of Diseases for Oncology, morphology codes 9380–9481) were recruited from the local population based registry, the Northern California Rapid Case Ascertainment program and the University of California, San Francisco Neuro-oncology clinic between 1997 and 2006. Additional pathology reviews were conducted by specialty trained neuropathologists including Kenneth Aldape and Tarik Tihan. Glioblastoma, which is the diagnosis for the large majority (84%) of cases, is a diagnosis with good concordance between pathologists 22. Although survival bias is a concern for studies of glioblastoma, we obtained blood from subjects within a median of 80 days from diagnosis. Nevertheless, the results may not apply to those with the most rapidly fatal forms of this disease. AGS controls aged 20 years or older from the same residential area as cases were identified using random digit dialing and were frequency matched to cases on age, gender and ethnicity. Consenting participants provided blood and/or buccal specimens and information during an in-person or telephone interview. Because of the large scale genotyping platform used, only subjects who provided blood specimens were included in the present analysis. We initially only included individuals who self-identified as white in the genotyping, but then used methods described below to verify European ancestry.
We also assembled an independent control genotype dataset of 3390 non-redundant white controls from Illumina iControlDB (Illumina, Inc., San Diego, CA). The subjects are anonymous, with information only on their age, gender and ethnicity. The iControl data also included 262 HapMap samples [30 CEU parent-child trios (Utah residents with ancestry from northern and western Europe), 84 YRI (Yoruba in Ibadan, Nigeria) and 88 Chinese or Japanese] that we used to identify and remove subjects with evidence of non-European ancestry from our analysis. We checked for evidence of non-European ancestry (Supplementary Figure 2) and sample duplicates or related subjects (IBS > 1.6; Supplementary Figure 3) among AGS samples, TCGA, and iControls by performing Multi-dimensional scaling (MDS) analysis on 20 bootstrap samples of 1000 random autosomal bi-allelic SNPs. Following these quality assessment measures, we obtained a total of 3390 white controls from three different Illumina panels with up to 306,154 autosomal SNPs overlapping the HumanHap370duo panel used for the AGS subjects: Illumina HumanHap300 (n=336 subjects), HumanHap550v1 (n=1519), and HumanHap550v3 (n=1552).
We downloaded HumanHap550 platform genotyping data from blood specimen DNA and demographic data for 89 glioblastoma cases from the Cancer Genome Atlas (TCGA; http://cancergenome.nih.gov/)4. Although 72 were identified as whites, our analyses showed that one had non-European ancestry (Supplementary Figure 3) and another appeared to duplicate an AGS case, leaving 70 TCGA cases.
Sample preparation and genotyping for AGS cases and controls and quality control
DNA was isolated from whole blood using Gentra Puregene DNA isolation kit (Qiagen, Valencia, CA) and quantified using Picogreen reagent (Invitrogen, Carlsbad, CA). Genotyping was conducted by deCODE Genetics (www.decodeservices.com). Samples were randomized prior to plating on specimen plates provided by deCODE Genetics. The genotyping assay panel used was Illumina’s HumanCNV370-Duo BeadChip (www.illumina.com). For this paper, we only analyzed autosomal SNPs. A complete list of the SNPs on this panel is available either from Illumina or on the publicly available web-site, SNPLogic (www.snplogic.org) 23. In addition to randomization of samples and the quality control measures provided by deCODE Genetics, we included 2 duplicate samples per plate and one CEPH 24 trio (parents and child) per plate. DNA was re-extracted for any samples with call rates <98% and genotyped again and only samples reaching call rate ≥ 98% were included in these analyses. We genotyped a total of 1403 samples including AGS high grade glioma cases (n=623) and controls (n=602), duplicates (n=51), some subjects that were determined to be ineligible based on self-described ethnicity (n=22), AGS cases with non high grade glioma histologies (n=67) and CEPH samples we provided for quality control (n=36); one sample was deleted because of inadequate call rate and one because of a mismatch between stated and genotyped gender. In addition, one case subject was removed because of not clustering with those of European ancestry in the identity by state (IBS) analysis (Supplementary Figure 2). Thus, we use genotyping data from 622 AGS high grade glioma cases and 602 AGS controls (Supplementary Table 1a).
The assay panel contained a total of 370,404 probes of which 353,202 were associated with a reference sequence number and 17,202 with a copy number variant. There were a total of 342,554 SNPs provided in the genotyping files received from deCODE, with 331,697 autosomal SNPs. Of these, 250 had completely missing data, and 4941 were non-polymorphic; this left 326,506 biallelic SNPs for analysis.
Quality control information for AGS cases and controls is presented in Supplementary Figures 4–6 showing autosomal heterozygosity for all 1403 genotyped samples, percent of SNPs missing in cases vs. controls, and Hardy-Weinberg equilibrium p-values for AGS cases versus AGS controls. We used this information to exclude SNPs with poorer data quality from presented data. Similar quality measures were computed and used for filtering iControl and TCGA data (results not shown). After excluding SNPs with p<10−5 for Hardy-Weinberg equilibrium in either AGS controls or iControls and those with >5% missing genotyping data in any of the four subject groups, AGS cases or controls, iControls or TCGA cases, there were 275,895 SNPs to consider in case-control association tests.
In addition to ancestry checks described above, we ran Eigenstrat 3 to adjust for other possible population or batch differences between the combined high grade glioma cases and control groups. The quantile-quantile (Q-Q) plot (Supplementary Figure 7) for the Eigenstrat adjusted p-values comparing AGS and TCGA cases versus AGS and Illumina controls showed good correspondence between observed and expected test p-values for equality of allele frequencies for the vast majority of the SNPs except for the ones with very low p-values. The genomic control parameter, 1.058, was very similar to that found by Hung et al. 25 of 1.03. They interpreted this to indicate there was no systematic increase in false-positive findings owing to population stratification or any other form of bias. We also present the Q-Q plot comparing principal component adjusted p-values for AGS versus Illumina controls (Supplementary Figure 8). The genomic control parameter for this comparison is 1.07.
Statistical methods
We used 3 software packages to conduct all analyses, R (http://cran.r-project.org/), Disease Miner (deCODE genetics, Reykjavik, Iceland), and Eigenstrat 3. We also used Microsoft Excel and SAS (Cary, North Carolina, USA) for additional data manipulations and visualization. As noted above, quality control analyses included computation of sample heterozygosity, percent missing data (no genotype call) and Hardy Weinberg equilibrium. The primary analyses used in this paper were Eigenstrat adjusted single point association results from the additive logistic regression model for 0, 1 or 2 copies of the minor allele (equivalent to a Cochran-Armitage test for trend). We employed a two-stage statistical approach to identify SNPs independently associated with high grade glioma and potential SNP-SNP interaction effects. In the first stage, a backward selection procedure was used to obtain the best logistic regression model, using the 13 SNPs that produced a p-value < 10−6 in the single locus models. Eight SNPs remained in the model after the backward selection procedure, suggesting a significant and independent association with high grade glioma risk, among which one 9p21 (out of four) and two RTEL1 (out of three) SNPs were retained (Supplementary Table 3). Having confirmed significant main effects for these 8 SNPs, in the second stage, we investigated whether there are SNP-SNP pairwise interactions among them. This was performed again in a backward selection logistic regression framework using the 8 SNPs and all pairwise interactions among them as covariates. Only the interaction between the 9p21 SNP rs1412829 and TERT SNP rs2736100 was statistically significant with p<0.05 (Wald test) after backward selection. In Supplementary Table 5, we calculated ORs of the nine genotype groups of rs1412829 [TT,CT,CC] and rs2736100 [GG,GT,TT] using [rs1412829=TT, rs2736100=GG] as a referent group. Since the resulting p-values are subject to multiple testing errors, we also provide Bonferroni-adjusted p-values. For the top hits, we also conducted sensitivity analyses using logistic additive regression models adjusting for age and gender (results not shown).
Haplotype analyses for the Chromosome 9 and RTEL1 SNPs were performed using the haplo.stats R package (http://cran.r-project.org/). Rare haplotypes (<5%) were combined into one group for analysis. Global p-value was calculated to assess if any one of the haplotypes was over- or under-represented among cases compared to controls. Haplotype trend regression was performed to calculate OR associated with each copy of a specific haplotype using the most frequent haplotype as the referent group (Table 2). Linkage disequilibrium (R2)among the 4 significant 9p21 SNPs and 3 significant RTEL1 SNPs were calculated using PROC ALLELE procedure in SAS Genetics (Cary, North Carolina). A linkage disequilibrium plot (Supplementary Figure 1) showing the linkage pattern in R2 between our four 9p21 glioma associated SNPs and seven CAD or T2D SNPs 10–13 was constructed using Haploview 26 with HAPMAP data of the European ancestry (CEU). As shown, none of the four glioma-associated SNPs (rs1063192, rs2157719, rs1412829, rs4977756 at positions 21993367 to 22058652) shows any marked linkage with seven CAD or T2D associated SNPS (rs2891168, rs1333042, rs2383206, rs10757278, rs1333048, rs1333049, rs2383208 at positions 22088618 to 22122075), with maximum R2=0.47 between rs4977756 and rs2891168. For rs1412829, the 9p21 SNP independently associated with glioma risk in multivariate analysis, the maximum correlation with the CAD or T2D associated SNP (rs2891168) was R2=0.23.
For completeness for other glioma genetics researchers, we also present SNP-disease association data for any SNP with p<0.001 for tests of associations with high grade glioma (Supplementary Table 7). We also conducted all analyses on glioblastoma only cases; no major differences for statistically significant SNPs were found (results not shown).
To obtain combined estimates of high grade glioma risk for top SNPs from UCSF and Mayo, we used the Mantel-Haenszel method to estimate the odds ratio, 95% confidence interval, and p-value; the test is for equality of allele frequencies between cases and controls.
The Replication Study using data from the Mayo Clinic
Study subjects (see Supplementary Table 1b)
The Mayo Clinic case group included 176 glioblastoma and anaplastic astrocytomas patients newly diagnosed between 2005 and 2008. Cases were identified within 24 hours of diagnosis, except for those who had their initial diagnosis elsewhere, followed by verification at the Mayo Clinic. The patients consisted of 67 (38%) women and 109 (62%) men who were 53.8±12.6 years old; 174 (98%) were white; 114 (65%) patients had glioblastoma; 62 (35%) patients had anaplastic astrocytomas. Pathologic diagnosis was confirmed by review of the primary surgical material for all patients by two Mayo Clinic neuropathologists (CG and BWS – see acknowledgements) based on surgically resected material. The control group consisted of consented patients who had a general medical exam at the Mayo Clinic. Matching variables were sex, date of birth (within two and one half years), race (Hispanic white, non-Hispanic white, American Indian, African American, Asian, Pacific Islander, Other), and residence. Geographic region of residence was matched in three zones based on the distance to the Mayo Clinic Rochester: Olmsted County; the rest of Minnesota, Wisconsin, Iowa, North Dakota, and South Dakota; and the rest of US and Canada. Excluded were individuals under the age of 18 and those with a history of brain tumor. The Mayo Clinic case and control enrollment research protocol was approved by Mayo Institutional Review Board. These cases and controls were genotyped using Illumina 610Quad arrays.
Sample preparation and genotyping for Mayo Clinic cases and controls and quality control
DNA was isolated from snap frozen, buffy coat samples using an AutoGenFlex STAR system (AutoGen, Holliston, MA) with Qiagen’s FlexiGene DNA AGF3000 kit (Valencia, CA) and AutoGen’s blood DNA finishing kit. DNA was quantified using a ND-1000 spectrophotometer (Thermo Scientific, Wilmington, DE) and normalized to 50 ng/ul using 10 mM Tris HCl, 0.1 mM EDTA, pH 8.0 buffer (Teknova, Hollister, CA). Genotyping was performed using Illumina 610Quad SNP arrays (Illumina, San Diego, CA) according to the manufacturer’s recommendations. Briefly, 200 ng of genomic DNA was amplified then fragmented. The fragmented DNA was hybridized on Illumina’s Human 610-Quad BeadChip. Fluorescent labeling was performed by single base extension using labeled nucleotides. The BeadChip was then scanned with Illumina’s Bead Array Reader. Samples, including positive controls, were processed in a 96 well format.
Allele calling was performed using Illumina’s Genotyping Module version 3.3.7 in BeadStudio version 3.1.3.0. Concordance in inter-plate, intra-plate, and overall subject replicates were summarized to investigate potential genotyping error. Subject level call rates were calculated and those subjects with call rates <0.9 were excluded from further analysis. Individual SNP call rates were summarized and SNPs with call rates <0.9 were excluded from the analysis. The minor allele frequency (MAF) was calculated for each SNP and SNPs with MAF <0.01 were excluded from further analysis. The above analyses were done on the complete set of data and each analysis was repeated separately for each plate to investigate any potential plate effects. The overall Illumina subject call rate across all SNPs for Mayo Clinic cases and controls was 97.5±0.02 (median 98.3; range 90.0–98.4). Inter- and intra-plate replicate analysis was performed for the thirteen SNPs summarized in Table 1. For all thirteen SNPs, all inter- and intra-plate replicates were identical.
Statistical methods
The frequency distribution at each SNP locus was tested against the Hardy-Weinberg equilibrium (HWE) under the allele Mendelian biallelic expectation using the chi-square test. SNPs with HWE p-values <0.001 for control subjects were excluded from the analysis. The principal component approach was implemented in EIGENSTRAT to determine if there was any evidence of population stratification in the Mayo cases and controls 3,27. An additive logistic regression model for 0, 1, or 2 copies of the minor allele for candidate SNPs was used to investigate the association of glioma risk. Significant principal components from the population stratification analysis were included as covariates in the logistic regression models. Haplotype blocks were estimated using Haploview 26. The multiple SNP marker-disease association by estimated haplotype was evaluated using haplo.score (a Mayo Clinic-developed software), which accounts for ambiguous linkage phase 28.
Supplementary Material
Acknowledgments
Funding: Work at University of California, San Francisco has been supported by NIH grants R01CA52689 and UCSF Brain Tumor SPORE, P50CA097257, as well as by grants from the National Brain Tumor Foundation, the UCSF Lewis Chair in Brain Tumor Research and by donations from families and friends of John Berardi, Helen Glaser and Elvera Olsen. JSC was also supported by a fellowship from the National Cancer Institute (grant R25 CA 112355). Work at the Mayo Clinic has been supported by the Mayo Clinic Brain Tumor SPORE (NIH P50 CA108961), the Mayo Clinic Comprehensive Cancer Center (P30 CA15083) and the Bernie and Edith Waterman Foundation.
The San Francisco Adult Glioma Study thanks the Northern California Cancer Center for glioma patient case finding; we also thank Kenneth Aldape for pathology review and the pathology departments of Alexian, Alta Bates, Brookside, California Pacific, Doctors Pinole, Eden, El Camino, Good Samaritan, Highland, John Muir, Kaiser Redwood City, Kaiser San Francisco, Kaiser Santa Teresa, Los Gatos, Los Medanos, Marin General, Merrithew, Mills Peninsula, Mt. Diablo Hospital, Mt. Zion, Naval Hospital, O’Connor, Ralph K Davies, Saint Louise, San Francisco General, San Jose, San Leandro, San Mateo County, San Ramon Valley, Santa Clara Valley, Sequoia, Seton, St. Francis, St. Luke’s, St. Rose, Stanford, Summit, UC San Francisco, Valley Livermore, Veterans Palo Alto, Veterans SF, and Washington Hospitals and Medical Centers for providing tumor specimens for review. Genotyping services for San Francisco study subjects were provided by deCODE genetics, Iceland (www.decodeservices.com). The company provided SNP and normalized CNV data and technical support in data analysis including conference call tutorials in the use of the Disease Miner Software. We thank Drs. Bernd Scheithauer and Caterina Gianinni for their careful histologic review of all the primary high grade gliomas collected at the Mayo Clinic for this study. The Mayo Clinic Comprehensive Cancer Center Biospecimens and Processing (TACMA), Gene Analysis, Biostatistics and Bioinformatics Shared Resources were essential for the success of this study. Thanks to Karl Kelsey, Professor of Community Health and Pathology and Laboratory Medicine, Brown University, for helpful suggestions on genotyping and interpretation of results. Thanks to Neil Risch, Director of the UCSF Institute of Human Genetics, for very helpful suggestions on this paper. Thanks to Saunak Sen, Associate Professor of Biostatistics, UCSF, for helpful discussions and suggestions on statistical methods. Some computations were performed using the UCSF Biostatistics High Performance Computing System.
Footnotes
Author Contributions:
M.W. was the overall UCSF study PI who was responsible for subject recruitment, oversaw all analyses, wrote parts of and synthesized the paper. R.B.J. was the overall co-PI of the Mayo study who oversaw the entire study (particularly laboratory quality control), interpreted the results, and wrote parts of the paper. J.S.C. was the UCSF epidemiologist who contributed to development of the analysis plan, conducted statistical analyses, and wrote parts of the paper. R.Y. was the UCSF biostatistician who oversaw and conducted statistical analyses of the discovery phase, and wrote parts of the paper. Y.X. was the UCSF biostatistician who conducted statistical analyses of the discovery and combined phases, and wrote parts of the paper. K.V.B. was the Mayo lead statistician who participated in study design and the analysis plan. M.B. was the PI of the UCSF Brain Tumor SPORE and a clinical collaborator who provided access for subject recruitment. J. C. B. was the Mayo neuro-oncologist who led patient recruitment. S.C. was the co-director of the UCSF Neuro-oncology Clinic who assisted in subject recruitment. P.A.D. was the Mayo Statistician who performed all Mayo data analysis. C.G. was the Mayo Pathologist who verified all pathologic diagnosis of Mayo cases. C.H. was the Mayo laboratory technologist responsible for specimen preparation for genotyping. T.M.K was the Mayo laboratory manager responsible for specimen storage and retrieval. M.L.K provided statistical support for all Mayo analyses. D.H.L was the Mayo neuro-oncologist who facilitated patients’ enrollment and medical record data collection. L.M. was the UCSF project coordinator responsible for subject recruitment, preparation of data sets for analyses, and conducted analyses. B.O. was the PI of Mayo brain tumor SPORE and neurologist who facilitated patients’ enrollment and medical record data collection. J.P. was the UCSF laboratory manager responsible for specimen storage, retrieval and preparation for genotyping. A.R.P. was the UCSF/Gladstone bioinformatician who participated in selecting the genotyping platform, developing the analytic plan, and reviewing the paper. M.P. was the Co-director of the UCSF Neuro-oncology Clinic who assisted in subject recruitment. C.Q. participated in subject recruitment and pathology specimen accrual from Kaiser Permanente Northern California. T.R. was the UCSF project coordinator responsible for subject recruitment, prepared data sets for analyses, conducted analyses, and wrote parts of paper. A.R. was the Mayo project coordinator responsible for subject recruitment. I.S. was the UCSF bioinformatician who participated in developing the analytic plan, data analysis and interpreting results. T.T. was the UCSF neuropathologist who participated in subject identification, accrual and development of analytic the strategy. J.W. was the UCSF epidemiologist participated in choice of genotyping platform, development of analytic strategy, oversaw of sample preparation. P.Y. was the overall co-PI of Mayo study who oversaw the entire study (particularly study design for subject recruitment, control enrollment, data quality control and analyses), interpreted results, and wrote parts of the paper. J.K.W. was the UCSF study co-PI who oversaw all aspects of laboratory work, participated in study design, subject accrual, development of the analysis plan, and wrote the discussion portion of the paper.
References
- 1.CBTRUS. Primary Brain Tumors in the United States, Statistical Report 2000–2004. Central Brain Tumor Registry of the United States; 3333 West 47th St. Chicago, IL 60632: 2008. [Google Scholar]
- 2.Schwartzbaum JA, Fisher JL, Aldape KD, Wrensch M. Epidemiology and molecular pathology of glioma. Nat Clin Pract Neurol. 2006;2:494–503. doi: 10.1038/ncpneuro0289. quiz 1 p following 516. [DOI] [PubMed] [Google Scholar]
- 3.Price AL, et al. Principal components analysis corrects for stratification in genome-wide association studies. Nat Genet. 2006;38:904–9. doi: 10.1038/ng1847. [DOI] [PubMed] [Google Scholar]
- 4.Comprehensive genomic characterization defines human glioblastoma genes and core pathways. Nature. 2008;455:1061–8. doi: 10.1038/nature07385. [DOI] [PMC free article] [PubMed] [Google Scholar]
- 5.Bahuau M, et al. Germ-line deletion involving the INK4 locus in familial proneness to melanoma and nervous system tumors. Cancer Res. 1998;58:2298–303. [PubMed] [Google Scholar]
- 6.Sharpless NE, et al. Loss of p16Ink4a with retention of p19Arf predisposes mice to tumorigenesis. Nature. 2001;413:86–91. doi: 10.1038/35092592. [DOI] [PubMed] [Google Scholar]
- 7.Krimpenfort P, et al. p15Ink4b is a critical tumour suppressor in the absence of p16Ink4a. Nature. 2007;448:943–6. doi: 10.1038/nature06084. [DOI] [PubMed] [Google Scholar]
- 8.Fuxe J, et al. Adenovirus-mediated overexpression of p15INK4B inhibits human glioma cell growth, induces replicative senescence, and inhibits telomerase activity similarly to p16INK4A. Cell Growth Differ. 2000;11:373–84. [PubMed] [Google Scholar]
- 9.Seoane J, et al. TGFbeta influences Myc, Miz-1 and Smad to control the CDK inhibitor p15INK4b. Nat Cell Biol. 2001;3:400–8. doi: 10.1038/35070086. [DOI] [PubMed] [Google Scholar]
- 10.Lemmens R, et al. Variant on 9p21 strongly associates with coronary heart disease, but lacks association with common stroke. Eur J Hum Genet. 2009 doi: 10.1038/ejhg.2009.42. [DOI] [PMC free article] [PubMed] [Google Scholar]
- 11.Mohlke KL, Boehnke M, Abecasis GR. Metabolic and cardiovascular traits: an abundance of recently identified common genetic variants. Hum Mol Genet. 2008;17:R102–8. doi: 10.1093/hmg/ddn275. [DOI] [PMC free article] [PubMed] [Google Scholar]
- 12.Schaefer AS, et al. Identification of a shared genetic susceptibility locus for coronary heart disease and periodontitis. PLoS Genet. 2009;5:e1000378. doi: 10.1371/journal.pgen.1000378. [DOI] [PMC free article] [PubMed] [Google Scholar]
- 13.Schunkert H, et al. Repeated replication and a prospective meta-analysis of the association between chromosome 9p21.3 and coronary artery disease. Circulation. 2008;117:1675–84. doi: 10.1161/CIRCULATIONAHA.107.730614. [DOI] [PMC free article] [PubMed] [Google Scholar]
- 14.Shervington A, et al. Glioma: what is the role of c-Myc, hsp90 and telomerase? Mol Cell Biochem. 2006;283:1–9. doi: 10.1007/s11010-006-2495-z. [DOI] [PubMed] [Google Scholar]
- 15.Maes L, et al. Relation between telomerase activity, hTERT and telomere length for intracranial tumours. Oncol Rep. 2007;18:1571–6. doi: 10.3892/or.18.6.1571. [DOI] [PubMed] [Google Scholar]
- 16.Falchetti ML, et al. Telomerase inhibition impairs tumor growth in glioblastoma xenografts. Neurol Res. 2006;28:532–7. doi: 10.1179/016164106X116818. [DOI] [PubMed] [Google Scholar]
- 17.Mushiroda T, et al. A genome-wide association study identifies an association of a common variant in TERT with susceptibility to idiopathic pulmonary fibrosis. J Med Genet. 2008;45:654–6. doi: 10.1136/jmg.2008.057356. [DOI] [PubMed] [Google Scholar]
- 18.McKay JD, et al. Lung cancer susceptibility locus at 5p15.33. Nat Genet. 2008 doi: 10.1038/ng.254. [DOI] [PMC free article] [PubMed] [Google Scholar]
- 19.Ding H, et al. Regulation of murine telomere length by Rtel: an essential gene encoding a helicase-like protein. Cell. 2004;117:873–86. doi: 10.1016/j.cell.2004.05.026. [DOI] [PubMed] [Google Scholar]
- 20.Felini MJ, et al. Reproductive factors and hormone use and risk of adult gliomas. Cancer Causes Control. 2008 doi: 10.1007/s10552-008-9220-z. [DOI] [PMC free article] [PubMed] [Google Scholar]
- 21.Wrensch M, et al. Nonsynonymous coding single-nucleotide polymorphisms spanning the genome in relation to glioblastoma survival and age at diagnosis. Clin Cancer Res. 2007;13:197–205. doi: 10.1158/1078-0432.CCR-06-1199. [DOI] [PubMed] [Google Scholar]
- 22.Davis FG, et al. Issues of diagnostic review in brain tumor studies: from the Brain Tumor Epidemiology Consortium. Cancer Epidemiol Biomarkers Prev. 2008;17:484–9. doi: 10.1158/1055-9965.EPI-07-0725. [DOI] [PubMed] [Google Scholar]
- 23.Pico AR, et al. SNPLogic: an interactive single nucleotide polymorphism selection, annotation, and prioritization system. Nucleic Acids Res. 2008 doi: 10.1093/nar/gkn756. [DOI] [PMC free article] [PubMed] [Google Scholar]
- 24.Dausset J, et al. Centre d’etude du polymorphisme humain (CEPH): collaborative genetic mapping of the human genome. Genomics. 1990;6:575–7. doi: 10.1016/0888-7543(90)90491-c. [DOI] [PubMed] [Google Scholar]
- 25.Hung RJ, et al. A susceptibility locus for lung cancer maps to nicotinic acetylcholine receptor subunit genes on 15q25. Nature. 2008;452:633–7. doi: 10.1038/nature06885. [DOI] [PubMed] [Google Scholar]
- 26.Barrett JC, Fry B, Maller J, Daly MJ. Haploview: analysis and visualization of LD and haplotype maps. Bioinformatics. 2005;21:263–5. doi: 10.1093/bioinformatics/bth457. [DOI] [PubMed] [Google Scholar]
- 27.Patterson N, Price AL, Reich D. Population structure and eigenanalysis. PLoS Genet. 2006;2:e190. doi: 10.1371/journal.pgen.0020190. [DOI] [PMC free article] [PubMed] [Google Scholar]
- 28.Schaid DJ, Rowland CM, Tines DE, Jacobson RM, Poland GA. Score tests for association between traits and haplotypes when linkage phase is ambiguous. Am J Hum Genet. 2002;70:425–34. doi: 10.1086/338688. [DOI] [PMC free article] [PubMed] [Google Scholar]
Associated Data
This section collects any data citations, data availability statements, or supplementary materials included in this article.