

Abstract
Background
Left atrial enlargement is associated with cardiovascular disease. Genetic factors contributing to the left atrium (LA) dimension are poorly understood. We sought to map susceptibility genes for LA size in a large Dominican family dataset and an independent population-based cohort from the Northern Manhattan Study (NOMAS).
Methods and Results
100 Dominican families consisting of 1350 individuals were used to estimate heritability and map quantitative trait loci for LA size using variance components analysis. LA dimension was measured by transthoracic echocardiography. A polygenic covariate screening was used to identify significant covariates. LA size had a moderate estimate of heritability (h2=0.42), after adjusting for significant covariates. Linkage analysis of 405 microsatellite markers revealed suggestive evidence on chromosome 10p19 (D10S1423, MLOD=2.00) and 17p10 (D17S974, MLOD=2.05). Ordered subset analysis found significantly enhanced (p<0.05 for increase of LOD score) evidence for linkage at 17p10 (MLOD=2.9) in families with lower LDL level. 2233 single nucleotide polymophisms (SNPs) were used to perform a peak-wide association mapping across 17p10 in 825 NOMAS individuals. Strong evidence for association were found in NTN1, MYH10, COX10, and MYOCD genes (p=0.00005 to 0.005).
Conclusions
Using non-biased genome-wide linkage followed by peak-wide association analysis, we identified several possible susceptibility genes affecting LA size. Among them, MYOCD has been shown to serve as a key transducer of hypertrophic signals in cardiomyocytes in vitro. Evidence from our linkage and association study, together with the known function, strongly suggests that polymorphisms in MYOCD gene modify LA size.
Keywords: Left atrium, Genetics, Myocardin, MYH10, COX10
The size of the left atrium (LA) has important prognostic implications. LA enlargement has been linked to increased mortality in subsets of high-risk patients with left ventricular dysfunction, 1 or atrial arrhythmias2 but also in the general population.3, 4 An enlarged LA is also associated with development of atrial fibrillation, 5, 6 a condition that by itself increases the risk of ischemic stroke and death. 3, 4, 7. The association between increased risk of ischemic stroke and enlarged LA has been well documented, 8–10 even in subjects without atrial fibrillation. We have previously shown an increased stroke risk in subjects with increased LA size, whether measured directly by echocardiography 10 or inferred by electrical abnormalities detected on EKG.11
Multiple acquired conditions have been associated with LA enlargement.12 Among them are mitral valve disease, arterial hypertension and any condition that increases the left ventricular filling pressures. 12 Understanding the genetic influence on LA size would help in identifying subjects at increased risk for developing an enlarged LA especially at an early stage and in the absence of the hemodynamic predisposing conditions. In addition, this knowledge is essential for understanding cardiac structure and function at the molecular level and identifying therapeutic targets in the management of LA enlargement.
Little is known about the genetic basis of LA size with sparse studies mainly among Caucasian populations.13–17 Herein, we estimated the heritability and mapped quantitative trait loci (QTLs) for LA size in Caribbean Hispanic families from the Family Study of Stroke Risk and Carotid Atherosclerosis. To identify the genes underlying the QTLs, we performed a peak-wide association study in an independent prospective community-based cohort from the Northern Manhattan Study (NOMAS).
Methods
Subjects and Data collection
Probands in the family study were drawn from the Caribbean Hispanic participants in NOMAS. Previously, we have reported the detailed ascertainment scheme on NOMAS and the family study 18. Briefly, eligible NOMAS participants had never been diagnosed with a stroke, were at leaset 40 years of age, and resided for at least 3 months in a household with a telephone in Northern Manhattan. A total of 3298 subjects were enrolled between 1993 and 2001. In order to maximize the genetic component in the families, we assembled a high-risk Caribbean Hispanic family dataset using the following criteria to define a qualifying proband: (1) reporting a sibling with a history of myocardial infarction or stroke; or (2) having 2 of 3 quantitative risk phenotypes (maximal carotid plaque thickness, left ventricular mass, or homocysteine level above the 75th percentiles in the NOMAS cohort). Eighty percent of the families were recruited based on the first criteria. All subjects provided informed consent to participate in the study and the study was approved by the Institutional Review Boards of Columbia University, University of Miami, and the National Bioethics Committee and the Independent Ethics Committee of Instituto Oncologico Regional del Cibao in the Dominican Republic (DR).
Echocardiographic Evaluation
Transthoracic echocardiography was performed according to the guidelines of the American Society of Echocardiography 19. LA size was measured in parasternal long-axis view at end-systole. To minimize variability, measurements were made in triplicate and averaged. Echocardiographic studies were interpreted by researchers blinded to the clinical characteristics. Interobserver variability ranged between 8% and 10%.
Genotyping and Quality Control
DNA from the family study was sent to the Center for Inherited Disease Research (CIDR) for genotyping a set of 405 microsatellite markers at an average interval of 10 centimorgan (cM) across genome. Autosomal microsatellite genotypes were used to verify and adjust family structure using the programs PREST. 20 Briefly, Maximized Log-Likelihood Ratio (MLLR) test statistics were computed to compare the putative relationship between pairs of individuals to those constructed based on the autosomal genotypes. Relationships with a p-value <0.000001 in a consistent manner across the family were considered an error. Estimated kinship coefficients and identity by descent (IBD) estimates were used to rearrange family structure as needed. Mendelian error checking was performed on the final family structure using Pedcheck.21
DNA from the NOMAS cohort was genotyped using the Genome-Wide Human SNP Array 6.0 chip (AffyMetrix) at the Genotyping Core of the John P Hussman Institute for Human Genomics (HIHG) at the University of Miami. DNA samples were processed according to Affymetrix procedures. The arrays were scanned on the GeneChip Scanner 3000 7G. Image data were analyzed using the Genotyping Console™. Vigorous quality control was applied to both samples and SNPs. Samples were removed from further analysis if they had call rates below 95%, relatedness, gender discrepancies, or were outliers beyond 6 SD from the mean based on Eigenstrat analysis. SNPs with severe deviation from Hardy-Weinberg equilibrium (p < 1E-06) or a genotyping call rate less than 95% were also removed using PLINK 1.0522.
Statistics
A polygenic covariate screening as implemented in Sequential Oligogenic Linkage Analysis Routines (SOLAR) was run to screen age, sex, smoking, diabetes, dyslipidemia, hypertension, and body mass index (BMI) to determine significant covariates. An interaction between age and sex was automatically included by SOLAR. A permissive threshold of p<0.1 was used to allow for inclusion of any potentially significant covariates. Hypertension was defined as reported history of high blood pressure, systolic blood pressure ≥140 mmHg, diastolic blood pressure ≥90 mmHg, or use of antihypertensive medication. Smoking was defined as never versus ever. Dyslipidemia was defined as a history of hyperlipidemia or total cholesterol greater than 240 mg/dL. Diabetes was defined as a history of diabetes or fasting blood sugar greater than 126 mg/dL. Coronary artery disease (CAD) was defined as having a history of bypass surgery, angioplasty, or myocardial infarction.
Variance components methodology as implemented in SOLAR was used to estimate heritability and calculate two-point and multipoint LOD scores 23–25. A mixed-effects model that incorporates fixed covariate effects, additive genetic effects, and residual error was used. Heritability is calculated as the proportion of phenotypic variance explained by additive genetic effects while accounting for covariates. Heritability of LA diameter was assessed by itself or after correction for the indices of body size most commonly used in the literature: body surface area (BSA), and height. For QTL mapping, marker-specific IBDs were computed using the David and Weeks Monte Carlo algorithm. Then, marker-specific IBDs were merged together into one single file to calculate multipoint IBDs using a 1cM grid. Empirical p-values for LOD scores were calculated based on 10,000 replicates in which a fully-informative marker, unlinked to LA diameter, was simulated and used to compute possible LOD scores. Since SOLAR requires that quantitative traits be normally distributed and properly scaled, LA measurements were natural-log transformed, multiplied by 10.
Ordered subset analysis (OSA) was used to identify a more homogeneous subset of families for linkage analysis. 26 First, families were ranked by trait-related quantitative covariates. Then, the family-specific LOD scores were added in order of the increasing or decreasing covariate values of families until the maximum evidence for linkage was achieved. 10,000 random family orderings were permuted to generate empirical p-values for the significance of increase in the LOD score from the overall dataset to the OSA identified subset.
The NOMAS cohort included samples from a broader population and population stratification was assessed using Eigenstrat 27. Linear regression analysis was done in PLINK using an additive genetic model and adjusting for the significant covariates identified by a stepwise selection procedure in SAS. As in the family study, the same set of covariates were screened and any covariate with p<0.10 was kept in the model. Additionally, the top three principal components (PCA1, PCA2, and PCA3) as identified by Eigenstrat as well as the number of years between baseline (when risk factor information was collected) and when the echocardiographic measurement was taken were included in the covariate screening. LA measurements were natural log transformed to ensure normality. No additional outliers were eliminated (kurtosis = 0.15).
To correct for multiple testing of SNPs in the peak-wide association mapping, we applied SimpleM 28. In large scale genetics studies many SNPs were tested simultaneously but they are often not independent to each other due to linkage disequilibrium (LD). This correlation violates the independence assumption used in the Bonferroni correction. SimpleM infer independent tests such that a standard Bonferroni correction can be applied. First, a correlation matrix for the SNPs was constructed using the composite linkage disequilibrium. Then, eigenvalues were computed based on pairwise SNP correlation. Finally, PCA was used to estimate the effective number of SNPs used in the study.
Results
In total, we enrolled 100 Dominican families with 2182 individuals in the family study. The mean family size was 22±11 members with a range of 4–87. LA measurement and genotype were available for 1372 subjects. Due to the significant contribution of mitral regurgitation and low left ventricular ejection fraction to LA size, individuals (N=13) with severe mitral regurgitation or ejection fraction less than 30% were excluded. Six individuals with outlier LA measurements (beyond 3 SD from the mean) were further removed: five of them had moderate mitral valve disease, left ventricular hypertrophy, and/or low ejection fraction but did not meet the criteria for removal. They all have high systolic blood pressure (>145mmHg) and were not on medication except one. One patient was excluded because of small LA size for unknown reason. With our final dataset, we had over 80% power to detect QTLs for traits with heritability estimates greater than 0.18 at a LOD score threshold of 2.0.
Within the NOMAS cohort, 1137 individuals were genotyped. Among them, 825 individuals passed genotyping quality control, did not have severe mitral regurgitation, low left ventricular ejection, were independent of the family study, and had phenotype and covariate measurements available. Table 1 summarizes the sociodemographic, vascular risk factors, and LA size measurements in the family dataset and the NOMAS cohort used in the final analysis.
Table 1.
Sociodemographics, vascular risk factors, and left atrial size measurements in the family study and NOMAS cohort
| Family Study (N = 1350) | Cohort Study (N = 825) | |||
|---|---|---|---|---|
| N | % | n | % | |
| Hypertension | 530 | 39.3 | 563 | 68.2 |
| Diabetes | 184 | 13.6 | 165 | 20.0 |
| Dyslipidemia | 443 | 32.8 | 384 | 46.6 |
| Coronary Artery Disease | 239 | 17.7 | 112 | 13.6 |
| Ever Smoking | 465 | 34.4 | 432 | 52.4 |
| ≥High School Education | 666 | 49.3 | 382 | 46.4 |
| Race | ||||
| White | 0 | 0 | 121 | 14.7 |
| Black | 0 | 0 | 142 | 17.2 |
| Hispanic | 1350 | 100.0 | 547 | 66.3 |
| Other | 0 | 0 | 15 | 1.8 |
| Gender | ||||
| Male | 519 | 38.1 | 341 | 41.3 |
| Female | 831 | 61.0 | 484 | 58.7 |
|
| ||||
| Mean ± SD | Mean ± SD | |||
| Age (year) | 46.0 ± 17.2 | 64.3 ± 8.5 | ||
| Body Mass Index (kg/m2) | 28.7 ± 5.8 | 28.1 ± 4.7 | ||
| Waist Circumference (inch) | 36.5 ± 5.6 | 36.8 ± 4.9 | ||
| Total Cholesterol (mg/dl) | 185.3 ± 41.6 | 200.2 ± 38.2 | ||
| LDL (mg/dl) | 110.5 ± 35.0 | 126.5 ± 34.9 | ||
| HDL (mg/dl) | 50.0 ± 13.5 | 47.6 ± 15.0 | ||
| Triglyceride (mg/dl) | 125.4 ± 90.4 | 133.1 ± 85.6 | ||
| Systolic Blood Pressure (mmHg) | 121.6 ± 19.7 | 138.9 ± 19.2 | ||
| Diastolic Blood Pressure (mmHg) | 77.0 ± 10.6 | 82.5 ± 10.4 | ||
| LA diameter (mm) | 34.4 ± 4.2 | 38.3 ± 4.6 | ||
| Years BW LA size measure and baseline | 0 | 6.3 ± 4.0 | ||
Hypertension was defined as reported history of high blood pressure, systolic blood pressure greater than 140 mmHg, diastolic blood pressure or 90 mmHg, or use of antihypertensive medication. Dyslipidemia was defined as a history of hyperlipidemia or total cholesterol greater than 240 mg/dL. Diabetes was defined as a history of diabetes or fasting blood sugar greater than 126 mg/dL. Coronary artery disease was defined as having a history of bypass surgery, angioplasty, or myocardial infarction.
For the discrete traits, significant differences between men and women were tested using a Chi-Square statistic. For the continuous traits, significant differences between men and women were tested using the Wilcoxon Rank Sum test.
Table 2 summarizes the estimates of heritability for LA diameter and LA diameter corrected for BSA (LA/BSA) and height (LA/HT). Age, dyslipidemia and BMI were significant covariates for all three LA size measurements (p<0.1). Covariates explained 32% of the LA diameter variance (sex and smoking as additional significant covariates), 21% of LA/BSA variance (sex and age-sex interaction as additional significant covariates), and 34% of LA/HT variance (age-sex interaction as additional significant covariates) variance. After adjusting for the significant covariates, the heritability of LA diameter, LA/BSA, and LA/HT were 0.42, 0.35, and 0.34, respectively.
Table 2.
Heritability estimate of left atrial size
| Trait | Significant
Covariates |
h2 +/−SE | Variance by Covariates | |||||
|---|---|---|---|---|---|---|---|---|
| Age | Sex | Age × Sex | Dyslipidemia | Smoking | BMI | |||
| LA diameter | × | × | × | × | × | 0.42 ± 0.06 | 0.32 | |
| LA/BSA | × | × | × | × | × | 0.35 ± 0.06 | 0.21 | |
| LA/HT | × | × | × | × | 0.34 ± 0.05 | 0.34 | ||
As the non-corrected LA diameter measurement had the highest estimate of heritability, we focused our QTL mapping on non-corrected LA diameter. Two-point linkage analysis found suggestive evidence (LOD scores ≥2.0) on chromosomes 10 and 17 (Figure 1). Multipoint linkage analysis confirmed evidence for linkage in the two regions: 10p19 (MLOD=2.00) and 17p10 (MLOD=2.05) (Table 3). However, neither of them met the criteria for genome-wide significance.
Figure 1. Two-point LOD scores for left atrial size.

Variance components methodology as implemented in SOLAR was used to calculate two-point LOD scores in 100 Dominican families. LOD scores of 405 mcirosatellite markers were plotted along all chromosomes.
Table 3.
Potential QTLs mapped for left atrial size.
| Chromosomal Region | Position (cM) | Marker | Maximum LOD Score | p-value* |
|---|---|---|---|---|
| 10p19 | 40 | D10S1423 | 1.99 | 0.0015 |
| 17p10 | 24 | D17S974 | 2.05 | 0.0014 |
Empirical p-value was calculated based on 10,000 permutations.
To reduce phenotypic heterogeneity and therefore strengthen the linkage signal, we performed OSA for the two promising regions. Quantitative covariates related to LA size variance were used to rank families from high to low (H-L) or low to high (L-H) order. Five covariates, SBP, HDL, LDL, triglyeride, and waist circumference, were used in our OSA. HDL, LDL and triglyeride were chosen because dyslipidemia significantly contributed to the LA diameter in our Dominican families (Table 2), even though the lipid levels are not traditionally considered as important factors affecting LA size. Among all ranking strategies, significantly enhanced linkage evidence was observed while ordering families by average LDL from L-H on chromosome 17p10 (OSA subset MLOD=2.9, p=0.0314 for increase of linkage) (Figure 2). The LDL-defined subset included 83 families with lower LDL. The average LDL was 105.2 mg/dL for the OSA subset of families and 130.3 mg/dL for the rest of families (data not shown).
Figure 2. Multipoint linkage plot for left atrial size on chromosome 17 in overall families and subset families defined by OSA.
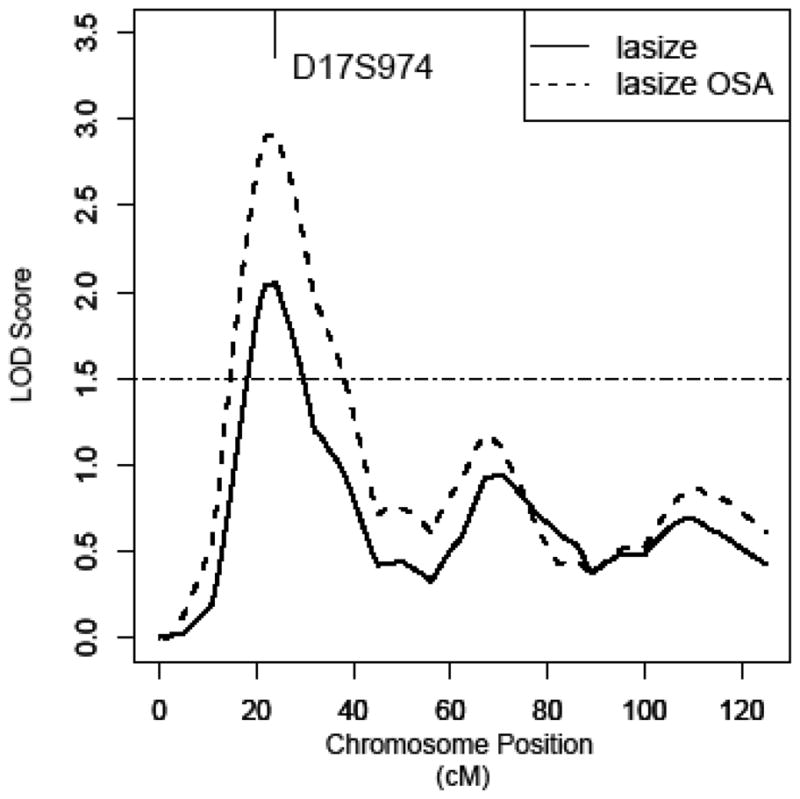
Ordered-subset analysis (OSA) has defined a subset of 83 families with lower average LDL on chromosome 17. Multipoint LOD score curve is depicted in the overall families as solid line and in the subset as dashed line.
To fine map our most prominent peak, we conducted a peak-wide association study (PWAS) using SNP data from a recent GWAS completed in the NOMAS cohort. 723,979 SNPs across the whole genome passed quality control. Among them, 2233 SNPs were located within the one-LOD unit down region (6.8 megabase to 14.4 megabase) of the 17p10 linkage peak. Significant covariates based on the stepwise selection procedure were used in all analyses and included PCA1, PCA3, age, sex, BMI, hypertension, and years between baseline and echocardiographic measurement. The effective number of independent tests is 763 for the 2233 SNPs surveyed. Using a conservative Bonferroni correction, the peak-wide significance threshold is 0.05/763=0.00007. The top two associated SNPs met the peak-wide significance criterion: rs1029659 (p=0.00004, beta=0.024) in an intergenic region near Cytochrome C Oxidase Protein 10 (COX10) and rs4791774 (p=0.00005, beta=-0.021) in Netrin 1 (NTN1) (p<0.00005, Figure 3 and Table 4).
Figure 3. Peak-wide association test on chromosome 17p10.
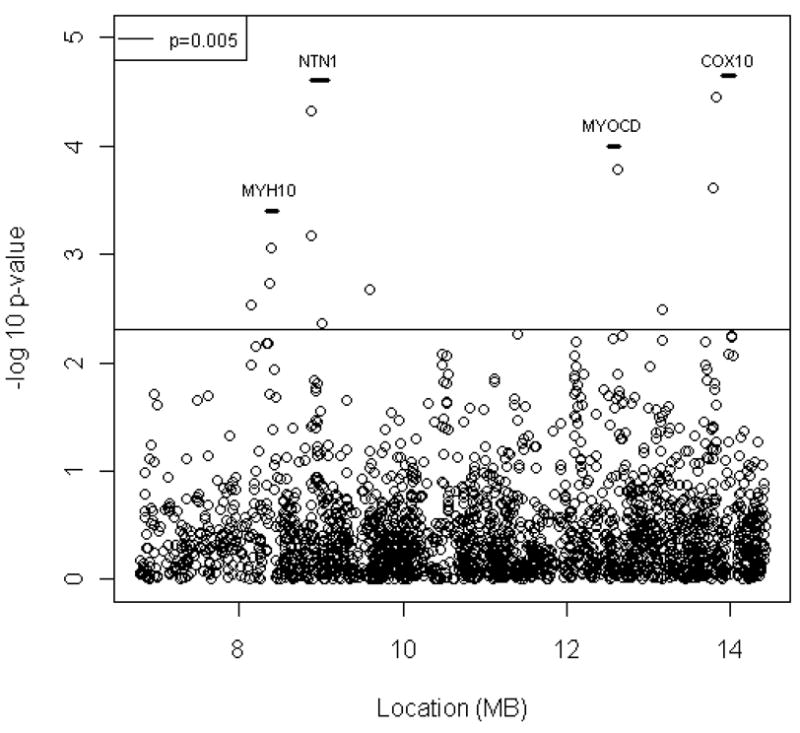
2232 SNPs were used for a peak-wide association analysis on the chromosome 17p10 one-LOD unit down region. Each dot represents an association test using an additive genetic model in the NOMAS cohort. Genes that have SNPs with p value less than 0.005 are displayed as short a vertical bar with gene symbol on top of it.
Table 4.
Top associated SNPs in NOMAS cohort on chromosome 17P10.
| SNP | Position (BP) | Minor Allele | MAF* | Beta | L95 | U95 | P value | Gene |
|---|---|---|---|---|---|---|---|---|
| rs4792734 | 8,148,880 | G | 0.24 | 0.02 | 0.006 | 0.03 | 0.00296 | |
| rs4791716 | 8,368,905 | T | 0.04 | −0.04 | −0.07 | −0.02 | 0.00186 | MYH10 |
| rs7223040 | 8,390,874 | A | 0.04 | −0.04 | −0.07 | −0.02 | 0.00088 | MYH10 |
| rs4791331 | 8,872,807 | G | 0.44 | −0.02 | −0.03 | −0.01 | 0.00068 | NTN1 |
| rs4791774 | 8,872,844 | T | 0.48 | −0.02 | −0.03 | −0.01 | 0.00005 | NTN1 |
| rs11870124 | 9,017,262 | C | 0.18 | 0.02 | 0.006 | 0.032 | 0.00436 | NTN1 |
| rs531437 | 9,593,224 | C | 0.06 | −0.04 | −0.06 | −0.01 | 0.0021 | |
| rs7212848 | 12,630,866 | G | 0.48 | 0.02 | 0.01 | 0.032 | 0.00017 | MYOCD/LOC100128006 |
| rs11869775 | 13,174,929 | G | 0.14 | 0.02 | 0.007 | 0.036 | 0.00318 | |
| rs4411532 | 13,793,698 | A | 0.5 | −0.02 | −0.03 | −0.01 | 0.00025 | |
| rs1029659 | 13,828,746 | A | 0.28 | 0.02 | 0.013 | 0.036 | 0.00004 | COX10 |
MAF: minor allele frequency
Several SNPs with nominal p ≤ 0.005 were found in LOC100128006, Nonmuscle Myosin Heavy Chain 10 (MYH10), NTN1 and intergenic regions (Table 4 and Figure 3). Some of them are located within genes that have been implicated in cardiac hypertrophy. For example, LOC100128006 is next to Myocardin (MYOCD) and codes an antisense RNA for MYOCD. As a co-activator of serum response factor (SRF), MYOCD regulates cardiac gene expression and smooth muscle cell differentiation 29–31. It has been shown that MYOCD is a key regulator of cardiac myocytes hypertrophy in vitro. 32 MYH10 encodes a nonmuscle myosin heavy chain and is expressed in heart. Mice that have heart-specific ablation of MYH10 were born with enlarged cardiac myocytes and developed cardiomyopathy. 33 In addition to the peak-wide significant SNP, two other NTN1 SNPs (rs4791331 and rs11870124) showed evidence of association (p<0.005).
Discussion
Using well-characterized, extended Dominican Republic families and an independent community-based prospective cohort, we demonstrated that genetic factors explain a moderate proportion of the variance in LA size and mapped a few candidate genes that warrant further study. This is the first comprehensive genetic study on LA size among Caribbean Hispanics.
The most significant finding is for rs1029659 close to COX10. The protein product of COX10 is essential for the cytochrome C oxidase (COX), which is the terminal component of the mitochondrial respiratory chain. COX is essential for energy homeostasis and defects in COX would likely lead to cardiac hypertrophy to compensate for the insufficient energy supply in the cardiac smooth muscle cells. A patient with missense mutations in both alleles of COX10 gene has been reported. One of the clinical symptoms for the patient is severe hypertrophic cardiomyopathy 34. It is worth noting that four additional SNPs within COX10 had nominally significant p values (p=0.006 to 0.008, Figure 3), providing additional support for the association between COX10 and LA size. Another peak-wide significant finding is in NTN1. The protein product the gene belongs to a family of laminin-related secreted proteins and it is thought to be involved in axon guidance and cell migration during development and angiogenesis. NTN1 might contribute to the enlargement of left atrium through its angiogenic activity.
The susceptibility genes in 17p10 seem to be implicated in heart structure in general. However, we did not find evidence for linkage in this region for left ventricular mass (LVM).35 We evaluated the association between the significant SNPs in Table 4 and LVM in the NOMAS cohort (data not shown). Except the SNP (rs7212848, p=0.003) near MYOCD, none of them are significantly associated with LVM, which suggest that these genes have different effects on LA size and LVM. The significant association between MYOCD and LVM, however, further supports that the gene is a master regulator of cardiac smooth muscle differentiation and lineage. Given the strong known functions of this cardiac-specific factor, we believe that genetic variations that modifying MYOCD level or function are likely to influence LA size and LVM.
Literature on the heritability of LA size is sparse, with only two published studies. In the Tecumseh Offspring Study 13, parent-children correlation for LA size was 0.19 (p=0.007). This correlation is approximately equal to a heritability of 38%, which is comparable to our results. In the Framingham Heart Study, the estimate of heritability for LA diameter was 25% 16. Unlike these previous studies, which were conducted in Caucasian cohorts, our families were entirely comprised of Caribbean Hispanics, for whom no data on the heritability of LA size exists.
A few studies have investigated association between LA size and polymorphisms in candidate genes. Most of the examined genes are associated with the renin-angiotensin system and results have been conflicting. The LA size was larger in individuals who were homozygous for the insertion polymorphism of the angiotensin converting enzyme in Turkish hypertensive patients 15 but not in Chinese patients14. No association was found between LA size and the −344T/C polymorphism in the aldosterone synthase (CYP11B2) gene in patients with heart failure 17.
In contrast to candidate gene studies, a genome-wide approach, such asthe one used in this study, has the potential to expand our knowledge of the biological basis of LA enlargement by identifying new genes and new pathways. Using 100, 000 SNPs the Framingham Heart Study reported suggestive evidence for linkage on chromosome 13q31.1 (MLOD=2.55) for LA diameter 16. Using 402 microsatellite markers, we did not detect any evidence for linkage in this region, which might be related to the relative lower resolution in our study. Another possible explanation is that our study involves a unique ethnic population, which might have a different genetic basis for LA size.
Recently, a meta-analysis of GWAS on cardiac structure measurements was conducted by the EchoGen consortium consisting of five community-based cohorts, including the Cardiovascular Health Study, the Rotterdam study, the KORA, the Framingham Heart Study, and the Gutenbery Heart Study. 36 No SNP was associated with LA size at the genome-wide significant level. The strongest association was found in SMG-6 (p=9 × 10⁻⁷), about 4.3 megabases away from our 17p10 peak. The affymetrix 6.0 chip used in our NOMAS cohort includes 60 SNPs in SMG-6. Only rs12451892 was marginally (p=0.02, data not shown) associated with LA diameter but it would not survive multiple testing correction. Further studies are needed to evaluate the significance of SMG-6 to LA size in different populations.
Arterial hypertension is a well described risk factor for enlarged LA size. However, we found that hypertension did not contribute to LA size significantly (p=0.2) when we evaluated all traditional covariates, including age, sex, smoking, diabetes, dyslipidemia, hypertension, and BMI, together in a polygenic screening model in our family dataset. One possible explanation is that age served as surrogate for hypertension in our model. This notion was supported by the observation that hypertension became significant when age was not included in the covariate screening model.
The present study is the first to evaluate genetic basis to LA size in Hispanic population. There are several strengths of our study. First, the extended Dominican families and large sample size provided substantial statistical power. Second, the echocardiographic assessment in probands and their family members was performed by the same investigators adopting a common protocol assuring consistent phenotyping of the quantitative trait. Third, the genome-wide approach followed by fine-mapping in an independent cohort allowed us to evaluate the genetic contribution to LA size through the whole genome instead of taking a snapshot of one or a few genes at a time. We also acknowledge several limitations. We used LA diameter instead of volume as a measure of the LA size. Volume is considered a more accurate measure of the atrial size, especially in the case of asymmetric enlargement 12. However, the measurement of a single LA diameter has been shown to have good intraobserver and interobserver concordance 37. Another weakness is the possibility that other covariates and some shared environmental factors affecting LA size variance may not have been accounted for in our heritability estimates. This is an inherent pitfall of the heritability estimation, which we addressed by including the most known risk factors associated with LA size. Finally, to reduce heterogeneity and increase our power to map the QTLs, we restricted our study to Dominican families with strong genetic burden for vascular diseases. As a result, our findings should not be directly generalized to other populations.
In conclusion, we have demonstrated a moderate genetic component of LA size variance and mapped several potential genes that influence LA size. Further studies are warranted to evaluate the contribution of these genetic variants to LA size.
Acknowledgments
We would like to thank all staff of the Northern Manhattan Family Study for their efforts, and in particular Edison Sabala, Carlos Garcia-Lithgow, Kathiurca Almonte, and Suh-Huang Juo.
Funding Sources
This work was supported by grants R01 NS NS40807 (RLS, TR, MRDT, SH), and R01 NS047655 (TR, RLS) from the National Institute of Neurologic Disorders and Stroke (NINDS). Dr. Di Tullio was supported by a NINDS Mid-Career Investigator Award in Patient-Oriented Research (K24 NS02241).
Footnotes
Disclosures
Authors have no conflicts of interest to disclose.
References
- 1.Giannuzzi P, Temporelli PL, Bosimini E, Silva P, Imparato A, Corra U, Galli M, Giordano A. Independent and incremental prognostic value of Doppler-derived mitral deceleration time of early filling in both symptomatic and asymptomatic patients with left ventricular dysfunction. J Am Coll Cardiol. 1996;28:383–390. doi: 10.1016/0735-1097(96)00163-5. [DOI] [PubMed] [Google Scholar]
- 2.Cabin HS, Clubb KS, Hall C, Perlmutter RA, Feinstein AR. Risk for systemic embolization of atrial fibrillation without mitral stenosis. Am J Cardiol. 1990;65:1112–1116. doi: 10.1016/0002-9149(90)90323-s. [DOI] [PubMed] [Google Scholar]
- 3.Kizer JR, Bella JN, Palmieri V, Liu JE, Best LG, Lee ET, Roman MJ, Devereux RB. Left atrial diameter as an independent predictor of first clinical cardiovascular events in middle-aged and elderly adults: the Strong Heart Study (SHS) Am Heart J. 2006;151:412–418. doi: 10.1016/j.ahj.2005.04.031. [DOI] [PubMed] [Google Scholar]
- 4.Laukkanen JA, Kurl S, Eranen J, Huttunen M, Salonen JT. Left atrium size and the risk of cardiovascular death in middle-aged men. Arch Intern Med. 2005;165:1788–1793. doi: 10.1001/archinte.165.15.1788. [DOI] [PubMed] [Google Scholar]
- 5.Vaziri SM, Larson MG, Benjamin EJ, Levy D. Echocardiographic predictors of nonrheumatic atrial fibrillation. The Framingham Heart Study. Circulation. 1994;89:724–730. doi: 10.1161/01.cir.89.2.724. [DOI] [PubMed] [Google Scholar]
- 6.Tsang TS, Gersh BJ, Appleton CP, Tajik AJ, Barnes ME, Bailey KR, Oh JK, Leibson C, Montgomery SC, Seward JB. Left ventricular diastolic dysfunction as a predictor of the first diagnosed nonvalvular atrial fibrillation in 840 elderly men and women. J Am Coll Cardiol. 2002;40:1636–1644. doi: 10.1016/s0735-1097(02)02373-2. [DOI] [PubMed] [Google Scholar]
- 7.Gardin JM, McClelland R, Kitzman D, Lima JA, Bommer W, Klopfenstein HS, Wong ND, Smith VE, Gottdiener J. M-mode echocardiographic predictors of six-to seven-year incidence of coronary heart disease, stroke, congestive heart failure, and mortality in an elderly cohort (the Cardiovascular Health Study) Am J Cardiol. 2001;87:1051–1057. doi: 10.1016/s0002-9149(01)01460-6. [DOI] [PubMed] [Google Scholar]
- 8.Benjamin EJ, D’Agostino RB, Belanger AJ, Wolf PA, Levy D. Left atrial size and the risk of stroke and death. The Framingham Heart Study. Circulation. 1995;92:835–841. doi: 10.1161/01.cir.92.4.835. [DOI] [PubMed] [Google Scholar]
- 9.Barnes ME, Miyasaka Y, Seward JB, Gersh BJ, Rosales AG, Bailey KR, Petty GW, Wiebers DO, Tsang TS. Left atrial volume in the prediction of first ischemic stroke in an elderly cohort without atrial fibrillation. Mayo Clin Proc. 2004;79:1008–1014. doi: 10.4065/79.8.1008. [DOI] [PubMed] [Google Scholar]
- 10.Di Tullio MR, Sacco RL, Sciacca RR, Homma S. Left atrial size and the risk of ischemic stroke in an ethnically mixed population. Stroke. 1999;30:2019–2024. doi: 10.1161/01.str.30.10.2019. [DOI] [PubMed] [Google Scholar]
- 11.Kohsaka S, Sciacca RR, Sugioka K, Sacco RL, Homma S, Di Tullio MR. Electrocardiographic left atrial abnormalities and risk of ischemic stroke. Stroke. 2005;36:2481–2483. doi: 10.1161/01.STR.0000185682.09981.26. [DOI] [PMC free article] [PubMed] [Google Scholar]
- 12.Abhayaratna WP, Seward JB, Appleton CP, Douglas PS, Oh JK, Tajik AJ, Tsang TS. Left atrial size: physiologic determinants and clinical applications. J Am Coll Cardiol. 2006;47:2357–2363. doi: 10.1016/j.jacc.2006.02.048. [DOI] [PubMed] [Google Scholar]
- 13.Palatini P, Amerena J, Nesbitt S, Valentini M, Majahalme S, Krause L, Tikhonoff V, Julius S. Heritability of left atrial size in the Tecumseh population. Eur J Clin Invest. 2002;32:467–471. doi: 10.1046/j.1365-2362.2002.01009.x. [DOI] [PubMed] [Google Scholar]
- 14.Huang M, Gai X, Yang X, Hou J, Lan X, Zheng W, Chen F, He J. Functional polymorphisms in ACE and CYP11B2 genes and atrial fibrillation in patients with hypertensive heart disease. Clin Chem Lab Med. 2009;47:32–37. doi: 10.1515/CCLM.2009.023. [DOI] [PubMed] [Google Scholar]
- 15.Gunes HV, Ata N, Degirmenci I, Basaran A, Timuralp B, Dikmen M, Ustuner C, Kudaiberdieva G. Frequency of angiotensin-converting enzyme gene polymorphism in Turkish hypertensive patients. Int J Clin Pract. 2004;58:838–843. doi: 10.1111/j.1742-1241.2004.00206.x. [DOI] [PubMed] [Google Scholar]
- 16.Vasan RS, Larson MG, Aragam J, Wang TJ, Mitchell GF, Kathiresan S, Newton-Cheh C, Vita JA, Keyes MJ, O’Donnell CJ, Levy D, Benjamin EJ. Genome-wide association of echocardiographic dimensions, brachial artery endothelial function and treadmill exercise responses in the Framingham Heart Study. BMC Med Genet. 2007;8 (Suppl 1):S2. doi: 10.1186/1471-2350-8-S1-S2. [DOI] [PMC free article] [PubMed] [Google Scholar]
- 17.Amir O, Amir RE, Paz H, Mor R, Sagiv M, Lewis BS. Aldosterone synthase gene polymorphism as a determinant of atrial fibrillation in patients with heart failure. Am J Cardiol. 2008;102:326–329. doi: 10.1016/j.amjcard.2008.03.063. [DOI] [PubMed] [Google Scholar]
- 18.Sacco RL, Sabala EA, Rundek T, Juo SH, Huang JS, DiTullio M, Homma S, Almonte K, Lithgow CG, Boden-Albala B. Design of a family study among high-risk Caribbean Hispanics: the Northern Manhattan Family Study. Ethn Dis. 2007;17:351–357. [PMC free article] [PubMed] [Google Scholar]
- 19.Sahn DJ, DeMaria A, Kisslo J, Weyman A. Recommendations regarding quantitation in M-mode echocardiography: results of a survey of echocardiographic measurements. Circulation. 1978;58:1072–1083. doi: 10.1161/01.cir.58.6.1072. [DOI] [PubMed] [Google Scholar]
- 20.Sun L, Wilder K, McPeek MS. Enhanced pedigree error detection. Hum Hered. 2002;54:99–110. doi: 10.1159/000067666. [DOI] [PubMed] [Google Scholar]
- 21.O’Connell JR, Weeks DE. PedCheck: a program for identification of genotype incompatibilities in linkage analysis. Am J Hum Genet. 1998;63:259–266. doi: 10.1086/301904. [DOI] [PMC free article] [PubMed] [Google Scholar]
- 22.Purcell S, Neale B, Todd-Brown K, Thomas L, Ferreira MA, Bender D, Maller J, Sklar P, de Bakker PI, Daly MJ, Sham PC. PLINK: a tool set for whole-genome association and population-based linkage analyses. Am J Hum Genet. 2007;81:559–575. doi: 10.1086/519795. [DOI] [PMC free article] [PubMed] [Google Scholar]
- 23.Amos CI, Krushkal J, Thiel TJ, Young A, Zhu DK, Boerwinkle E, de Andrade M. Comparison of model-free linkage mapping strategies for the study of a complex trait. Genet Epidemiol. 1997;14:743–748. doi: 10.1002/(SICI)1098-2272(1997)14:6<743::AID-GEPI30>3.0.CO;2-O. [DOI] [PubMed] [Google Scholar]
- 24.Almasy L, Blangero J. Multipoint quantitative-trait linkage analysis in general pedigrees. Am J Hum Genet. 1998;62:1198–1211. doi: 10.1086/301844. [DOI] [PMC free article] [PubMed] [Google Scholar]
- 25.Schork NJ. Extended pedigree patterned covariance matrix mixed models for quantitative phenotype analysis. Genet Epidemiol. 1992;9:73–86. doi: 10.1002/gepi.1370090202. [DOI] [PubMed] [Google Scholar]
- 26.Hauser ER, Watanabe RM, Duren WL, Bass MP, Langefeld CD, Boehnke M. Ordered subset analysis in genetic linkage mapping of complex traits. Genet Epidemiol. 2004;27:53–63. doi: 10.1002/gepi.20000. [DOI] [PubMed] [Google Scholar]
- 27.Price AL, Patterson NJ, Plenge RM, Weinblatt ME, Shadick NA, Reich D. Principal components analysis corrects for stratification in genome-wide association studies. Nat Genet. 2006;38:904–909. doi: 10.1038/ng1847. [DOI] [PubMed] [Google Scholar]
- 28.Gao X, Starmer J, Martin ER. A multiple testing correction method for genetic association studies using correlated single nucleotide polymorphisms. Genet Epidemiol. 2008;32:361–369. doi: 10.1002/gepi.20310. [DOI] [PubMed] [Google Scholar]
- 29.Wang D, Chang PS, Wang Z, Sutherland L, Richardson JA, Small E, Krieg PA, Olson EN. Activation of cardiac gene expression by myocardin, a transcriptional cofactor for serum response factor. Cell. 2001;105:851–862. doi: 10.1016/s0092-8674(01)00404-4. [DOI] [PubMed] [Google Scholar]
- 30.Huang J, Min Lu M, Cheng L, Yuan LJ, Zhu X, Stout AL, Chen M, Li J, Parmacek MS. Myocardin is required for cardiomyocyte survival and maintenance of heart function. Proc Natl Acad Sci U S A. 2009;106:18734–18739. doi: 10.1073/pnas.0910749106. [DOI] [PMC free article] [PubMed] [Google Scholar]
- 31.Wang Z, Wang DZ, Pipes GC, Olson EN. Myocardin is a master regulator of smooth muscle gene expression. Proc Natl Acad Sci U S A. 2003;100:7129–7134. doi: 10.1073/pnas.1232341100. [DOI] [PMC free article] [PubMed] [Google Scholar]
- 32.Xing W, Zhang TC, Cao D, Wang Z, Antos CL, Li S, Wang Y, Olson EN, Wang DZ. Myocardin induces cardiomyocyte hypertrophy. Circ Res. 2006;98:1089–1097. doi: 10.1161/01.RES.0000218781.23144.3e. [DOI] [PubMed] [Google Scholar]
- 33.Ma X, Takeda K, Singh A, Yu ZX, Zerfas P, Blount A, Liu C, Towbin JA, Schneider MD, Adelstein RS, Wei Q. Conditional ablation of nonmuscle myosin II-B delineates heart defects in adult mice. Circ Res. 2009;105:1102–1109. doi: 10.1161/CIRCRESAHA.109.200303. [DOI] [PMC free article] [PubMed] [Google Scholar]
- 34.Antonicka H, Leary SC, Guercin GH, Agar JN, Horvath R, Kennaway NG, Harding CO, Jaksch M, Shoubridge EA. Mutations in COX10 result in a defect in mitochondrial heme A biosynthesis and account for multiple, early-onset clinical phenotypes associated with isolated COX deficiency. Hum Mol Genet. 2003;12:2693–2702. doi: 10.1093/hmg/ddg284. [DOI] [PubMed] [Google Scholar]
- 35.Wang L, Beecham A, Di Tullio MR, Slifer S, Blanton SH, Rundek T, Sacco RL. Novel quantitative trait locus is mapped to chromosome 12p11 for left ventricular mass in Dominican families: the Family Study of Stroke Risk and Carotid Atherosclerosis. BMC Med Genet. 2009;10:74. doi: 10.1186/1471-2350-10-74. [DOI] [PMC free article] [PubMed] [Google Scholar]
- 36.Vasan RS, Glazer NL, Felix JF, Lieb W, Wild PS, Felix SB, Watzinger N, Larson MG, Smith NL, Dehghan A, Grosshennig A, Schillert A, Teumer A, Schmidt R, Kathiresan S, Lumley T, Aulchenko YS, Konig IR, Zeller T, Homuth G, Struchalin M, Aragam J, Bis JC, Rivadeneira F, Erdmann J, Schnabel RB, Dorr M, Zweiker R, Lind L, Rodeheffer RJ, Greiser KH, Levy D, Haritunians T, Deckers JW, Stritzke J, Lackner KJ, Volker U, Ingelsson E, Kullo I, Haerting J, O’Donnell CJ, Heckbert SR, Stricker BH, Ziegler A, Reffelmann T, Redfield MM, Werdan K, Mitchell GF, Rice K, Arnett DK, Hofman A, Gottdiener JS, Uitterlinden AG, Meitinger T, Blettner M, Friedrich N, Wang TJ, Psaty BM, van Duijn CM, Wichmann HE, Munzel TF, Kroemer HK, Benjamin EJ, Rotter JI, Witteman JC, Schunkert H, Schmidt H, Volzke H, Blankenberg S. Genetic variants associated with cardiac structure and function: a meta-analysis and replication of genome-wide association data. JAMA. 2009;302:168–178. doi: 10.1001/jama.2009.978-a. [DOI] [PMC free article] [PubMed] [Google Scholar]
- 37.Wade MR, Chandraratna PA, Reid CL, Lin SL, Rahimtoola SH. Accuracy of nondirected and directed M-mode echocardiography as an estimate of left atrial size. Am J Cardiol. 1987;60:1208–1211. doi: 10.1016/0002-9149(87)90434-6. [DOI] [PubMed] [Google Scholar]