

Use of the spectral CT imaging system with the gold high-density lipoprotein nanoparticle contrast agent can enable the detection of macrophages in atherosclerosis and imaging of the vasculature and calcified tissue at the same time.
Abstract
Purpose:
To investigate the potential of spectral computed tomography (CT) (popularly referred to as multicolor CT), used in combination with a gold high-density lipoprotein nanoparticle contrast agent (Au-HDL), for characterization of macrophage burden, calcification, and stenosis of atherosclerotic plaques.
Materials and Methods:
The local animal care committee approved all animal experiments. A preclinical spectral CT system in which incident x-rays are divided into six different energy bins was used for multicolor imaging. Au-HDL, an iodine-based contrast agent, and calcium phosphate were imaged in a variety of phantoms. Apolipoprotein E knockout (apo E–KO) mice were used as the model for atherosclerosis. Gold nanoparticles targeted to atherosclerosis (Au-HDL) were intravenously injected at a dose of 500 mg per kilogram of body weight. Iodine-based contrast material was injected 24 hours later, after which the mice were imaged. Wild-type mice were used as controls. Macrophage targeting by Au-HDL was further evaluated by using transmission electron microscopy and confocal microscopy of aorta sections.
Results:
Multicolor CT enabled differentiation of Au-HDL, iodine-based contrast material, and calcium phosphate in the phantoms. Accumulations of Au-HDL were detected in the aortas of the apo E–KO mice, while the iodine-based contrast agent and the calcium-rich tissue could also be detected and thus facilitated visualization of the vasculature and bones (skeleton), respectively, during a single scanning examination. Microscopy revealed Au-HDL to be primarily localized in the macrophages on the aorta sections; hence, the multicolor CT images provided information about the macrophage burden.
Conclusion:
Spectral CT used with carefully chosen contrast agents may yield valuable information about atherosclerotic plaque composition.
© RSNA, 2010
Supplemental material: http://radiology.rsna.org/lookup/suppl/doi:10.1148/radiol.10092473/-/DC1
Introduction
Ruptures of atherosclerotic plaques are the cause of about 70% of heart attacks (1). It is widely recognized that the risk of atherosclerotic plaque rupture and consequent adverse cardiovascular events is primarily related to the composition of the plaques (2). One of the main factors associated with an elevated risk of plaque rupture is a high macrophage content (3,4). As a result, much work has been devoted to developing contrast material–enhanced imaging methods for determining the macrophage content of plaques (5–8). Although magnetic resonance (MR) imaging and fluorine 18 fluorodeoxyglucose positron emission tomography (PET) are useful for imaging arteries such as the aorta and carotid arteries, and other peripheral vessels, the associated long image acquisition times combined with the motion in the chest make imaging of the coronary arteries with these techniques very challenging (7). Computed tomography (CT) is a competitive technique for imaging the coronary arteries because multidetector CT scanners can be used to acquire high-spatial-resolution images of the entire heart within 5 seconds (9). Consequently, CT used with iodine-based contrast material is now a highly regarded clinical technique for detecting stenosis (10,11), plaque buildup (12,13), and calcification in the coronary arteries (14,15).
Recently, efforts have been made to derive more information from CT scans (16) to identify the type of tissue or material being scanned by using the characteristic energy-dependent attenuation of x-rays (Fig 1a) (17). Although several methods can be used to interrogate the energy-dependant attenuation of the x-rays of materials (18), this report is focused on energy-resolved photon-counting CT, or spectral CT. This technique involves the use of the x-ray spectrum from a single x-ray tube voltage with a special detector that allocates incident x-rays into six energy bins (19). The information from these energy bins enables the identification of materials by decomposing the total attenuation of the material into the various physical contributions for each pixel (20). Feuerlein et al used this technique to improve imaging of the lumen, calcified plaque, and stent material in an artery phantom (21).
Figure 1a:

(a) Graph shows energy dependence of x-ray attenuation of water due to Compton scatter and photoelectric effect, as compared with attenuation of k-edge material (ie, gold). (b) Schematic illustration of macrophage-targeted gold core nanoparticle Au-HDL. HDL = high-density lipoprotein. (c) Characterization of Au-HDL on negative-stain transmission electron microscopy (TEM) image.
In 2008, we reported a targeted gold nanoparticle CT contrast agent based on high-density lipoprotein that is specific for macrophages (22). This gold high-density lipoprotein nanoparticle contrast agent (Au-HDL) (Fig 1b) was used to identify the macrophage-rich plaques in aortas excised from apolipoprotein E knockout (apo E–KO) mice by using a micro-CT scanner (22). The purpose of this study was to investigate the potential of spectral CT (popularly referred to as multicolor CT), used in combination with Au-HDL, for characterization of the macrophage burden, calcification, and stenosis of atherosclerotic plaques from a single scanning examination.
Figure 1b:

(a) Graph shows energy dependence of x-ray attenuation of water due to Compton scatter and photoelectric effect, as compared with attenuation of k-edge material (ie, gold). (b) Schematic illustration of macrophage-targeted gold core nanoparticle Au-HDL. HDL = high-density lipoprotein. (c) Characterization of Au-HDL on negative-stain transmission electron microscopy (TEM) image.
Materials and Methods
Philips Healthcare (Hamburg, Germany) supported this study by providing access to the experimental CT scanner and performing image processing. The authors who are not employees of or consultants for Philips Medical Systems (D.P.C., T.S., R.E.G., V.F., E.A.F., W.J.M.M., Z.A.F.) had full control of the inclusion of any data and information that might have represented a conflict of interest for those authors who are employees of or consultants for Philips Medical Systems (E.R., A.T., J.P.S., R.P.). Two authors (Z.A.F., E.A.F.) hold a patent on the Au-HDL evaluated in this study.
Experiment Materials
Lipids were purchased from Avanti Polar Lipids (Alabaster, Ala) and were used as received. Iopamidol (Isovue) was obtained from Bracco Diagnostics (Princeton, NJ). The iodine-containing emulsions (Fenestra VC;) were supplied by Advanced Research Technologies (Montreal, Quebec, Canada).
Nanoparticle Synthesis and Characterization
Au-HDL was synthesized by using a method similar to that reported previously (22); the technique is described in detail in Appendix E1 (online).
D.P.C. (8 years of experience) synthesized and characterized the Au-HDL. The phosphate concentration was determined by using the method of Rouser et al (23). The protein concentration was determined by using the method of Markwell et al (24), with adjustment for the light absorbance of the gold cores. Negative-stain TEM was performed by using a Hitachi H-7650 transmission electron microscope (Hitachi High Technologies, Pleasanton, Calif). Samples were prepared for TEM by using the method of Forte and Nordhausen (25). The gold content was determined by means of inductively coupled plasma mass spectrometry (Cantest, Burnaby, British Columbia, Canada).
Spectral CT Scanner
The spectral CT scanner (Philips Healthcare) we used is an experimental research instrument that has been previously described in detail (20). In brief, the scanner is equipped with a single-line, energy-sensitive photon-counting detector (Gamma Medica-Ideas, Northridge, Calif) with 3-mm-thick cadmium telluride sensor material. The x-ray source is a KEVEX PXS10–65 W microfocus tube (Thermo Scientific, Scotts Valley, Calif). The exit window for the x-ray tube is made from beryllium. Scanning was performed with a 2-mm-thick aluminum filter. The x-ray source and detector were mounted on a direct-drive rotating gantry. Spectral CT scanning was performed at 50 μA and 130 keV by using six energy bins. The energy thresholds in the detector electronics of the 1024 individual detector pixels were adjusted to incident energies of 25, 34, 51, 80, 91, and 110 keV, which yielded the highest sensitivity for simultaneous imaging of iodine (k-edge energy, 33.2 keV) and gold (k-edge energy, 80.7 keV).
Water, meat, and blended phantoms were imaged by using a geometric magnification factor of two, which resulted in an in-plane resolution of 0.25 mm (600 × 600 pixel image matrix), while the artery phantom and the apo E–KO mice (Jackson Laboratory, Bar Harbor, Me) were imaged by using a geometric magnification factor of six, which resulted in an in-plane resolution of about 0.1 mm (400 × 400 pixel image matrix). We preprocessed the measured six-bin photon-counting raw data to correct for a variety of detector imperfections, such as dead time and gain variations, as described previously (20). Afterward, the measured data were decomposed into material equivalents by using a maximum likelihood approach, as previously described (19). For simultaneous imaging of two contrast materials, we performed two consecutive decompositions. In each case, the conventional two-dimensional photo-Compton analysis of Alvarez and Macovski (26) was extended by one contrast material only—either iodine or gold—to a three-dimensional analysis. This was necessary because of the otherwise increased noise in the combined four-dimensional basis material decomposition. Merging the data from the six energy bins yielded conventional CT images. A.T. and E.R. (10 and 5 years of experience, respectively) performed scanning and image processing.
Phantom Preparation
Four phantoms were prepared for the studies described in this report. These phantoms contained Au-HDL, iodinated contrast agents, and calcium phosphate to simulate calcified tissue in either water or meat. The four phantoms were a concentration series in water, a concentration series in meat, an Au-HDL and iopamidol–blended concentration series in water, and an artery phantom. We prepared the concentration series in water by diluting the stock solutions with phosphate-buffered saline. We prepared the concentration series in meat by mixing volumes of the stock solutions with raw ground beef. The arterial phantom was constructed inside a 1.5-mL centrifuge tube with nontreated meat, meat treated with Au-HDL and calcium phosphate (contained in a plastic package) around the periphery, and iopamidol filling the remaining volume of the tube bore.
Animal Experiments
We used an apo E–KO mouse model of atherosclerosis in these experiments (27). These mice had been on the Western high-fat, high-cholesterol diet for an average of 10 months and were 1 year old at the time of the experiments. Age-matched wild-type mice (Jackson Laboratory) (fed on a regular chow diet) were used as controls. All of the mice were male and were housed and maintained in a purpose-designed facility. The local animal care and use committee approved all experiments. D.P.C. (4 years of experience) handled the mice.
The animals were injected, via the tail vein, with Au-HDL at a dose of 500 mg of gold per kilogram of body weight. They were sacrificed 24 hours later and frozen before being examined with CT scanning. Some of the mice were injected with 150 μl of an iodinated emulsion (Fenestra VC) (28) at 24 hours, 5 minutes before they were sacrificed. The mouse groups were as follows: apo E–KO mice injected with Au-HDL (n = 2), apo E–KO mice injected with Au-HDL and the iodine-based contrast agent (n = 3), and wild-type mice (controls) injected with Au-HDL (n = 3).
Tissue TEM and Confocal Microscopy
The aortas of two apo E–KO mice injected with Au-HDL 24 hours earlier were excised, and 5-mm-long sections were cut from the arch, at the renal arteries and the bifurcation. Sections were prepared for TEM imaging by using standard methods (29). One author (R.E.G., 39 years experience) prepared and analyzed the TEM sections. Another author (D.P.C., 4 years experience) prepared sections for confocal microscopy by using previously reported methods (30). Further details regarding these experiments are provided in Appendix E1 (online).
Results
Nanoparticle Characterization
Negative-stain TEM images (Fig 1c) showed Au-HDL to be composed of gold cores (dark spots) individually incorporated into coatings (light rims). The gold cores had a mean diameter of 3.1 nm ± 0.5 (standard deviation), and the mean overall diameter of the whole nanoparticle was 7.2 nm ± 0.7. Analysis of the protein, phosphorous, and gold content and the nanoparticle size data revealed that the phospholipid-to-gold ratio was very close to theoretic values and that there were, on average, 1.3 protein molecules per particle, matching the expected values for high-density lipoproteins of this size (31).
Figure 1c:

(a) Graph shows energy dependence of x-ray attenuation of water due to Compton scatter and photoelectric effect, as compared with attenuation of k-edge material (ie, gold). (b) Schematic illustration of macrophage-targeted gold core nanoparticle Au-HDL. HDL = high-density lipoprotein. (c) Characterization of Au-HDL on negative-stain transmission electron microscopy (TEM) image.
Spectral CT of Contrast Agent Solutions
To examine the ability to distinguish gold, iodine, and calcified tissue with spectral CT, we first constructed a phantom composed of a concentration series of Au-HDL, an iodinated contrast agent, and calcium phosphate powder to simulate calcium-rich tissue (Fig 2a). When the phantom was scanned with spectral CT, the energy bins were tuned to 25–34 keV, 34–51 keV, 51–80 keV, 80–91 keV, 91–110 keV, and 110–130 keV (Fig 2b). These images were adjusted so that the plastic of the phantom holder yielded a similar gray level on each energy bin image. The k edge of gold was 80.7 keV (32), which was clearly picked up on the images; the vials were brighter on the 80–91-keV bin image than on the 51–80-keV bin image. In the case of iodine, the k edge was 33.2 keV (32), which resulted in similar attenuation on the 25–34-keV and 34–51-keV bin images and a steady decline as the energy increased further. The attenuation in the calcium phosphate vial could be seen to decline very swiftly with increasing energy.
Figure 2a:

CT images of phantom containing various concentrations of Au-HDL, an iodinated contrast agent, and calcium phosphate powder, Ca3(PO4)2, to simulate calcium-rich tissue. (a) Labeled conventional CT image; (b) spectral CT energy bin images; and (c) gold, iodine, photoelectric, and Compton images derived from energy bins are shown.
Figure 2b:

CT images of phantom containing various concentrations of Au-HDL, an iodinated contrast agent, and calcium phosphate powder, Ca3(PO4)2, to simulate calcium-rich tissue. (a) Labeled conventional CT image; (b) spectral CT energy bin images; and (c) gold, iodine, photoelectric, and Compton images derived from energy bins are shown.
From the raw data of these energy bin images, we computed and reconstructed four images showing the attenuation due to gold, iodine, the photoelectric effect, and the Compton effect (20). Bone and calcium-rich matter were prominent on the photoelectric images owing to their high effective atomic number. Tissue attenuates largely via the Compton effect and appears primarily on the Compton effect images (Fig 2c). As seen on these images, the gold, iodine, and photoelectric images correctly depicted the locations where gold, iodine, and calcium were present, and the gold and iodine images had an increasing linear signal as the contrast agent concentration increased (Figs E1, E2 [online]). The plastic of the tube holder, the tubes, and the water from the solutions were picked up on the Compton image. There was some cross talk from the calcium phosphate signal onto the gold and iodine images; however, this is not expected to be problematic, because in any biologic setting, there would not be gold or iodine accumulation in the same region as calcium-rich tissue and the cross talk could be subtracted by comparison with the calcium image. There was also a small amount of cross talk from the highest concentrations of gold onto the iodine image, and vice versa. Similar results were obtained when we prepared a range of contrast agent concentrations in a ground meat matrix (Fig E3 [online]).
Figure 2c:

CT images of phantom containing various concentrations of Au-HDL, an iodinated contrast agent, and calcium phosphate powder, Ca3(PO4)2, to simulate calcium-rich tissue. (a) Labeled conventional CT image; (b) spectral CT energy bin images; and (c) gold, iodine, photoelectric, and Compton images derived from energy bins are shown.
To test the ability to determine the concentration of substances under confounding conditions with spectral CT, we constructed a phantom composed of mixtures of Au-HDL and iodinated contrast material. As seen in Figure E4, A (online), there was roughly the same attenuation in each tube on the conventional CT image. The gold, iodine, photoelectric, and Compton images are displayed in Figure E4, B (online), in which the ability to identify both the location and the relative concentrations of the contrast agents by using the spectral CT system is apparent. Even under these confounding conditions, use of the spectral CT system enabled calculations of the concentrations of gold and iodine with reasonable accuracy (Fig E4, C [online]).
Spectral CT of Atherosclerotic Artery Phantom
We constructed a phantom of an artery to provide further evidence that spectral CT can be used to distinguish gold, iodine, and calcified tissue (Fig 3a). Spectral CT could be used to correctly resolve the signals from the different materials in the field of view (Fig 3b, 3c) in this setting also.
Figure 3a:

Images of artery phantom. (a) Labeled CT image; (b) spectral CT images; and (c) overlay of gold, iodine, photoelectric, and Compton images are shown. Ca3(PO4)2 = calcium phosphate.
Figure 3b:

Images of artery phantom. (a) Labeled CT image; (b) spectral CT images; and (c) overlay of gold, iodine, photoelectric, and Compton images are shown. Ca3(PO4)2 = calcium phosphate.
Figure 3c:
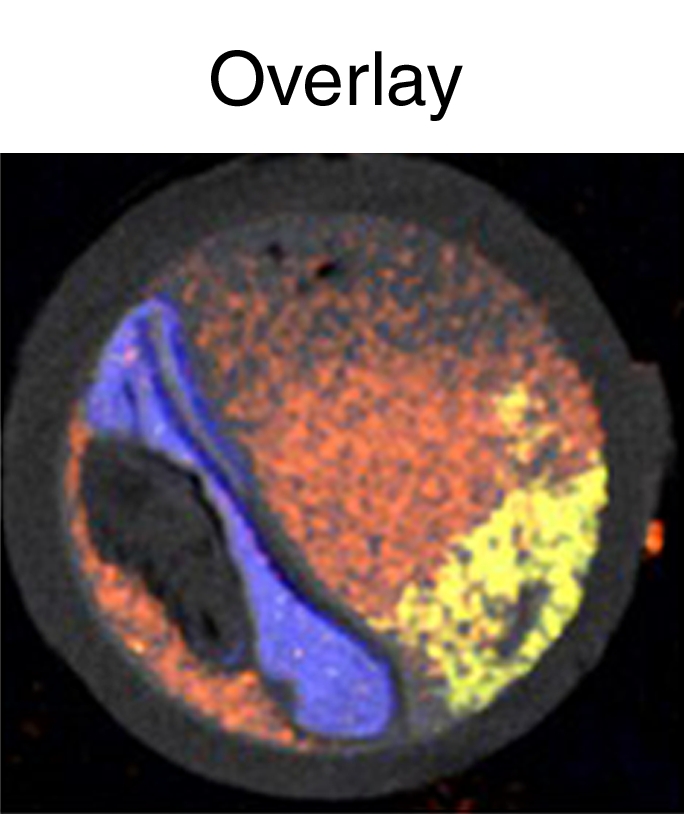
Images of artery phantom. (a) Labeled CT image; (b) spectral CT images; and (c) overlay of gold, iodine, photoelectric, and Compton images are shown. Ca3(PO4)2 = calcium phosphate.
Spectral CT of apo E–KO Mice
We used the apo E–KO mouse model of atherosclerosis to test the combination of spectral CT and Au-HDL for macrophage imaging in a biologic setting; Au-HDL has previously been shown to be macrophage specific (22). First, we injected two apo E–KO mice with Au-HDL; then we sacrificed and froze the mice 24 hours after injection, prior to scanning. The energy bin data were decomposed into gold, tissue, and calcium images. On the conventional CT images of the aorta in these mice, areas of high attenuation were observed in regions known to accumulate substantial atherosclerotic plaques (27), such as the arch, the region near the renal arteries, and the bifurcation (Fig 4, A). When the gold images were examined, it was clear that the high attenuation in the aortas was due to accumulation of Au-HDL in the arteries of these mice (Fig 4, B, C). In comparison, images in the wild-type mice injected with Au-HDL showed much lower attenuation in the aorta regions, with little signal on the gold images (Fig E5 [online]).
Figure 4:

A–C, Spectral CT images of thorax and abdomen in apo E–KO mouse injected 24 hours earlier with Au-HDL. D, E, Spectral CT images near bifurcation of aorta in apo E–KO mouse injected with Au-HDL and an iodinated emulsion contrast agent (Fenestra VC) for vascular imaging.
In an additional experiment, we injected three apo E–KO mice with Au-HDL and then 24 hours later with an iodinated emulsion contrast agent (Fenestra VC) for imaging of small animal vasculature. In this setting, the energy bin data were processed into gold, iodine, calcium, and tissue images. As seen in Figure 4, D, high attenuation was seen in the lumen of the aorta and in the plaque surrounding the aorta on the conventional CT images. Examination of the spectral images revealed that the high attenuation in the lumen was due to the iodinated contrast agent, whereas the high attenuation in the plaque was due to Au-HDL accumulation (Fig 4, E). Furthermore, the bones of the mice were clearly identified on the calcium images, with little cross talk with the gold and iodine images. With this experiment, we showed that it is possible to image gold- and iodine-based contrast agents, as well as calcified tissue, simultaneously by using spectral CT in a mouse. The online movies show all sections of the mouse depicted in Figure 4, D and E.
Au-HDL Localization in Aorta
The cellular localization of Au-HDL in the aorta was investigated by using TEM and confocal microscopy. On TEM images, we found Au-HDL to be largely localized in macrophages (Fig E6, A–C [online]), whereas areas of hypointensity in other cell types and regions of the plaque represented staining artifacts (Fig E6, D and E [online]).
We further investigated the cellular localization of Au-HDL in plaque by using confocal microscopy. Sections were stained with CD68 for macrophages, and nuclei were stained with 4,6-diamidino-2-phenylindole. Representative images are shown in Figure E6, F–I (online). As seen on these images, areas of nanoparticle accumulation (stained red) closely corresponded to areas that stained positive for macrophages (stained green), confirming the macrophage specificity of Au-HDL.
Discussion
In this study, we demonstrated that spectral CT enables multicolor imaging and can be used to accurately distinguish a gold-based contrast agent (Au-HDL) from an iodinated contrast agent, tissue, and calcium-rich matter on scans of phantoms in water or meat, an artery phantom, and apo E–KO mice in situ. Furthermore, the concentrations of the agents can be determined with good accuracy, even under confounding conditions such as mixtures of the gold- and iodine-based contrast agents. We also demonstrated the capability of the spectral CT system in the detection of Au-HDL that accumulated in the aortas of apo E–KO mice. The cells that these nanoparticles gathered in were macrophages, as determined by using TEM and confocal microscopy—a result that is in agreement with previous experiment findings (22). The spectral CT results, therefore, seem to reflect the macrophage content of the plaque, and they point to the possibility for CT molecular imaging of macrophage burden in arteries. As became clear from our investigations, iodinated contrast agents and calcified structures also can be simultaneously visualized. This method could offer the potential to simultaneously acquire information on stenosis, calcification, and inflammation—three valuable parameters of plaque characterization.
One of the drawbacks of many forms of molecular imaging, such as iron oxide– and gadolinium-enhanced MR imaging, is the requirement to perform preinjection imaging. The postinjection image is often acquired a long time (eg, 24–48 hours) later (33). This makes coregistering of the different images acquired challenging, and especially so when the area to be imaged comprises the coronary arteries—structures of constant movement. Spectral CT offers the ability to identify the locations of contrast agent accumulation during a single scanning examination, eliminating the need for preinjection scanning. On the other hand, fluorine 18 fluorodeoxyglucose (FDG) PET does not require a preinjection image because the contrast on the image is present only because of the injected contrast agent. However, FDG PET of the coronary arteries is challenging owing to the high uptake of FDG by the myocardium, which obscures the identification of the coronary arteries. Moreover, the temporal and spatial resolution of MR imaging and PET are poor for coronary artery imaging (7).
The scanning time of the described spectral CT system needs to be improved. One must bear in mind that state-of-the-art clinical scanners have multiple (ie, 64–320) detector rows (18), and the preclinical system used in this study has only one detector row, resulting in longer scanning times. Another crucial contributor to the scanning time duration, however, is the low x-ray flux under which the scanner can be operated because of the lower count-rate limit of the photon-counting detectors used, as compared with the count-rate limit of conventional CT detectors (20). Nevertheless, the lengthy scanning times can be overcome by using a number of methods or various combinations thereof—for example, detectors with higher count-rate capability (34,35), detectors with a smaller area (21), and vertically stacked detectors (36). Therefore, we anticipate that it eventually will be feasible to perform imaging with spectral CT systems at a speed comparable to that of current clinical systems.
The 500 mg/kg (2.53 mmol of gold per kilogram of body weight) dose of Au-HDL used is comparable to that used for commercially available iodinated contrast agents (370 mg/kg or 2.92 mmol of iodine per kilogram of body weight) (13). We chose a dose equivalent to the number of particles used in our previous MR imaging studies with high-density lipoprotein–based contrast agents (22,37). Nevertheless, we plan to perform dose-response studies to determine optimized dosing. From the current study results, it seems likely that the dose could be reduced by a factor of two to four. The sensitivity for contrast agent detection is clearly a limitation of CT, and it has been posited that molecular imaging would not be possible with use of CT (38). The results of this study and others (39–41) indicate, however, that molecular imaging with CT could be possible for certain processes. Owing to the relative insensitivity of CT for contrast material detection, the low densities of macrophages will likely not be detected. Inflamed and unstable plaques are rich in macrophages. Therefore, this insensitivity may be a beneficial feature, as there will be little signal from quiescent plaques. We plan to conduct studies with atherosclerotic rabbits to correlate inflammation burden with CT attenuation.
In summary, we have demonstrated the potential of the described spectral CT imaging system for differentiation of gold, iodine, and calcified material in atherosclerosis. The spectral CT imaging system, together with Au-HDL, can be used to detect macrophages in atherosclerosis while imaging the vasculature and calcified tissue at the same time. This finding points to preclinical and clinical applications in atherosclerosis, and the described spectral CT system potentially could be used with other types of contrast agents to probe other biologic processes and diseases.
Practical applications: In this study, we focused on gold- and iodine-based contrast agents. Others, however, have used gadolinium- (21) or bismuth-based contrast agents (42), and the use of contrast agents based on many other elements is theoretically possible with spectral CT. Moreover, settings other than arterial inflammation, such as arteries with stents (21), thrombus formation (42), and renal disease (43), may be probed by using spectral CT, and we anticipate further applications in cancer, cardiovascular disease, and bowel diseases.
Advances in Knowledge.
Multicolor CT can distinguish between the attenuation due to a gold nanoparticle contrast agent (Au-HDL), an iodine-based contrast agent, and calcium-rich material.
Multicolor CT can identify areas of Au-HDL accumulation in the arteries of atherosclerotic mice.
Au-HDL accumulation occurs primarily in the macrophages of atherosclerotic tissue and hence potentially represents areas of plaque that is vulnerable to rupture.
Implication for Patient Care.
Characterization and determination of the vulnerability of plaque in the coronary arteries may be possible with further development of the spectral CT imaging system.
Supplementary Material
Acknowledgments
We thank the American Heart Association Founder’s Affiliate Postdoctoral Fellowship and the Danish Heart Association for Studentship. We also thank CSL, Parkville, Australia, for the kind gift of apolipoprotein AI. We thank Pat Zanzonico, PhD, of Memorial Sloan-Kettering Cancer Center for advice on the use of Fenestra VC. In addition, we acknowledge the invaluable help and assistance of Heather Bell, BA, of the Mount Sinai Pathology EM core.
Received January 12, 2010; revision requested March 14; revision received April 3; accepted April 16; final version accepted April 21.
D.P.C. supported by the American Heart Association Founder’s Affiliate Postdoctoral Fellowship 09POST2220194. T.S. supported by the Danish Heart Association for Studentship 07-10-A1655-22406. Supported in part by National Institutes of Health grants R01 HL71021, R01 HL78667, R01 EB009638 (Z.A.F.), and R01 HL61814 (E.A.F.).
Funding: This research was supported by the National Institutes of Health (grants R01 HL71021, R01 HL78667, R01 EB009638, and R01 HL61814).
See Materials and Methods for pertinent disclosures.
See also Science to Practice in this issue.
Abbreviations:
- apo E–KO
- apolipoprotein E knockout
- Au-HDL
- gold high-density lipoprotein nanoparticle contrast agent
- TEM
- transmission electron microscopy
References
- 1.Naghavi M, Libby P, Falk E, et al. From vulnerable plaque to vulnerable patient: a call for new definitions and risk assessment strategies. I. Circulation 2003;108(14):1664–1672 [DOI] [PubMed] [Google Scholar]
- 2.Davies MJ, Thomas AC. Plaque fissuring: the cause of acute myocardial infarction, sudden ischaemic death, and crescendo angina. Br Heart J 1985;53(4):363–373 [DOI] [PMC free article] [PubMed] [Google Scholar]
- 3.Falk E. Why do plaques rupture? Circulation 1992;86(6 suppl):III30–III42 [PubMed] [Google Scholar]
- 4.Koenig W, Khuseyinova N. Biomarkers of atherosclerotic plaque instability and rupture. Arterioscler Thromb Vasc Biol 2007;27(1):15–26 [DOI] [PubMed] [Google Scholar]
- 5.Tang TY, Muller KH, Graves MJ, et al. Iron oxide particles for atheroma imaging. Arterioscler Thromb Vasc Biol 2009;29(7):1001–1008 [DOI] [PubMed] [Google Scholar]
- 6.Jaffer FA, Weissleder R. Seeing within: molecular imaging of the cardiovascular system. Circ Res 2004;94(4):433–445 [DOI] [PubMed] [Google Scholar]
- 7.Saraste A, Nekolla SG, Schwaiger M. Cardiovascular molecular imaging: an overview. Cardiovasc Res 2009;83(4):643–652 [DOI] [PubMed] [Google Scholar]
- 8.Sanz J, Fayad ZA. Imaging of atherosclerotic cardiovascular disease. Nature 2008;451(7181):953–957 [DOI] [PubMed] [Google Scholar]
- 9.Earls JP, Berman EL, Urban BA, et al. Prospectively gated transverse coronary CT angiography versus retrospectively gated helical technique: improved image quality and reduced radiation dose. Radiology 2008;246(3):742–753 [DOI] [PubMed] [Google Scholar]
- 10.Leber AW, Knez A, von Ziegler F, et al. Quantification of obstructive and nonobstructive coronary lesions by 64-slice computed tomography: a comparative study with quantitative coronary angiography and intravascular ultrasound. J Am Coll Cardiol 2005;46(1):147–154 [DOI] [PubMed] [Google Scholar]
- 11.Budoff MJ, Achenbach S, Blumenthal RS, et al. Assessment of coronary artery disease by cardiac computed tomography: a scientific statement from the American Heart Association Committee on Cardiovascular Imaging and Intervention, Council on Cardiovascular Radiology and Intervention, and Committee on Cardiac Imaging, Council on Clinical Cardiology. Circulation 2006;114(16):1761–1791 [DOI] [PubMed] [Google Scholar]
- 12.Rumberger JA. Coronary computed tomography angiography: our time has come, but there are miles to go before we sleep. J Am Coll Cardiol 2008;52(21):1733–1735 [DOI] [PubMed] [Google Scholar]
- 13.Budoff MJ, Dowe D, Jollis JG, et al. Diagnostic performance of 64-multidetector row coronary computed tomographic angiography for evaluation of coronary artery stenosis in individuals without known coronary artery disease: results from the prospective multicenter ACCURACY (Assessment by Coronary Computed Tomographic Angiography of Individuals Undergoing Invasive Coronary Angiography) Trial. J Am Coll Cardiol 2008;52(21):1724–1732 [DOI] [PubMed] [Google Scholar]
- 14.Greenland P, LaBree L, Azen SP, Doherty TM, Detrano RC. Coronary artery calcium score combined with Framingham score for risk prediction in asymptomatic individuals. JAMA 2004;291(2):210–215 [DOI] [PubMed] [Google Scholar]
- 15.Greenland P, Bonow RO, Brundage BH, et al. ACCF/AHA 2007 clinical expert consensus document on coronary artery calcium scoring by computed tomography in global cardiovascular risk assessment and in evaluation of patients with chest pain: a report of the American College of Cardiology Foundation Clinical Expert Consensus Task Force (ACCF/AHA Writing Committee to Update the 2000 Expert Consensus Document on Electron Beam Computed Tomography). Circulation 2007;115(3):402–426 [DOI] [PubMed] [Google Scholar]
- 16.Lumbroso P, Dick CE. X-ray attenuation properties of radiographic contrast media. Med Phys 1987;14(5):752–758 [DOI] [PubMed] [Google Scholar]
- 17.Hounsfield GN. Computerized transverse axial scanning (tomography). I. Description of system. Br J Radiol 1973;46(552):1016–1022 [DOI] [PubMed] [Google Scholar]
- 18.Schuleri KH, George RT, Lardo AC, Medscape Applications of cardiac multidetector CT beyond coronary angiography. Nat Rev Cardiol 2009;6(11):699–710 [DOI] [PubMed] [Google Scholar]
- 19.Roessl E, Proksa R. K-edge imaging in x-ray computed tomography using multi-bin photon counting detectors. Phys Med Biol 2007;52(15):4679–4696 [DOI] [PubMed] [Google Scholar]
- 20.Schlomka JP, Roessl E, Dorscheid R, et al. Experimental feasibility of multi-energy photon-counting k-edge imaging in pre-clinical computed tomography. Phys Med Biol 2008;53(15):4031–4047 [DOI] [PubMed] [Google Scholar]
- 21.Feuerlein S, Roessl E, Proksa R, et al. Multienergy photon-counting k-edge imaging: potential for improved luminal depiction in vascular imaging. Radiology 2008;249(3):1010–1016 [DOI] [PubMed] [Google Scholar]
- 22.Cormode DP, Skajaa T, van Schooneveld MM, et al. Nanocrystal core high-density lipoproteins: a multimodality contrast agent platform. Nano Lett 2008;8(11):3715–3723 [DOI] [PMC free article] [PubMed] [Google Scholar]
- 23.Rouser G, Fleischer S, Yamamoto A. Two dimensional thin layer chromatographic separation of polar lipids and determination of phospholipids by phosphorus analysis of spots. Lipids 1970;5(5):494–496 [DOI] [PubMed] [Google Scholar]
- 24.Markwell MA, Haas SM, Bieber LL, Tolbert NE. A modification of the Lowry procedure to simplify protein determination in membrane and lipoprotein samples. Anal Biochem 1978;87(1):206–210 [DOI] [PubMed] [Google Scholar]
- 25.Forte TM, Nordhausen RW. Electron microscopy of negatively stained lipoproteins. Methods Enzymol 1986;128:442–457 [DOI] [PubMed] [Google Scholar]
- 26.Alvarez RE, Macovski A. Energy-selective reconstructions in x-ray computerized tomography. Phys Med Biol 1976;21(5):733–744 [DOI] [PubMed] [Google Scholar]
- 27.Nakashima Y, Plump AS, Raines EW, Breslow JL, Ross R. ApoE-deficient mice develop lesions of all phases of atherosclerosis throughout the arterial tree. Arterioscler Thromb 1994;14(1):133–140 [DOI] [PubMed] [Google Scholar]
- 28.Wisner ER, Weichert JP, Longino MA, Counsell RE, Weisbrode SE. A surface-modified chylomicron remnant-like emulsion for percutaneous computed tomography lymphography: synthesis and preliminary imaging findings. Invest Radiol 2002;37(4):232–239 [DOI] [PubMed] [Google Scholar]
- 29.Horak D, Babic M, Jendelová P, et al. D-mannose-modified iron oxide nanoparticles for stem cell labeling. Bioconjug Chem 2007;18(3):635–644 [DOI] [PubMed] [Google Scholar]
- 30.Cormode DP, Briley-Saebo KC, Mulder WJ, et al. An apoA-I mimetic peptide high-density-lipoprotein-based MRI contrast agent for atherosclerotic plaque composition detection. Small 2008;4(9):1437–1444 [DOI] [PubMed] [Google Scholar]
- 31.Jonas A. Reconstitution of high-density lipoproteins. Methods Enzymol 1986;128:553–582 [DOI] [PubMed] [Google Scholar]
- 32.Yu SB, Watson AD. Metal-based x-ray contrast media. Chem Rev 1999;99(9):2353–2378 [DOI] [PubMed] [Google Scholar]
- 33.Ruehm SG, Corot C, Vogt P, Kolb S, Debatin JF. Magnetic resonance imaging of atherosclerotic plaque with ultrasmall superparamagnetic particles of iron oxide in hyperlipidemic rabbits. Circulation 2001;103(3):415–422 [DOI] [PubMed] [Google Scholar]
- 34.Dixon AR, Dynes JF, Yuan ZL, Sharpe AW, Bennett AJ, Shields AJ. Ultrashort dead time of photon-counting InGaAs avalanche photodiodes. Appl Phys Lett 2009;94:231113 [Google Scholar]
- 35.Barber WC, Nygard E, Iwanczyk JS, et al. Large area photon counting x-ray imaging arrays for clinical dual-energy applications. IEEE MIC Conference Record, Orlando, Fla, 2009 [Google Scholar]
- 36.Tkaczyk JE, Short JD, Rose JW, Wu X, Basu SK. Photon counting x-ray detector with overrange logic control. U.S. patent 7,613,274 November 3, 2009
- 37.Cormode DP, Chandrasekar R, Delshad A, et al. Comparison of synthetic high density lipoprotein (HDL) contrast agents for MR imaging of atherosclerosis. Bioconjug Chem 2009;20(5):937–943 [DOI] [PMC free article] [PubMed] [Google Scholar]
- 38.Weissleder R, Mahmood U. Molecular imaging. Radiology 2001;219(2):316–333 [DOI] [PubMed] [Google Scholar]
- 39.Hyafil F, Cornily JC, Feig JE, et al. Noninvasive detection of macrophages using a nanoparticulate contrast agent for computed tomography. Nat Med 2007;13(5):636–641 [DOI] [PubMed] [Google Scholar]
- 40.Popovtzer R, Agrawal A, Kotov NA, et al. Targeted gold nanoparticles enable molecular CT imaging of cancer. Nano Lett 2008;8(12):4593–4596 [DOI] [PMC free article] [PubMed] [Google Scholar]
- 41.Winter PM, Shukla HP, Caruthers SD, et al. Molecular imaging of human thrombus with computed tomography. Acad Radiol 2005;12(Suppl 1):S9–S13 [DOI] [PubMed] [Google Scholar]
- 42.Pan D, Proksa R, Caruthers SD, et al. Fibrin-specific spectral CT molecular imaging detects ruptured plaque without calcium interference [abstr]. Circulation 2008;118(suppl):S777 [Google Scholar]
- 43.Boll DT, Patil NA, Paulson EK, et al. Focal cystic high-attenuation lesions: characterization in renal phantom by using photon-counting spectral CT—improved differentiation of lesion composition. Radiology 2010;254(1):270–276 [DOI] [PubMed] [Google Scholar]
Associated Data
This section collects any data citations, data availability statements, or supplementary materials included in this article.