

The use of computer-aided detection results in a significant improvement in overall reader performance.
Abstract
Purpose:
To assess the effect of using computer-aided detection (CAD) in second-read mode on readers’ accuracy in interpreting computed tomographic (CT) colonographic images.
Materials and Methods:
The contributing institutions performed the examinations under approval of their local institutional review board, with waiver of informed consent, for this HIPAA-compliant study. A cohort of 100 colonoscopy-proved cases was used: In 52 patients with findings positive for polyps, 74 polyps of 6 mm or larger were observed in 65 colonic segments; in 48 patients with findings negative for polyps, no polyps were found. Nineteen blinded readers interpreted each case at two different times, with and without the assistance of a commercial CAD system. The effect of CAD was assessed in segment-level and patient-level receiver operating characteristic (ROC) curve analyses.
Results:
Thirteen (68%) of 19 readers demonstrated higher accuracy with CAD, as measured with the segment-level area under the ROC curve (AUC). The readers’ average segment-level AUC with CAD (0.758) was significantly greater (P = .015) than the average AUC in the unassisted read (0.737). Readers’ per-segment, per-patient, and per-polyp sensitivity for all polyps of 6 mm or larger was higher (P < .011, .007, .005, respectively) for readings with CAD compared with unassisted readings (0.517 versus 0.465, 0.521 versus 0.466, and 0.477 versus 0.422, respectively). Sensitivity for patients with at least one large polyp of 10 mm or larger was also higher (P < .047) with CAD than without (0.777 versus 0.743). Average reader sensitivity also improved with CAD by more than 0.08 for small adenomas. Use of CAD reduced specificity of readers by 0.025 (P = .05).
Conclusion:
Use of CAD resulted in a significant improvement in overall reader performance. CAD improves reader sensitivity when measured per segment, per patient, and per polyp for small polyps and adenomas and also reduces specificity by a small amount.
© RSNA, 2010
Supplemental material: http://radiology.rsna.org/lookup/suppl/doi:10.1148/radiol.10091890/-/DC1
Introduction
Computed tomographic (CT) colonography is gaining acceptance as a method to screen the colon and rectum for polyps and masses, but there is a substantial learning curve (1,2), and sensitivity remains variable (3). Computer-aided detection (CAD) has been proposed as a way to help readers (4–6)—particularly novice readers (7–9)—achieve a high sensitivity without unduly reducing specificity or adversely affecting reading time (7,10). Because many polyps readers are often visible in retrospect (11), CAD is expected to help readers improve sensitivity. In stand-alone studies (4–6), CAD has been shown to be sensitive for detection of polyps, but reader studies are critical to demonstrate the practical value of CAD because readers may accept or reject CAD marks, and there is a potential for sensitivity and specificity to improve or deteriorate. Multireader CAD trials, to date, have generally included either small patient cohorts or small numbers of readers, often addressing a specific narrow question (4,6,8,12–20) such as cost-effectiveness of CAD (21). Two trials have included low-prevalence cohorts (22) or large cohorts (10). Furthermore, different CAD systems function differently, and only limited extrapolation can be made among fundamentally different software programs. This study was performed to assess the effect of the use of CAD in the second-read mode on readers’ accuracy in interpreting CT colonographic images.
Materials and Methods
The contributing institutions performed the examinations under approval of their local institutional review board and contributed cases with identification removed that were in compliance with Health Insurance Portability and Accountability Act guidelines. This study was conducted under an institutional review board waiver from an independent institutional review board (Sterling IRB, Atlanta, Ga). Three investigators (J.W.H., R.L.V.U., S.P.) are employees of the trial’s sponsor, iCAD (Nashua, NH), and one of these investigators (J.W.H.) is a stockholder in iCAD. The principal investigator (A.H.D.) and the statistician (N.A.O.) were paid consultants for this trial but were not members of the board or stockholders. Authors who are not employees of or consultants for iCAD had control of inclusion of any data and information that might present a conflict of interest for those authors who are employees of or consultants for iCAD. Coinvestigators whose interpretation defined the reference standard (A.H.D., J.L.H., M.I.F., and T.C.W.) are not employees of or consultants for iCAD but were paid for their work. One investigator (B.J.H.) who is the chief scientific officer of ACR Image Metrix (Philadelphia, Pa), the company which helped the investigators conduct the trial under contract to iCAD and collected the data, participated in the planning of the study. One author (J.L.H.) was reimbursed by iCAD for his time and effort acting as a truther for this study. One author (R.M.S.) has pending and/or awarded patents for the subject matter described in the manuscript and receives royalty income for a patent license from iCAD; his laboratory is supported in part by a Cooperative Research and Development Agreement with iCAD and has received software (V3D-Colon; Viatronix, Stony Brook, NY) from the manufacturer free of charge.
Methods for testing the CAD software stand-alone performance (VeraLook, revision 1.0; iCAD) and the detailed process for visual verification of the CAD marks are described in Appendix E1 (online).
Case Selection
The cases selected for the multireader, multicase study were obtained from a publicly available database. The database contained cases with patient written informed consents and were originally accrued during the study described by Pickhardt et al (23). The subset of cases originally collected from the Naval Medical Center San Diego in San Diego, Calif, and Walter Reed Army Medical Center in Washington, DC, were made available publicly at https://imaging.nci.nih.gov/ncia/. Cases for the stand-alone study comprised a separate cohort of 355 cases, which were supplemented with cases previously collected by Pickhardt et al (23) as part of a screening program. Further case selection details are found in Appendix E1 (online).
Sex and age were not available in the contributing site records for five patients. Of the final 100 patients, 95 patients had an average age of 57.9 years (range, 46–74 years). Fifty-six patients were men (average age, 57 years; range, 46–70 years) and 39 were women (average age, 58 years; range, 50–74 years). Screening CT colonography was indicated for all 100 patients. No patient had rectal bleeding, had a history of polyps, had inflammatory bowel disease, had undergone prior colon surgery, or had a family or personal history of colorectal carcinoma. All patients had undergone CT colonography, with saline cathartic bowel preparation, oral administration of contrast medium for fluid and stool tagging, rectal insufflation with room air, and no administration of spasmolytic agents.
Reference Standard and Case Selection
The development of the reference standard for the stand-alone and multireader, multicase evaluations are described in detail in Appendix E1 (online) and are summarized here. A pool of five radiologists, including four authors (A.H.D., J.L.H., M.I.F., T.C.W.) and one nonauthor, each with experience that consisted of more than 500 cases and each of whom was involved in either CT colonography research and/or education, finalized the classification of each patient as a patient with positive findings, a patient with negative findings, or a patient who was excluded from the study. For patients with polyps of 6 mm or larger, these radiologists established the reference standard for the localization of polyps, categorization of morphology, and the largest linear dimension of the polyp on CT colonographic images by using the CT Colonography Reporting and Data System (C-RADS) categorization (24). A total of 122 cases (64 with positive findings, 58 with negative findings) underwent initial independent review.
For cases with positive findings at CT colonography, radiologists performed a directed search for polyps. Only polyps visible at CT colonography in retrospect were considered. This approach was designed to differentiate the performance of CAD from that of the CT colonographic examination.
For CT colonographic examinations that were found to have negative findings by the contributing site, images were reread in their entirety. For polyps found only at CT colonography by the contributing sites, optical colonoscopy was considered the reference standard for absence of a polyp. On the basis of the results of the pilot study of Petrick et al (10) involving 60 patients (31 without polyps and 29 with polyps) and four readers, the number of readers and patients needed for the current study was estimated to achieve at least 80% power to detect a difference in area under the receiver operating characteristic (ROC) curve (AUC) of 0.04. A study design was chosen with 19 readers and 100 cases (25). A stratified random sample was performed of patients with positive findings with at least one large polyp (≥10 mm), patients with positive findings with only small polyps (6–9 mm), and patients with negative findings. Thirty cases were randomly sampled from the small-polyp stratum; 20 cases, from the large-polyp stratum; and 50 cases, from the negative-finding stratum. The ratio of 3:2 for the small polyps–large polyps ratio was chosen to reflect the ratio in screening populations in the literature, without consideration to polyp morphology. The final sample consisted of 52 patients with positive findings—35 patients with polyps of 6 mm or larger and no polyps of 10 mm or larger and 17 patients with polyps of 10 mm or larger (four patients with one polyp and one patient with two synchronous 6–9-mm polyps)—and 48 patients with negative findings. The polyps ranged in size from 6 to 20 mm. Among the 52 patients with polyps, there were a total of 74 polyps in 65 colonic segments. Fifty-three polyps were sessile; 13 polyps, pedunculated; and eight polyps, flat. There were 36 patients with adenomatous polyps, with 47 adenomatous polyps in 44 colonic segments. Thirty-two of the adenomatous polyps were small (6–9 mm) and 15 were large (≥10 mm).
Readers and Reading Procedures
The recruitment and experience level of the readers is detailed in Appendix E1 (online). Of the19 board-certified radiologists, 11 were from academic environments, whereas eight were from community practices. The 19 readers had an average of 5 years of experience (range, 1–10 years). Each reader performed 200 readings in total, including cases with positive and negative findings that had an enriched proportion of cases with positive findings. The readings were performed with a system (V3D-Colon; Viatronix) equipped with a commercial CAD software system (VeraLook, 1.0; iCAD). Readers’ assisted and unassisted reads of the images from the same case were separated by 27–58 days between reads to minimize recall bias. Each reader performed 200 total readings, with 100 readings in the first session (50 without CAD, 50 with CAD) and 100 readings in the second session (50 with CAD, 50 without CAD). Each reader read images from each case twice, once without CAD and once with CAD. The mode of reading and the cases with images read in each mode were randomized in blocks of 50 cases. No case was viewed twice in a session.
Case reading order and mode (without CAD vs with CAD) were randomized and specified for each reader at the beginning of each reading session. Readers were blinded to the case type (with positive or negative findings) and numbers of patients with positive and negative findings included in the study but were instructed that the case set contained a higher proportion of patients with polyps than was usually found in clinical practice. No reading time limit was imposed, but readers were expected to read images from about 20 cases per full day, so there was some time pressure to complete reads in a reasonable amount of time (eg, 20 minutes), as there would be in clinical practice. Readers interpreted images from cases by using the method that they typically use in clinical practice (ie, primary two-dimensional [2D] read with three-dimensional [3D] problem solving or primary 3D read with 2D problem solving, but without electronic cleansing).
Each reader recorded polyp morphology, size, segment, and noted the location for each polyp of 6 mm or larger that was detected. The readers then provided a rating of suspicion for an actionable polyp or mass with a 100-point confidence scale for each polyp or mass detected and a C-RADS score (24) for the case. In the unassisted session, the readers recorded their findings for each case. In the CAD-assisted reading session, the readers were asked to record their findings before turning the CAD marks on and then to record any additional findings after turning on the CAD marks. Readers also noted their start and end times for each case read.
Statistical Methods
The primary objective was to measure the mean change in the readers’ AUC from the AUC for reading without CAD to the AUC for reading with CAD. For the primary analysis, the colon was divided into six segments (24), and these segments were the unit of analysis for constructing the ROC curves. The readings without CAD were the unassisted sessions. Sensitivity was defined as the correct detection and localization of at least one polyp in a segment of colon with one or more polyps. Specificity was defined as the correct identification of a colonic segment as having no polyps for those colonic segments without polyps. Nonparametric methods (26) were used to estimate the ROC curves and their AUCs for each reader. For each reader, the AUCs with and without CAD were compared by using a two-tailed Wald test, adjusted for the clustered data (27). The null hypothesis that the readers’ average AUC with CAD is equal to the average AUC without CAD was tested by using methods for multireader, multicase ROC studies (28–30) (two-tailed test with significance level of .05); a 95% confidence interval (CI) was constructed for the difference in readers’ average AUCs.
Several secondary analyses were performed. The readers’ average AUCs with and without CAD were compared by using the patient as the unit of analysis. Sensitivity was defined as correct detection and localization of at least one polyp in a patient with one or more polyps. In a patient with multiple polyps, the reader’s highest confidence score assigned to a polyp was used. Specificity was defined as the correct identification of a patient as having no polyps in a patient without polyps. The highest score assigned to any false-positive findings was used to estimate specificity. Multireader, multicase ROC methods were used (29).
The readers’ sensitivities and specificities were estimated by using confidence scores of 51 or higher as being for a positive finding and scores lower than 51 as being for a negative finding; the readers were aware of this cutoff point. For each reader, sensitivity and specificity were calculated with and without CAD at the polyp, colonic segment, and patient levels. McNemar tests (for patient-level estimates), or a modification of McNemar tests for clustered data (31) (for polyp- and segment-level estimates), were used to compare each reader’s accuracy with and without CAD. The readers’ average accuracies without and with CAD were compared by using analyses as described above.
The readers’ average number of false-positive findings per case was estimated by using the cutoff point of 51 or higher and lower than 51 in their expressed confidence that one or more polyps were present. A Wilcoxon signed rank test was used to compare the number of false-positive findings for readings with and without CAD. The 95% bootstrap CIs were constructed for the difference in readers’ mean number of cases with false-positive findings for readings without and with CAD.
C-RADS scores for readings without and with CAD were also compared as a means of assessing the effect of the use of CAD on patient treatment. Cases with negative findings were classified as C-RADS 1 at reference standard evaluation, whereas cases with positive findings were classified as C-RADS 2 or 3 (no cases were classified as C-RADS 4). Reader assessments with true- and false-positive findings, as well as assessments with true- and false-negative findings, were compared for assisted and unassisted reads for cases with positive and negative findings separately.
All analyses were performed with software (SAS 9.2; SAS Institute, Cary, NC) or with a general-purpose, procedural, imperative programming language (FORTRAN; IBM, San Jose, Calif).
Results
Change in AUC
The average segment-level AUC for the read with CAD was 0.758 (standard error = 0.029) and was significantly greater than the average AUC for the unassisted read, which was 0.737 (standard error = 0.029), with the estimated difference of 0.021 (P = .015). The 95% CI for the improvement in AUC for the read with CAD was 0.004 to 0.039. Thirteen (68%) of 19 readers had an increase in the AUC when the segment was used as the unit of analysis. Three readers’ AUCs were significantly higher for a read with CAD than for an unassisted read.
There was also improvement in the AUC when the patient was used as the unit of analysis, but the magnitude of improvement was not significant: AUC of 0.727 (standard error = 0.0304) with CAD versus AUC of 0.711 (standard error = 0.0297) without CAD (P = .071; 95% CI: −0.002, 0.034). Similar to the segment-level AUC, 13 (68%) of 19 readers also showed improvement in the AUC on the patient level, but none of these differences reached significance (Fig 1).
Figure 1a:

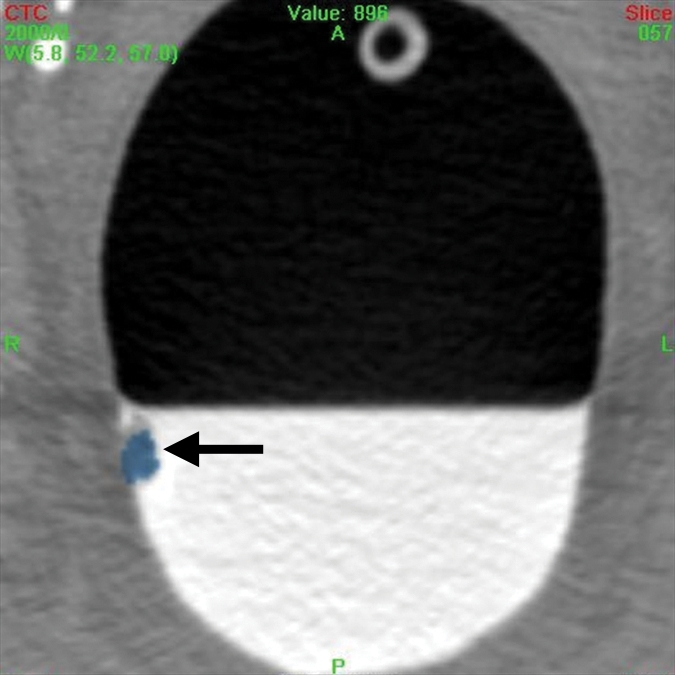
A 12-mm polyp (arrow) located in the rectum in 71-year-old woman and found with CAD and by nearly all readers at unassisted and CAD-assisted reads. (a) Prone axial image with CAD off shows polyp as a soft-tissue lesion on right rectal wall coated with oral contrast material. (b) Same axial 2D image with CAD on shows mark (blue), painting with a yellow circle. (c) Corresponding 3D image with CAD on shows polyp painted blue. (d) Supine axial 2D image shows polyp submerged in well-tagged residual fluid with CAD off and (e) same image with CAD on. Note that residual tagged fluid does not prevent CAD from detecting the polyp.
Figure 1b:

A 12-mm polyp (arrow) located in the rectum in 71-year-old woman and found with CAD and by nearly all readers at unassisted and CAD-assisted reads. (a) Prone axial image with CAD off shows polyp as a soft-tissue lesion on right rectal wall coated with oral contrast material. (b) Same axial 2D image with CAD on shows mark (blue), painting with a yellow circle. (c) Corresponding 3D image with CAD on shows polyp painted blue. (d) Supine axial 2D image shows polyp submerged in well-tagged residual fluid with CAD off and (e) same image with CAD on. Note that residual tagged fluid does not prevent CAD from detecting the polyp.
Figure 1c:

A 12-mm polyp (arrow) located in the rectum in 71-year-old woman and found with CAD and by nearly all readers at unassisted and CAD-assisted reads. (a) Prone axial image with CAD off shows polyp as a soft-tissue lesion on right rectal wall coated with oral contrast material. (b) Same axial 2D image with CAD on shows mark (blue), painting with a yellow circle. (c) Corresponding 3D image with CAD on shows polyp painted blue. (d) Supine axial 2D image shows polyp submerged in well-tagged residual fluid with CAD off and (e) same image with CAD on. Note that residual tagged fluid does not prevent CAD from detecting the polyp.
Figure 1d:

A 12-mm polyp (arrow) located in the rectum in 71-year-old woman and found with CAD and by nearly all readers at unassisted and CAD-assisted reads. (a) Prone axial image with CAD off shows polyp as a soft-tissue lesion on right rectal wall coated with oral contrast material. (b) Same axial 2D image with CAD on shows mark (blue), painting with a yellow circle. (c) Corresponding 3D image with CAD on shows polyp painted blue. (d) Supine axial 2D image shows polyp submerged in well-tagged residual fluid with CAD off and (e) same image with CAD on. Note that residual tagged fluid does not prevent CAD from detecting the polyp.
Figure 1e:
A 12-mm polyp (arrow) located in the rectum in 71-year-old woman and found with CAD and by nearly all readers at unassisted and CAD-assisted reads. (a) Prone axial image with CAD off shows polyp as a soft-tissue lesion on right rectal wall coated with oral contrast material. (b) Same axial 2D image with CAD on shows mark (blue), painting with a yellow circle. (c) Corresponding 3D image with CAD on shows polyp painted blue. (d) Supine axial 2D image shows polyp submerged in well-tagged residual fluid with CAD off and (e) same image with CAD on. Note that residual tagged fluid does not prevent CAD from detecting the polyp.
Improvement in Sensitivity
The sensitivity of the average reader also improved with the use of CAD when measured at the segment, patient, or polyp level and when considering subcategories of large (≥10 mm), small (6–9 mm), and adenomatous polyps (Fig 2; Figs E4, E5 [online]). Improvement in sensitivity for the average reader was significant for all analyses and all categories considered except for analysis according to large polyps and according to large adenomas (Table).
Figure 2a:

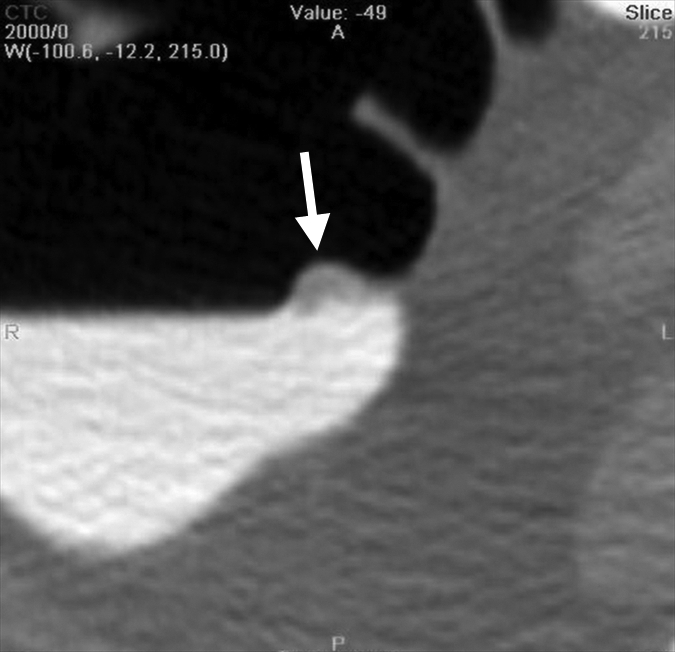
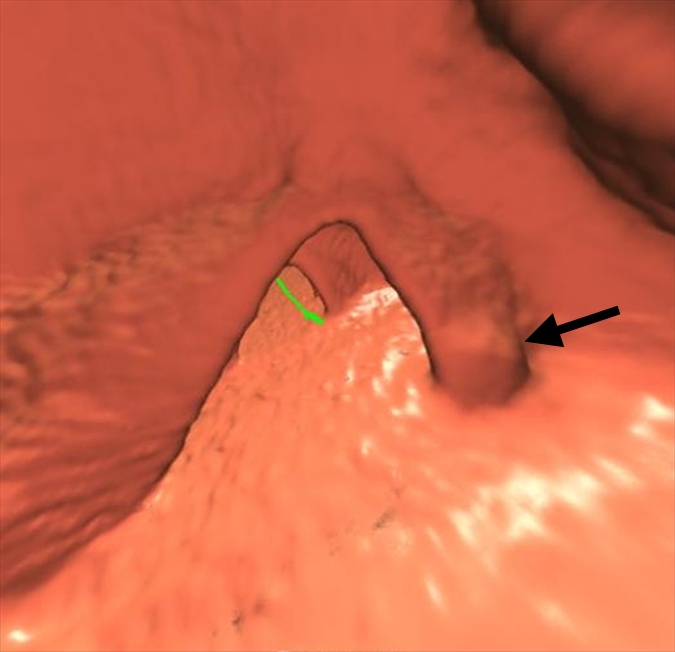
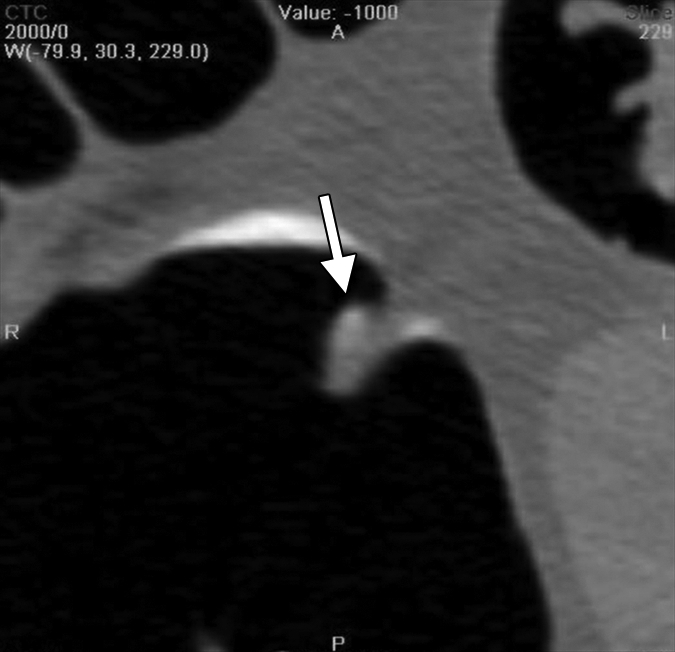
An 8-mm polyp (arrow) located in the ascending colon was visible only on supine 3D fly-through image (at 120° viewing angle) and only in antegrade direction in 65-year-old woman. The polyp was missed by all readers and with CAD. (a–d) Contiguous axial 2D images show polyp abutting a fold and partially submerged in tagged fluid; on the cut above (not shown), polyp abutted a normal fold. (e) Corresponding supine 3D retrograde endoluminal view shows the polyp located on the proximal side of a fold, explaining why it could not be seen on the retrograde view (ie, rectum to cecum, fly-through). Green line = computer-generated center line. (f, g) Prone axial 2D images in CT colonographic settings of (f) window width of 2000 HU and window level of 0 HU and (g) window width of 600 HU and window level of 0 HU show polyp with some tagging on the surface, making it easy to confuse for stool. (h) Prone view with the perspective optimized manually to show the polyp (arrows).
Improvement in Sensitivity with CAD

Small polyps are larger than 6 mm but smaller than 10 mm. Large polyps are larger than 10 mm. There were 52 patients with polyps (74 polyps in 65 colonic segments). There were 36 patients who had a total of 47 adenomatous polyps in 44 colonic segments. Thirty-two of the adenomatous polyps were small and 15 were large.
Numbers in parentheses were used to calculate the sensitivity.
Figure 2b:
An 8-mm polyp (arrow) located in the ascending colon was visible only on supine 3D fly-through image (at 120° viewing angle) and only in antegrade direction in 65-year-old woman. The polyp was missed by all readers and with CAD. (a–d) Contiguous axial 2D images show polyp abutting a fold and partially submerged in tagged fluid; on the cut above (not shown), polyp abutted a normal fold. (e) Corresponding supine 3D retrograde endoluminal view shows the polyp located on the proximal side of a fold, explaining why it could not be seen on the retrograde view (ie, rectum to cecum, fly-through). Green line = computer-generated center line. (f, g) Prone axial 2D images in CT colonographic settings of (f) window width of 2000 HU and window level of 0 HU and (g) window width of 600 HU and window level of 0 HU show polyp with some tagging on the surface, making it easy to confuse for stool. (h) Prone view with the perspective optimized manually to show the polyp (arrows).
Figure 2c:

An 8-mm polyp (arrow) located in the ascending colon was visible only on supine 3D fly-through image (at 120° viewing angle) and only in antegrade direction in 65-year-old woman. The polyp was missed by all readers and with CAD. (a–d) Contiguous axial 2D images show polyp abutting a fold and partially submerged in tagged fluid; on the cut above (not shown), polyp abutted a normal fold. (e) Corresponding supine 3D retrograde endoluminal view shows the polyp located on the proximal side of a fold, explaining why it could not be seen on the retrograde view (ie, rectum to cecum, fly-through). Green line = computer-generated center line. (f, g) Prone axial 2D images in CT colonographic settings of (f) window width of 2000 HU and window level of 0 HU and (g) window width of 600 HU and window level of 0 HU show polyp with some tagging on the surface, making it easy to confuse for stool. (h) Prone view with the perspective optimized manually to show the polyp (arrows).
Figure 2d:

An 8-mm polyp (arrow) located in the ascending colon was visible only on supine 3D fly-through image (at 120° viewing angle) and only in antegrade direction in 65-year-old woman. The polyp was missed by all readers and with CAD. (a–d) Contiguous axial 2D images show polyp abutting a fold and partially submerged in tagged fluid; on the cut above (not shown), polyp abutted a normal fold. (e) Corresponding supine 3D retrograde endoluminal view shows the polyp located on the proximal side of a fold, explaining why it could not be seen on the retrograde view (ie, rectum to cecum, fly-through). Green line = computer-generated center line. (f, g) Prone axial 2D images in CT colonographic settings of (f) window width of 2000 HU and window level of 0 HU and (g) window width of 600 HU and window level of 0 HU show polyp with some tagging on the surface, making it easy to confuse for stool. (h) Prone view with the perspective optimized manually to show the polyp (arrows).
Figure 2e:
An 8-mm polyp (arrow) located in the ascending colon was visible only on supine 3D fly-through image (at 120° viewing angle) and only in antegrade direction in 65-year-old woman. The polyp was missed by all readers and with CAD. (a–d) Contiguous axial 2D images show polyp abutting a fold and partially submerged in tagged fluid; on the cut above (not shown), polyp abutted a normal fold. (e) Corresponding supine 3D retrograde endoluminal view shows the polyp located on the proximal side of a fold, explaining why it could not be seen on the retrograde view (ie, rectum to cecum, fly-through). Green line = computer-generated center line. (f, g) Prone axial 2D images in CT colonographic settings of (f) window width of 2000 HU and window level of 0 HU and (g) window width of 600 HU and window level of 0 HU show polyp with some tagging on the surface, making it easy to confuse for stool. (h) Prone view with the perspective optimized manually to show the polyp (arrows).
Figure 2f:
An 8-mm polyp (arrow) located in the ascending colon was visible only on supine 3D fly-through image (at 120° viewing angle) and only in antegrade direction in 65-year-old woman. The polyp was missed by all readers and with CAD. (a–d) Contiguous axial 2D images show polyp abutting a fold and partially submerged in tagged fluid; on the cut above (not shown), polyp abutted a normal fold. (e) Corresponding supine 3D retrograde endoluminal view shows the polyp located on the proximal side of a fold, explaining why it could not be seen on the retrograde view (ie, rectum to cecum, fly-through). Green line = computer-generated center line. (f, g) Prone axial 2D images in CT colonographic settings of (f) window width of 2000 HU and window level of 0 HU and (g) window width of 600 HU and window level of 0 HU show polyp with some tagging on the surface, making it easy to confuse for stool. (h) Prone view with the perspective optimized manually to show the polyp (arrows).
Figure 2g:

An 8-mm polyp (arrow) located in the ascending colon was visible only on supine 3D fly-through image (at 120° viewing angle) and only in antegrade direction in 65-year-old woman. The polyp was missed by all readers and with CAD. (a–d) Contiguous axial 2D images show polyp abutting a fold and partially submerged in tagged fluid; on the cut above (not shown), polyp abutted a normal fold. (e) Corresponding supine 3D retrograde endoluminal view shows the polyp located on the proximal side of a fold, explaining why it could not be seen on the retrograde view (ie, rectum to cecum, fly-through). Green line = computer-generated center line. (f, g) Prone axial 2D images in CT colonographic settings of (f) window width of 2000 HU and window level of 0 HU and (g) window width of 600 HU and window level of 0 HU show polyp with some tagging on the surface, making it easy to confuse for stool. (h) Prone view with the perspective optimized manually to show the polyp (arrows).
Figure 2h:

An 8-mm polyp (arrow) located in the ascending colon was visible only on supine 3D fly-through image (at 120° viewing angle) and only in antegrade direction in 65-year-old woman. The polyp was missed by all readers and with CAD. (a–d) Contiguous axial 2D images show polyp abutting a fold and partially submerged in tagged fluid; on the cut above (not shown), polyp abutted a normal fold. (e) Corresponding supine 3D retrograde endoluminal view shows the polyp located on the proximal side of a fold, explaining why it could not be seen on the retrograde view (ie, rectum to cecum, fly-through). Green line = computer-generated center line. (f, g) Prone axial 2D images in CT colonographic settings of (f) window width of 2000 HU and window level of 0 HU and (g) window width of 600 HU and window level of 0 HU show polyp with some tagging on the surface, making it easy to confuse for stool. (h) Prone view with the perspective optimized manually to show the polyp (arrows).
Fifteen of 19 readers showed improvement in sensitivity for detection of adenomas, with improvement as high as 0.21 (Appendix E1, Table E7 [online]). Use of the system was associated with a larger increase in sensitivity for smaller adenomas, with 14 (74%) of 19 readers showing improvement in sensitivity. Trends toward improved detection were also observed for larger adenomas, with eight (42%) of 19 readers showing improvement in detection of larger adenomas; however, this difference did not reach significance.
Effect on Specificity
The average specificity for readers decreased slightly with the use of the CAD system. With the use of the segment as the unit of analysis, specificity decreased by 0.009 from 0.984 (standard error = 0.004) without CAD to 0.975 (standard error = 0.004; 95% CI: 0.004, 0.014) with CAD (P = .001). Reader specificity with the use of the patient as the unit of analysis decreased by 0.025 (2.7%) from 0.929 (standard error = 0.0197; 95% CI: −0.0002, 0.051) without CAD to 0.904 (standard error = 0.0222) with CAD (P = .05).
The number of false-positive findings increased when readers used CAD. For patients without polyps, the average number of false-positive findings per patient was 0.083 without CAD and 0.118 with CAD. The 95% bootstrap CI for the increase in the number of false-positive findings per patient was −0.014 to 0.090. For patients with polyps, the average number of false-positive findings per patient was 0.155 without CAD and 0.263 with CAD. The 95% bootstrap CI for the increase in the number of false-positive findings per patient was 0.044 to 0.194.
Reader Experience and Interpretation Times
There was a trend toward better reader sensitivity for small adenomas versus number of active cases with images being read per year (R 2 = 0.2054) and for all adenomas (R 2 = 0.01386) (Fig E6 [online]). The average readers’ interpretation time increased by 4.5 minutes with CAD. The readers’ estimated mean interpretation time without CAD was 18.8 minutes (95% CI: 16.4, 21.1). The readers’ estimated mean interpretation time with CAD was 23.3 minutes (95% CI: 20.3, 26.5). The 95% CI was 1.93 to 7.24 for the difference in mean interpretation time with CAD versus without CAD.
Effect on Patient Treatment
In 78.1% (40.6 of 52) of patients with polyps (cases with positive findings), patient treatment was the same (either true-positive or false-negative assessments) for both assisted and unassisted readers. Reader assessment changed from false-negative to true-positive in 14.1% (7.3 of 52) (95% CI: 10.0%, 18.7%) of patients and from true-positive to false-negative in 7.9% (4.1 of 52) (95% CI: 4.9%, 11.9%) of patients with use of CAD. The estimated net gain in true-positive assessment was 6.2%. The 95% CI for the net gain was 0.4% to 12.0%. In 83.8% (40.2 of 48) of patients without polyps (cases with negative findings), patient treatment was the same (cases with either true-negative or false-positive assessments) regardless of the use of CAD. Reader assessment changed from false-positive to true-negative in 6.3% (3.0 of 48) (95% CI: 3.3%, 9.5%) of patients and from true-negative to false-positive in 10.0% (4.8 of 48) (95% CI: 5.4%, 15.1%) of patients with the use of CAD. The net effect was an increase of 3.7% in false-positive assessments. The 95% CI was −1.2% to 8.8% for the net increase.
Discussion
In our study, we investigated the capability of CAD to help radiologists detect polyps 6 mm or larger or 10 mm or larger in size at CT colonography, because polyps, and specifically adenomas, of those sizes have been accepted as the key metrics in the evaluation of effectiveness of CT colonography as a tool to screen for colorectal cancer (10,23,32). The improved reader sensitivity of 0.055 (11.8%) for patients with both small and large polyps and of greater than 0.08 for small adenomas when using CAD are favorable when compared with results in prior studies. There is no single standard metric for comparing results in clinical CAD trials, which is why it is important to present the results by using several different metrics. There are results of remarkably few similar studies about the use of CAD with which to compare our results, partly because most clinical studies about CAD included much smaller cohorts of patients and readers and methods that focused on a specific question, such as CAD reading mode, CAD for training (12,32), or use in different or special viewing methods (3–10,12–22,33). The largest prior multireader, multicase reader CAD trial in a screening cohort, that of Petrick et al (10), was conducted by using a subset of 60 patients in which four readers used CAD in a second-reader mode and analyzed only neoplastic polyps (not all polyps). A significant improvement with CAD was found for the sensitivity of polyps in the 6-mm or larger and 6–9-mm groups (in which use of CAD increased sensitivity by 0.15 and 0.16, respectively), with a corresponding decrease in specificity of 0.14. For the 10-mm or larger group, the changes with CAD and AUC analysis did not achieve significance. Our results showed significant improvement in several more parameters as compared with results of Petrick et al (10) and as compared with data of other investigators, because we found readers’ per-segment, per-patient, and per-polyp sensitivity for all polyps of 6 mm or larger was higher for readings with CAD compared with unassisted reading (0.517 vs 0.465, 0.521 vs 0.466, and 0.477 vs 0.422, respectively). Important differences in the study designs when comparing our multireader, multicase study with the study of Petrick et al (10) include the large size of the cohort (100 cases), the large number of readers (19 observers) including nonexperts, the inclusion of nonneoplastic polyps in the cohort, nonexclusion of cases known to also contain polyps smaller than 6 mm in size, and the use of both primary 3D and primary 2D reading methods. When one reads CT colonographic images, the histologic features of a polyp are not known a priori, and, thus, statistical analyses that include both all-polyp histologic features and a separate analysis of the target lesion of colorectal cancer screening, neoplasia (namely, the adenoma and adenocarcinoma), are a reasonable study design when testing a CAD system.
Taylor et al (34) evaluated 10 radiologists who read 25 data sets containing 69 polyps in three reading modes: unassisted, CAD second-read mode, and CAD concurrent-read mode. They reported their key metric as an odds ratio of 1.5 for detection of polyps of 6 mm or larger when they used CAD in either mode and mean AUCs for each of the three respective reading modes of 0.83, 0.86, and 0.88, respectively, and per-polyp sensitivity was 0.77, 0.83, and 0.81, respectively (34). The five experienced readers had higher per-polyp sensitivities and higher false-positive rates than did the five inexperienced readers, but all readers had higher sensitivities with CAD, and the per-patient sensitivities were not reported. Although the baseline sensitivity for the unassisted read was higher in that trial compared with that in ours, the improvement with CAD in our study is comparable or better (eg, when we compared the data with our average 0.84 increase in sensitivity for 6–9-mm adenomas, because no exact metrics are reported identically).
In attempting to compare our study to prior studies, it is important to understand our choice of key study metrics. Although several metrics were provided to help make such comparisons, the primary unit of analysis in this study was the colonic segment. We chose the colonic segment as our primary unit of analysis for both clinical and statistical reasons. Clinically, it is important to maximize the detection of synchronous polyps in patients with multiple polyps. Although patients usually undergo optical colonoscopy after detection of polyps at CT colonography, optical colonoscopy has a miss rate of 6% and, on the basis of CT colonography trials, a miss rate as high as 12% for 10-mm or larger polyps (35). Furthermore, optical colonoscopy readers can miss polyps when they are focusing on searching for a preidentified polyp. A patient-level analysis does not measure the readers’ ability to detect multiple polyps, whereas the segment-level analysis does. Statistical arguments for the segment-level analysis include the idea that the readers’ sensitivity is overestimated with a patient-level analysis because the reader is required to detect and correctly locate only one polyp in a patient with multiple polyps in order for the case to be considered one with a true-positive finding. Second, the readers’ false-positive rate is attenuated in the patient-level analysis because if a reader identifies a false-positive finding in one reading mode and identifies additional false-positive findings with a second reading mode, no difference in the false-positive finding is recorded. Third, the segment-level analysis is more powerful than the patient-level analysis because the same patient contributes multiple findings (ie, six segments), which can be used in estimating specificity, sensitivity, or both. As long as the correlation between segments in the same patient is accounted for properly, the segment-level analysis has greater power than the patient-level analysis.
To compare with other non-CAD trials, the single most important metric is the per-patient sensitivity for adenomas 10 mm or larger. This gives a metric that can be compared with the data in the Department of Defense and American College of Radiology Imaging Network trials (23,36). We found that, for patients with adenomas 10 mm or larger, the average patient-level sensitivity was 0.887 without CAD and was 0.911 with CAD, which are both well within the range of data in many prior CT colonography studies. However, the readers did much poorer than did those in prior studies for patients with adenomas where the largest adenoma was 6–9 mm; the average patient-level sensitivity was 0.298 without CAD and was 0.375 with CAD.
A decrease in reader specificity when a CAD-aided read is used is expected, as some polyp candidates marked by the CAD system cannot be distinguished from true polyps even by expert readers (18,37). The readers’ decrease in patient-level specificity from 0.929 to 0.904 is acceptable and remarkably lower than the average 0.14 decrease reported by Petrick et al (10), in spite of the fact that Petrick et al excluded hyperplastic polyps (which are often small and more likely to be missed by both CAD and the human reader), and no potentially confusing polyps under, but close to, the 6-mm reporting threshold level were included in the cohort. This suggests that the CAD system we tested has a good set of classifier features to reduce false-positive marks. CAD trials in smaller cohorts of patients and readers conducted over several years had wide-ranging false-positive rates with a general trend toward improvement in more recent studies (10,22,34). Improvement in ROC performance is an indicator that the trade-off in specificity is worthwhile. Since 13 (68%) of 19 readers demonstrated higher accuracy, as measured by the segment-level AUC, with a CAD-assisted read than with an unassisted read (three of 19 reaching significance), the CAD system is shown to be helpful albeit not all readers will see a large change.
There were several limitations to this study. Although the number of patients, polyps, and readers was larger than in prior trials, either a nonpolyp-enriched cohort or an even larger number of polyps, adenomas, and readers, would give even more robust data. However, the number of reading sessions and the time necessary to complete the reads must be reasonable for reader recruitment to succeed. The readers met the criteria set for the trial but did not have to undergo any testing, potentially contributing to low performance in sensitivity for small polyps. Overall, measured reader sensitivities across all polyps were lower in this study than in prior studies (regardless of the use of CAD), suggesting that a detailed analysis of the causes of the false-negative interpretations should be performed, and this analysis is under investigation. Since segmental unblinding was not used in defining the reference standard in all cases (although it was used in some cases (23), it is likely that some reader and CAD false-positive findings are actually true-positive findings. Also, using a pretest to meet expected sensitivity suggested in various organizational position statements (38,39) would have likely improved the unassisted reader sensitivity. It should be noted, however, that when considering only large adenomas, measured reader sensitivities approach those reported in prior studies. It is possible that polyp size as measured during establishment of the reference standard was smaller than the actual polyp size. As with any CAD trial, a limitation is that the results are applicable only to this software system, and other systems should not be assumed to produce similar results. The readers were not permitted to use electronic subtraction which might have improved sensitivity. It is possible that if, before using the CAD system, the reader had a better knowledge of the sensitivity, false-positive rate, and appearance of difficult polyps, often marked correctly by the CAD system, then the CAD system would have been used more effectively. The improvement in sensitivity with CAD, while small, is clinically important (even relative to the small reduction in specificity). In a screening program, even a single 10-mm or larger polyp that is missed by the radiologist interpreting the CT colonographic examination results is important because the patient may not undergo another screening CT colonographic examination for at least 5 years. Each polyp detected with CAD that is initially missed by the radiologist is a potential life saved.
We conclude that the use of CAD results in a significant improvement in overall reader performance. The CAD system improves reader sensitivity when sensitivity is measured at the segment, patient, and polyp levels for small polyps and adenomas. Average reader sensitivity improved the most with CAD for small adenomas. Use of this CAD system also reduces specificity and increases reading time, but the reduction in specificity is small.
Advances in Knowledge.
A multicase, multireader trial confirms that computer-aided detection (CAD), when used in second-reader mode, helps improve radiologists’ accuracy.
The readers’ average sensitivity for detecting polyps sized 6 mm or larger improved by 0.055 (11.8%).
As a second reader, CAD led to a decrease in specificity by 0.025 (2.7%) and an increase in reading time by an average of 4.5 minutes.
Implication for Patient Care.
CAD can help radiologists detect more polyps sized 6 mm or larger with only a small decrease in specificity.
Supplementary Material
Acknowledgments
The authors acknowledge the assistance of Julie C. Rose, BS, iCAD; J. Richard Choi, MD (who is not an employee or consultant for iCAD but was paid for his work); and Brenda Young, BA, CCRA, and Yi Zhu, MD, MBA, both from ACR Image Metrix.
Received October 9, 2009; revision requested December 23; final revision received April 21, 2010; accepted May 5; final version accepted May 25.
From the 2009 RSNA Annual Meeting.
Funding: R.M.S. is an employee of and this research was supported by the National Institutes of Health Clinical Center.
See Materials and Methods for pertinent disclosures.
See also the article by Lawrence et al in this issue.
Abbreviations:
- AUC
- area under the ROC curve
- CAD
- computer-aided detection
- CI
- confidence interval
- C-RADS
- CT Colonography Reporting and Data System
- ROC
- receiver operating characteristic
- 3D
- three-dimensional
- 2D
- two dimensional
References
- 1.Soto JA, Barish MA, Yee J. Reader training in CT colonography: how much is enough? Radiology 2005;237(1):26–27 [DOI] [PubMed] [Google Scholar]
- 2.Dachman AH, Kelly KB, Zintsmaster MP, et al. Formative evaluation of standardized training for CT colonographic image interpretation by novice readers. Radiology 2008;249(1):167–177 [DOI] [PubMed] [Google Scholar]
- 3.Mulhall BP, Veerappan GR, Jackson JL. Meta-analysis: computed tomographic colonography. Ann Intern Med 2005;142(8):635–650 [DOI] [PubMed] [Google Scholar]
- 4.Summers RM, Jerebko AK, Franaszek M, Malley JD, Johnson CD. Colonic polyps: complementary role of computer-aided detection in CT colonography. Radiology 2002;225(2):391–399 [DOI] [PubMed] [Google Scholar]
- 5.Bogoni L, Cathier P, Dundar M, et al. Computer-aided detection (CAD) for CT colonography: a tool to address a growing need. Br J Radiol 2005;78(spec no 1):S57–S62 [DOI] [PubMed] [Google Scholar]
- 6.Park SH, Kim SY, Lee SS, et al. Sensitivity of CT colonography for nonpolypoid colorectal lesions interpreted by human readers and with computer-aided detection. AJR Am J Roentgenol 2009;193(1):70–78 [DOI] [PubMed] [Google Scholar]
- 7.Baker ME, Bogoni L, Obuchowski NA, et al. Computer-aided detection of colorectal polyps: can it improve sensitivity of less-experienced readers? preliminary findings. Radiology 2007;245(1):140–149 [DOI] [PubMed] [Google Scholar]
- 8.Taylor SA, Brittenden J, Lenton J, et al. Influence of computer-aided detection false-positives on reader performance and diagnostic confidence for CT colonography. AJR Am J Roentgenol 2009;192(6):1682–1689 [DOI] [PubMed] [Google Scholar]
- 9.Burling D, Moore A, Marshall M, et al. Virtual colonoscopy: effect of computer-assisted detection (CAD) on radiographer performance. Clin Radiol 2008;63(5):549–556 [DOI] [PubMed] [Google Scholar]
- 10.Petrick N, Haider M, Summers RM, et al. CT colonography with computer-aided detection as a second reader: observer performance study. Radiology 2008;246(1):148–156 [DOI] [PubMed] [Google Scholar]
- 11.Doshi T, Rusinak D, Halvorsen RA, Rockey DC, Suzuki K, Dachman AH. CT colonography: false-negative interpretations. Radiology 2007;244(1):165–173 [DOI] [PubMed] [Google Scholar]
- 12.Hock D, Ouhadi R, Materne R, et al. Virtual dissection CT colonography: evaluation of learning curves and reading times with and without computer-aided detection. Radiology 2008;248(3):860–868 [DOI] [PubMed] [Google Scholar]
- 13.Taylor SA, Iinuma G, Saito Y, Zhang J, Halligan S. CT colonography: computer-aided detection of morphologically flat T1 colonic carcinoma. Eur Radiol 2008;18(8):1666–1673 [DOI] [PubMed] [Google Scholar]
- 14.Graser A, Kolligs FT, Mang T, et al. Computer-aided detection in CT colonography: initial clinical experience using a prototype system. Eur Radiol 2007;17(10):2608–2615 [DOI] [PubMed] [Google Scholar]
- 15.Johnson KT, Fletcher JG, Johnson CD. Computer-aided detection (CAD) using 360 degree virtual dissection: can CAD in a first reviewer paradigm be a reliable substitute for primary 2D or 3D search? AJR Am J Roentgenol 2007;189(4):W172–W176 [DOI] [PubMed] [Google Scholar]
- 16.Mang T, Peloschek P, Plank C, et al. Effect of computer-aided detection as a second reader in multidetector-row CT colonography. Eur Radiol 2007;17(10):2598–2607 [DOI] [PubMed] [Google Scholar]
- 17.Halligan S, Altman DG, Mallett S, et al. Computed tomographic colonography: assessment of radiologist performance with and without computer-aided detection. Gastroenterology 2006;131(6):1690–1699 [DOI] [PubMed] [Google Scholar]
- 18.Shi R, Schraedley-Desmond P, Napel S, et al. CT colonography: influence of 3D viewing and polyp candidate features on interpretation with computer-aided detection. Radiology 2006;239(3):768–776 [DOI] [PubMed] [Google Scholar]
- 19.Taylor SA, Halligan S, Burling D, et al. Computer-assisted reader software versus expert reviewers for polyp detection on CT colonography. AJR Am J Roentgenol 2006;186(3):696–702 [DOI] [PubMed] [Google Scholar]
- 20.Mani A, Napel S, Paik DS, et al. Computed tomography colonography: feasibility of computer-aided polyp detection in a “first reader” paradigm. J Comput Assist Tomogr 2004;28(3):318–326 [DOI] [PubMed] [Google Scholar]
- 21.Regge D, Hassan C, Pickhardt PJ, et al. Impact of computer-aided detection on the cost-effectiveness of CT colonography. Radiology 2009;250(2):488–497 [DOI] [PubMed] [Google Scholar]
- 22.Taylor SA, Greenhalgh R, Ilangovan R, et al. CT colonography and computer-aided detection: effect of false-positive results on reader specificity and reading efficiency in a low-prevalence screening population. Radiology 2008;247(1):133–140 [DOI] [PubMed] [Google Scholar]
- 23.Pickhardt PJ, Choi JR, Hwang I, et al. Computed tomographic virtual colonoscopy to screen for colorectal neoplasia in asymptomatic adults. N Engl J Med 2003;349(23):2191–2200 [DOI] [PubMed] [Google Scholar]
- 24.Zalis ME, Barish MA, Choi JR, et al. CT colonography reporting and data system: a consensus proposal. Radiology 2005;236(1):3–9 [DOI] [PubMed] [Google Scholar]
- 25.Zhou XH, Obuchowski NA, McClish DK. Statistical methods in diagnostic medicine Hoboken, NJ: Wiley-Interscience, 2002; 288–309 [Google Scholar]
- 26.DeLong ER, DeLong DM, Clarke-Pearson DL. Comparing the areas under two or more correlated receiver operating characteristic curves: a nonparametric approach. Biometrics 1988;44(3):837–845 [PubMed] [Google Scholar]
- 27.Obuchowski NA. Nonparametric analysis of clustered ROC curve data. Biometrics 1997;53(2):567–578 [PubMed] [Google Scholar]
- 28.Obuchowski NA, Lieber ML, Powell KA. Data analysis for detection and localization of multiple abnormalities with application to mammography. Acad Radiol 2000;7(7):516–525 [DOI] [PubMed] [Google Scholar]
- 29.Obuchowski NA, Rockette HE. Hypothesis testing of the diagnostic accuracy for multiple diagnostic tests: an ANOVA approach with dependent observations. Comm Statist Simulation Comput 1994;24(2):285–308 [Google Scholar]
- 30.Hillis SL. A comparison of denominator degrees of freedom methods for multiple observer ROC analysis. Stat Med 2007;26(3):596–619 [DOI] [PMC free article] [PubMed] [Google Scholar]
- 31.Obuchowski NA. On the comparison of correlated proportions for clustered data. Stat Med 1998;17(13):1495–1507 [DOI] [PubMed] [Google Scholar]
- 32.Taylor SA, Burling D, Roddie M, et al. Computer-aided detection for CT colonography: incremental benefit of observer training. Br J Radiol 2008;81(963):180–186 [DOI] [PubMed] [Google Scholar]
- 33.Taylor SA, Halligan S, Slater A, et al. Polyp detection with CT colonography: primary 3D endoluminal analysis versus primary 2D transverse analysis with computer-assisted reader software. Radiology 2006;239(3):759–767 [DOI] [PubMed] [Google Scholar]
- 34.Taylor SA, Charman SC, Lefere P, et al. CT colonography: investigation of the optimum reader paradigm by using computer-aided detection software. Radiology 2008;246(2):463–471 [DOI] [PubMed] [Google Scholar]
- 35.Pickhardt PJ, Nugent PA, Mysliwiec PA, Choi JR, Schindler WR. Location of adenomas missed by optical colonoscopy. Ann Intern Med 2004;141(5):352–359 [DOI] [PubMed] [Google Scholar]
- 36.Johnson CD, Chen MH, Toledano AY, et al. Accuracy of CT colonography for detection of large adenomas and cancers. N Engl J Med 2008;359(12):1207–1217 [DOI] [PMC free article] [PubMed] [Google Scholar]
- 37.Arnesen RB, Adamsen S, Svendsen LB, Raaschou HO, von Benzon E, Hansen OH. Missed lesions and false-positive findings on computed-tomographic colonography: a controlled prospective analysis. Endoscopy 2005;37(10):937–944 [DOI] [PubMed] [Google Scholar]
- 38.Levin B, Lieberman DA, McFarland B, et al. Screening and surveillance for the early detection of colorectal cancer and adenomatous polyps, 2008: a joint guideline from the American Cancer Society, the US Multi-Society Task Force on Colorectal Cancer, and the American College of Radiology. CA Cancer J Clin 2008;58(3):130–160 [DOI] [PubMed] [Google Scholar]
- 39.American College of Radiology ACR practice guideline for the performance of computed tomography (CT) colonography in adults. ACR Practice Guideline 2009. http://www.acr.org/SecondaryMainMenuCategories/quality_safety/guidelines/dx/gastro/ct_colonography.aspx Accessed March 6, 2010
Associated Data
This section collects any data citations, data availability statements, or supplementary materials included in this article.