Results of this study suggest that MR measures such as hippocampal volume are at least as robust as 18F fluorodeoxyglucose PET measures, even at early preclinical stages, and may be more practical for clinical use in early detection of Alzheimer disease.
Abstract
Purpose:
To quantify the effect sizes of regional metabolic and morphometric measures in patients with preclinical and mild Alzheimer disease (AD) to aid in the identification of noninvasive biomarkers for the early detection of AD.
Materials and Methods:
The study was conducted with institutional review board approval and in compliance with HIPAA regulations. Written informed consent was obtained from each participant or participant’s legal guardian. Fluorine 18 fluorodeoxyglucose (FDG) positron emission tomography (PET) and magnetic resonance (MR) imaging data were analyzed from 80 healthy control (HC) subjects, 68 individuals with AD, and 156 with amnestic mild cognitive impairment (MCI), 69 of whom had single-domain amnestic MCI. Regions of interest (ROIs) were derived after coregistering FDG PET and MR images by using high-throughput, subject-specific procedures. The Cohen d effect sizes were calculated for 42 predefined ROIs across the brain. Statistical comparison of the largest overall effect sizes for MR imaging and PET was performed. Metabolic effect sizes were determined with and without accounting for regional atrophy. Discriminative accuracy of ROIs showing the largest effect sizes were compared by calculating receiver operating characteristic curves.
Results:
For all disease groups, the hippocampus showed the largest morphometric effect size and the entorhinal cortex showed the largest metabolic effect size. In mild AD, the Cohen d effect size for hippocampal volume (1.92) was significantly larger (P < .05) than that for entorhinal metabolism (1.43). Regression of regional atrophy substantially reduced most metabolic effects. For all group comparisons, the areas under the receiver operating characteristic curves were significantly larger for hippocampal volume than for entorhinal metabolism.
Conclusion:
The current results show no evidence that FDG PET is more sensitive than MR imaging to the degeneration occurring in preclinical and mild AD, suggesting that an MR imaging finding may be a more practical clinical biomarker for early detection of AD.
© RSNA, 2010
Supplemental material: http://radiology.rsna.org/lookup/suppl/doi:10.1148/radiol.10091402/-/DC1
Introduction
With the aging U.S. population and increased life span, the dramatic rise in the expected number of Alzheimer disease (AD) cases (estimated to afflict 13.2 million people in 2050 [1]) will exact a huge toll on our society. Great effort is underway to develop disease-modifying treatments. These efforts would be facilitated by the development of in vivo biomarkers for early detection of AD and monitoring treatment effectiveness.
New disease-modifying therapies will likely be most beneficial before substantial neuronal loss and clinical impairment occurs. Mild cognitive impairment (MCI) has been identified as a risk factor for AD and may represent a preclinical stage of AD (2). MCI refers to a syndrome of impairment in one or more cognitive domains (such as memory or executive function), but of insufficient severity to cause functional impairment (2). When memory is one of the domains involved, there is an elevated risk of developing AD (2). MCI patients with impairment restricted to the memory domain (single-domain amnestic MCI [SMCI]) may reflect the earliest clinically detectable stage of preclinical AD.
Fluorine 18 fluorodeoxyglucose (FDG) positron emission tomography (PET) and structural magnetic resonance (MR) imaging are sensitive to the progressive neurodegeneration associated with AD, even in preclinical AD. Given the expense and limited availability of FDG PET relative to MR imaging, comparison of FDG PET and structural MR imaging to the early pathologic changes associated with AD would be of great interest, both to inform the design of clinical trials and for eventual clinical use. Researchers in several prior studies (3–7) have directly compared the sensitivity of FDG PET and MR imaging measures in the same subjects, reporting a relative superiority of FDG PET over MR imaging measures for detection of changes associated with mild AD or MCI. However, these studies have generally involved a small number of subjects, have utilized data obtained from a single site, and have used template- or manual drawing–based methods.
Methodological barriers have made the quantification of FDG PET– and MR imaging–derived measures in large-scale clinical trials challenging. Investigators in most studies have used analyses in which regions of interest (ROIs) are defined in template-based, atlas space rather than in individual subjects. These methods are prone to spatial normalization errors that prevent accurate detection of differences in small variable structures (8,9) and do not allow quantification of changes in metabolism and atrophy in the same regions. Manual delineation of ROIs on MR imaging data can overcome some of these problems, although such methods are labor intensive, requiring high inter- and intrarater reliability, and are thus prohibitive in large-scale studies and routine clinical use.
We developed high-throughput analytic methods that provide sensitive measurements of morphologic change in AD (10) and that are predictive of clinical decline in MCI (11). These methods can be used to obtain quantitative estimates of FDG PET metabolism within subject-specific, anatomic ROIs derived from MR images in each subject. In the current study, we have applied these methods to data from a large group of subjects from the Alzheimer’s Disease Neuroimaging Initiative (ADNI). The ADNI is a large-scale, multisite, prospective longitudinal study designed to facilitate evaluation of neuroimaging and other biomarkers for early detection of AD and monitoring of AD patients (12). The ADNI was carefully designed by leading experts in the field to optimize and standardize MR and FDG PET image acquisition across a large number of sites (13). As such, it represents a state-of-the-art experimental design that allows for the quantification of the relative effect sizes of FDG PET and structural MR imaging measures in MCI and mild AD patients in a clinical trial setting.
We applied regional, subject-specific, semiautomated methods for quantification of regional metabolism and morphometry to data from healthy control (HC) subjects, individuals with mild AD, and those with MCI, including a subgroup with SMCI. The purpose of this study was to quantify the Cohen d effect sizes (computed as the mean difference between groups divided by the pooled standard deviations) of regional metabolic and morphometric measures in patients with preclinical and mild AD to aid in the identification of noninvasive biomarkers for the early detection of AD.
Materials and Methods
A.M.D. is a founder of and holds equity interest in CorTechs Labs, La Jolla, Calif, and serves on its Scientific Advisory Board. The terms of this arrangement have been reviewed and approved by the University of California, San Diego, Calif, in accordance with its conflict of interest policies. The spouse of L.K.M. is president of CorTechs Labs. The authors had control of the data and the information submitted for publication.
This prospective study was conducted with institutional review board approval and in compliance with Health Insurance Portability and Accountability Act regulations. Written informed consent was obtained from each participant or participant’s legal guardian.
Data used in the preparation of this article were obtained from the ADNI database (http://www.loni.ucla.edu/ADNI). The ADNI was launched in 2003 by the National Institute on Aging, the National Institute of Biomedical Imaging and Bioengineering, the Food and Drug Administration, private pharmaceutical companies, and nonprofit organizations as a $60 million, 5-year public-private partnership. The goal of the ADNI is to test whether serial MR imaging, FDG PET, other biologic markers, and clinical and neuropsychological assessment can be combined to measure the progression of MCI and early AD. Determination of sensitive and specific markers of very early AD progression is intended to aid researchers and clinicians to develop new treatments and monitor their effectiveness, as well as lessen the time and cost of clinical trials.
The principal investigator of this initiative is Michael W. Weiner, MD, VA Medical Center and University of California, San Francisco, San Francisco, Calif. ADNI is the result of efforts of many coinvestigators from a broad range of academic institutions and private corporations. Subjects have been recruited from over 50 sites across the United States and Canada. ADNI has recruited 229 cognitively healthy older individuals, 398 people with amnestic MCI, and 192 people with early AD to be followed up for 3 years.
Participants
Full details of the ADNI study protocol, including inclusion and exclusion criteria, are publicly available (http://www.adni-info.org/). Briefly, inclusion criteria specify that participants be in the age range of 55–90 years, have good general health, and have completed 6 years of education. Exclusion criteria include participants who reside in a skilled nursing facility, those with any clinically important neurologic disease other than AD or those who are suspected of having AD, and those with screening MR images that show evidence of infection, infarction, or other focal lesions. We analyzed all baseline MR imaging and FDG PET data available as of May 2008 and clinical follow-up data as available in March 2010. Subjects from sites with known problematic technical issues as indicated in the FDG PET recall notice posted on the ADNI Web site were excluded from the current analysis. An additional 44 subjects were excluded whose MR imaging data failed local quality control procedures (as discussed later in MR Image Processing) and 22 subjects whose FDG PET data failed local quality control or coregistration procedures. The final cohort used in this study represents approximately 76% of the total ADNI FDG PET baseline cohort and includes 80 HC subjects, 68 individuals with AD, and 156 individuals with amnestic MCI; 69 of the 156 individuals with amnestic MCI fulfilled criteria for SMCI, as defined by Fennema-Notestine et al (10).
Cohort demographics are summarized in Table 1. Groups did not differ in age (F = 1.9, P = .15) or sex (χ2 = 3.65, P = .16). Groups differed, as expected, with respect to the Mini-Mental State Examination (F = 220.3, P < .001) and the Clinical Dementia Rating (F = 856.7, P < .001) scores.
Table 1.
Cohort Demographics

Data are the means. Numbers in parentheses are standard deviations and ranges.
MR Image Processing
Dual three-dimensional T1-weighted MR images were downloaded from the public ADNI database (http://www.loni.ucla.edu/ADNI/Data/index.shtml). Data were collected from studies performed with a variety of 1.5-T MR imaging units, with protocols optimized for the relevant manufacturer, to maximize the scientific utility of the data and to ensure use of equivalent pulse sequences (13). Protocols are described in detail at http://www.loni.ucla.edu/ADNI/Research/Cores/index.shtml. All image processing and analyses were performed at the Multimodal Imaging Laboratory, University of California, San Diego, Calif. The morphometric analytic methods have been described in detail elsewhere (10,11). Briefly, MR images were corrected for gradient nonlinearities (14) and intensity nonuniformity by using methods developed within the Biomedical Informatics Research Network Brain Morphometry testbed (http://www.birncommunity.org/current-users/morphometry-birn/) sponsored by the National Institutes of Health, the National Center for Research Resources, and the ADNI. The T1-weighted images were aligned, averaged to improve signal-to-noise ratio, and resampled to isotropic 1-mm voxels.
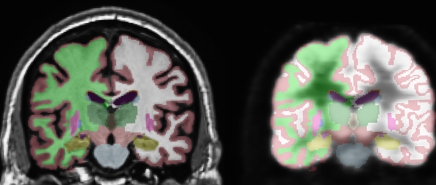
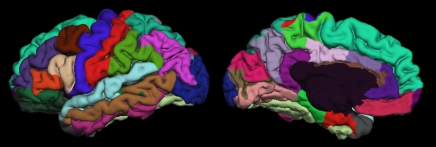
This procedure was followed by removal of nonbrain tissue, automated subcortical segmentation, and cortical surface reconstruction and parcellation by using brain MR imaging software (FreeSurfer), developed at the Athinoula A. Martinos Center for Biomedical Imaging (Massachusetts General Hospital, Boston, Mass) (Fig 1). Automated volumetric segmentation (Fig 1a) required only qualitative review to ensure no technical failure of the application. The cortical surface was reconstructed and parcellated (Fig 1b) by using an atlas relevant to the study of aging and AD (15). Morphometric measures (cortical thickness and subcortical volumes) were derived for 42 ROIs, averaging over left and right hemispheric measures. For purposes of consistency with data in other studies (7,16), the atlas-derived isthmus cingulate will be referred to here as posterior cingulate and the atlas-derived posterior cingulate will be referred to as posterior middle cingulate. The cortical surface model was manually reviewed and edited for accuracy. Minimal editing was performed according to standard, objective rules, including correction of errors in removal of nonbrain tissue and inclusion of white matter hypointense areas adjacent to the cortical ribbon. Qualitative review and editing were performed, with blinding to the diagnostic status, by one of three technicians (including R.G.J.) trained and supervised by an expert neuroanatomist with more than 10 years of experience (C.F.). The technicians had a minimum of 4 months of experience reviewing brain MR images prior to their involvement in this project.
Figure 1a:
(a) Automated, subject-specific segmentation in a 71-year-old male HC subject. Left: MR imaging segmentation. Right: Segmentation applied to coregistered FDG PET volume. ROIs include hippocampus (gold), thalamus (dark green), caudate (blue), putamen (pink), and lateral ventricle (purple). The right and left hemisphere white matter (green and white, respectively) and gray matter (maroon) are shown. (b) Subject-specific cortical parcellation in same subject. Left: Lateral view. ROIs on the lateral surface include inferior (pink), middle (brown), and superior (light blue) temporal cortices; caudal (brown) and rostral (purple) midfrontal cortices; and inferior parietal cortex (violet). Right: Medial view. ROIs on mesial surface include entorhinal cortex (red), parahippocampal cortex (green), four cingulate areas (shades of purple from posterior, posterior middle, caudal anterior, and rostral anterior), and precuneus (lavender).
Figure 1b:
(a) Automated, subject-specific segmentation in a 71-year-old male HC subject. Left: MR imaging segmentation. Right: Segmentation applied to coregistered FDG PET volume. ROIs include hippocampus (gold), thalamus (dark green), caudate (blue), putamen (pink), and lateral ventricle (purple). The right and left hemisphere white matter (green and white, respectively) and gray matter (maroon) are shown. (b) Subject-specific cortical parcellation in same subject. Left: Lateral view. ROIs on the lateral surface include inferior (pink), middle (brown), and superior (light blue) temporal cortices; caudal (brown) and rostral (purple) midfrontal cortices; and inferior parietal cortex (violet). Right: Medial view. ROIs on mesial surface include entorhinal cortex (red), parahippocampal cortex (green), four cingulate areas (shades of purple from posterior, posterior middle, caudal anterior, and rostral anterior), and precuneus (lavender).
FDG PET Image Processing
FDG PET data were collected, according to the ADNI protocol, as multiple frames (for a total image time of 30 minutes) of three-dimensional data, starting approximately 30 minutes after the injection of 5 mCi of FDG. FDG PET images were downloaded from ADNI and the frames were averaged. The averaged FDG PET images were registered to the subject’s distortion-corrected and signal intensity–normalized baseline MR imaging volume. FDG PET ROIs were derived for each subcortical and cortical region, as defined on the basis of each subject’s MR images, by means of the cerebral segmentation and cortical parcellation methods described above. FDG PET metabolism within each ROI was normalized to metabolism within the pons (17). To generate cortical surface maps of continuous metabolic data, normalized FDG PET metabolism for each subject was sampled onto the subject’s reconstructed cortical surface. To display group differences, surface-registered metabolism within each diagnostic group was averaged in spherical atlas space (18).
Statistical Analysis
Statistical analysis was performed with software (SPSS, version 15 for Windows and version 16 for Mac OSX; SPSS, Chicago, Ill). Group differences in age, Mini-Mental State Examination score, and Clinical Dementia Rating score were assessed with analysis of variance; differences in sex were assessed with the χ2 test of association. Morphometric and metabolic differences across HC, MCI, and AD groups were assessed with analyses of covariance (ANCOVAs), with covariates of age, sex, and, for volumetric measures, estimated total intracranial vault volume. A two-sided probability of P < .001 was used for group main effects, to correct for multiple comparisons. When the group effect was significant, pairwise comparisons, controlling for the effects of age, sex, and, when appropriate, estimated total intracranial vault volume, were performed to determine the significance of differences between individual groups, with use of a two-sided probability of P < .05. The raw percentage differences and Cohen d effect sizes, computed as the mean difference between groups divided by the pooled standard deviations, were based on the estimated marginal means of these pairwise comparisons. For FDG PET measures, the Cohen d effect sizes were also calculated after regressing morphometric effects from the metabolic measures, to allow estimation of the sensitivity of metabolic measures to prodromal and mild AD after controlling for confounding effects of atrophy. Statistical comparisons of the largest metabolic and morphometric Cohen d effect sizes were performed by using a Monte Carlo simulation approach, sampling from the a posteriori distribution of means and standard deviations for each group. The software was implemented in Matlab (version 2009b; MathWorks, Natick, Mass) by using the program’s tools for assessment of data (Statistics Toolbox, Matlab; MathWorks).
To further determine the relative sensitivity of the regions showing the largest MR imaging and FDG PET effect sizes, receiver operating characteristic curves were calculated for these ROIs, and statistical comparisons of areas under the curve (AUCs) were performed by using the method of Hanley and McNeil (19). We also examined the association between the MR image and FDG PET ROIs that showed the largest effect size and neuropsychological tests that measured general cognition, learning, and memory. These included the Alzheimer’s Disease Assessment Scale-Cognitive (ADAS-Cog) and the Rey Auditory Verbal Learning Test (AVLT). The ADAS-Cog is a structured scale for evaluation of memory, reasoning, language, orientation, ideational praxis, and constructional praxis. The test is scored in terms of errors, with higher scores reflecting poorer performance. The AVLT is a list-learning task for assessment of multiple cognitive parameters associated with learning and memory. AVLT-Learning is defined as the sum of the correct responses across five learning trials and AVLT-Delayed Recall is the number of correct responses after a 20-minute delay. The Steiger Z test was used to determine whether correlations with the neuropsychological scores significantly differed between FDG PET and MR imaging measures. To determine whether these ROIs were predictive of conversion to AD in MCI patients, the odds ratios of conversion to AD within 2 years was calculated on the basis of a median split of the FDG PET and MR image ROIs that showed the largest effect sizes.
Results
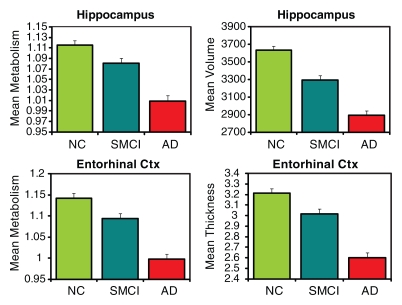
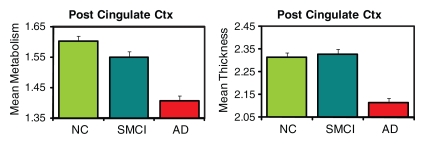
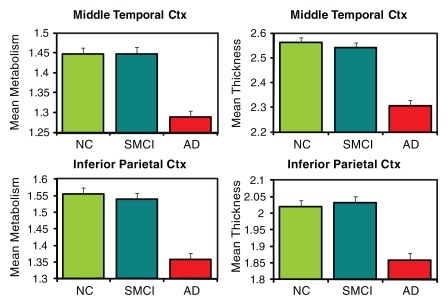
The three-group (HC, MCI, AD groups) ANCOVAs for morphometric and metabolic measures yielded significant differences in numerous ROIs (Tables E1, E2 [online]). Figure 2 shows plots of the adjusted means from the omnibus three-group ANCOVAs for select ROIs (HC, SMCI, AD groups).
Figure 2a:
ROI mean metabolism and thickness or volume plots (metabolism on the left and thickness or volume on the right) for selected ROIs. All means are adjusted for age and sex by using a model that includes all three diagnostic groups. Means are plotted with standard error bars. (a) Selected mesial temporal ROIs. (b) Posterior (Post) cingulate cortex. (c) Selected lateral ROIs. Ctx = cortex, NC = HC.
Figure 2b:
ROI mean metabolism and thickness or volume plots (metabolism on the left and thickness or volume on the right) for selected ROIs. All means are adjusted for age and sex by using a model that includes all three diagnostic groups. Means are plotted with standard error bars. (a) Selected mesial temporal ROIs. (b) Posterior (Post) cingulate cortex. (c) Selected lateral ROIs. Ctx = cortex, NC = HC.
Figure 2c:
ROI mean metabolism and thickness or volume plots (metabolism on the left and thickness or volume on the right) for selected ROIs. All means are adjusted for age and sex by using a model that includes all three diagnostic groups. Means are plotted with standard error bars. (a) Selected mesial temporal ROIs. (b) Posterior (Post) cingulate cortex. (c) Selected lateral ROIs. Ctx = cortex, NC = HC.
Regional Effect Sizes
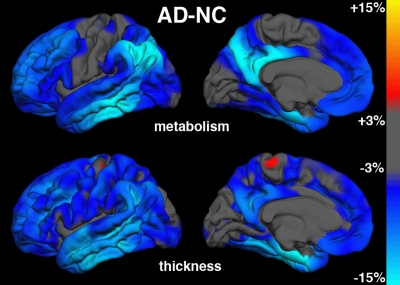
AD-HC group comparisons.—Figure 3a shows continuous surface maps of average metabolic and structural differences between AD and HC groups; Table 2 summarizes the percentage difference and effect sizes according to ROI (these ROIs are a subset of the larger data and exhibit significant omnibus group effects with P < .001 and F > 7). Results showed widespread atrophy in cortical association areas, with largest effects in mesial and lateral temporal areas. The greatest atrophy was observed in the hippocampus (−20.5%, Cohen d = 1.92) and entorhinal cortex (−19.1%, Cohen d = 1.69). The regional pattern of metabolic reductions overlapped with areas of atrophy. Reductions were observed in mesial and lateral temporal, temporoparietal, and posterior cingulate regions. Lesser reductions were observed in frontal regions, with relative sparing of primary motor, somatosensory, and visual cortices. Largest metabolic reductions were observed in entorhinal (−12.6%, Cohen d = 1.43), posterior cingulate (−12.3%, Cohen d = 1.35), and inferior parietal (−12.7%, Cohen d = 1.19) cortices. The hippocampal volume exhibited the single largest effect size of all structural measures and was significantly greater (P < .05) than the largest metabolic effect size, which was observed for the entorhinal cortex.
Figure 3a:
Continuous surface maps of mean metabolic and thickness differences. (a) Comparison between AD and HC (NC) groups and (b) between MCI and HC groups. Metabolic maps are not corrected for regional atrophy. Scale ranges from −15% (cyan) to +15% (yellow).
Table 2.
Group Mean Comparisons Adjusted for Age, Sex, and, When Appropriate, Estimated Total Intracranial Vault Volume
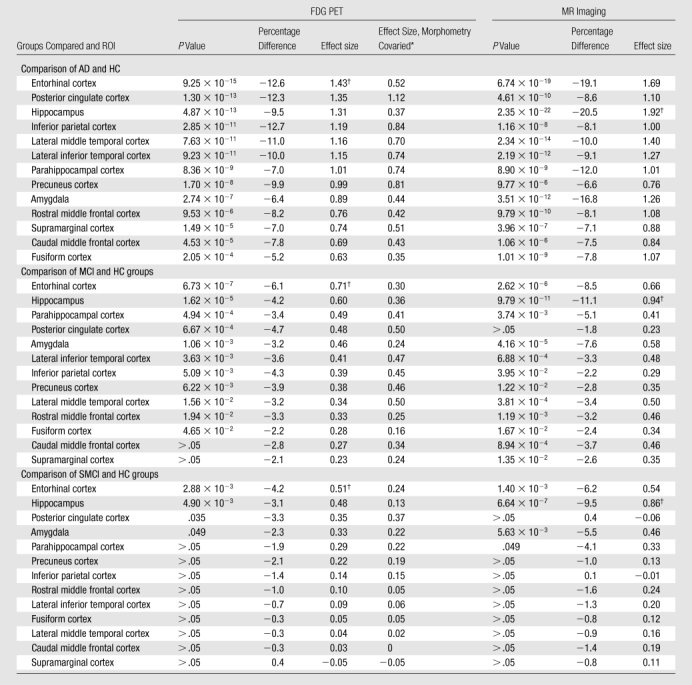
Note.—Data were sorted according to Cohen d effect size (metabolism) in descending order.
Data are the Cohen d effect size after regressing out the contribution of atrophy in the metabolic measures.
Largest metabolic and morphometric effect sizes.
Metabolic measures showed larger effect sizes than structural measures in the inferior parietal, precuneus, and posterior cingulate ROIs, although regression of atrophy reversed this difference for the inferior parietal region, leaving the posterior cingulate (Cohen d = 1.12) and precuneus (Cohen d = 0.81) showing slightly greater metabolic than structural effects. For other regions, regression of regional atrophy substantially reduced the metabolic effects, with particularly strong reductions in mesial temporal areas.
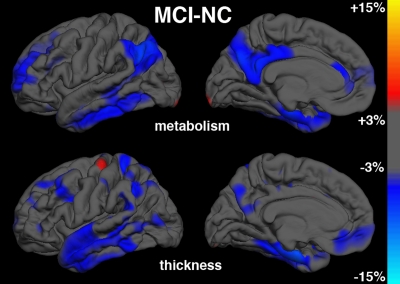
MCI-HC group comparisons.—Figure 3b shows continuous surface maps of average metabolic and structural differences between MCI and HC groups, and Table 2 summarizes the percentage difference and effect sizes according to ROI. Structural and metabolic reductions, although less widespread than in the AD versus HC group comparison, were observed in a number of ROIs. Similar to the AD versus HC group comparisons, the largest morphometric reductions occurred in mesial temporal structures, including the hippocampus (−11.1%, Cohen d = 0.94) and entorhinal cortex (−8.5%, Cohen d = 0.66). For metabolic measures, entorhinal cortex (−6.1%, Cohen d = 0.71) and hippocampus (−4.2%, Cohen d = 0.60) showed the largest reductions relative to HC subjects. The largest metabolic and morphometric effect sizes did not significantly differ from each other. However, metabolic effect sizes for these mesial temporal regions were substantially reduced after regression of regional atrophy (Cohen d = 0.36 and 0.30, respectively). In contrast, the posterior cingulate exhibited significant metabolic reduction (−4.7%, P < .001, Cohen d = 0.48) without significant concomitant changes in atrophy. Inferior parietal and precuneus ROIs also exhibited greater metabolic than morphometric effects.
Figure 3b:
Continuous surface maps of mean metabolic and thickness differences. (a) Comparison between AD and HC (NC) groups and (b) between MCI and HC groups. Metabolic maps are not corrected for regional atrophy. Scale ranges from −15% (cyan) to +15% (yellow).
SMCI-HC group comparisons.—Pairwise comparisons between SMCI and HC groups revealed more focal structural and metabolic reductions (Table 2). Significant atrophy was observed in mesial temporal regions only with the largest reduction occurring for the hippocampus (−9.5%, Cohen d = 0.86). Significant metabolic reductions were observed in mesial temporal ROIs and posterior cingulate, with the largest effect occurring for the entorhinal cortex (−4.2%, Cohen d = 0.51). The largest metabolic and morphometric effect sizes did not significantly differ from each other. Effect sizes in the mesial temporal regions were substantially reduced following regression of regional atrophy. In contrast, the posterior cingulate showed significant (P <. 05) metabolic reduction in the absence of significant atrophy (Cohen d = 0.35).
Receiver Operating Characteristic Curve Comparisons
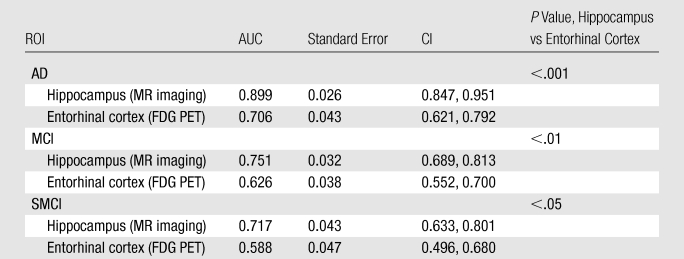
Receiver operating characteristic curves for discriminating each patient group from the control group on the basis of the morphometric and metabolic measures with the largest effect sizes are shown in Figure E1 (online). For all group comparisons, the AUCs were significantly larger for hippocampal volume than for entorhinal metabolism (P < .001 for AD, P < .01 for MCI, and P < .05 for SMCI) (Table 3).
Table 3.
AUC with Standard Error, 95% CIs, and Significance of the Hippocampus (MR imaging) and Entorhinal Cortex (FDG PET) AUC Differences
Correlation with Neuropsychologic Test Performance
Hippocampal volume and entorhinal metabolism showed significant correlation with general cognitive function, as assessed with the ADAS-Cog, and with learning and memory, as assessed with the AVLT, in MCI and SMCI subjects (Table 4). In SMCI subjects, hippocampal volume, but not entorhinal metabolism, was significantly correlated with learning and memory measures.
Table 4.
Pearson Correlation Coefficients (r Values) and P Values for Selected ROIs with Neuropsychologic Measures

Numbers in parentheses are P values for the Pearson correlation coefficient.
P values are for comparison of hippocampus versus entorhinal cortex, determined with Steiger Z test.
Prediction of Conversion to AD in MCI Patients
Reduced hippocampal volume and reduced entorhinal metabolism were each associated with significantly higher odds of conversion to AD within 2 years (hippocampal volume, 4.20; P < .001; 95% confidence interval [CI]: 1.89, 9.33; and entorhinal metabolism, 3.05; P < .01; 95% CI: 1.41, 6.60). Although the odds ratio for hippocampal volume was higher than that for entorhinal metabolism, the overlap in the CIs suggests that the two measures do not significantly differ.
Discussion
The major goal of this study was to evaluate regional metabolism and morphometry to identify those measures with the largest effect sizes in preclinical and early AD. Consistent with other reports in the literature, we found that early AD is characterized by widespread structural changes (10,20,21) and reductions in metabolism (3,22). Largest effect sizes at all stages of diseases examined were observed in mesial temporal areas, where structural effects predominated over metabolic differences. The measure showing the highest overall effect size in all comparisons was hippocampal volume, consistent with the well-established sensitivity of the hippocampus to the degenerative change associated with prodromal and mild AD (23,24).
Metabolic effects were also largest in mesial temporal areas, particularly the entorhinal cortex. Although hypometabolism in the entorhinal cortex and hippocampus has been difficult to observe in earlier FDG PET studies owing to methodological issues (3,22), investigators in studies in which careful registration of FDG PET data was applied to MR images, combined with manual ROI-based methods or optimized voxel-based morphometric methods, have reported hypometabolism in these structures in individuals with AD (3). In addition, longitudinal studies have shown early metabolic changes in these regions in individuals destined to develop AD (25,26). These results suggest that, for both morphometric and metabolic measures, mesial temporal regions may serve as the best biomarkers for early detection of AD. This conclusion is consistent with the known neuropathology of AD, in which neurofibrillary tangles first occur in mesial temporal regions before spreading to other cortical areas (27).
It is unclear whether hippocampal tissue displays significant hypometabolism, or whether observed reductions in metabolism arise mainly from tissue loss in this area (3,22). The large reduction in effect sizes observed after regressing the effects of individual-specific regional atrophy suggests that loss of tissue, rather than reduced metabolism, underlies the FDG PET effects observed here. This pattern of generally larger morphometric than metabolic effects, and substantially reduced metabolic effects following regression of atrophy, was true for the majority of the ROIs examined that showed significant differences in the omnibus ANCOVAs. This factor suggests that a loss in tissue, rather than a reduction in metabolism per unit of remaining tissue volume, accounts for much of the effects observed with FDG PET at all disease stages examined here, leading to the conclusion that FDG PET measures are largely redundant with MR imaging.
For all patient groups, the largest MR imaging effect size (hippocampal volume) was greater than the largest metabolic effect size (entorhinal cortex), a difference that was significant (P < .05) for the mild AD group. For all group comparisons, hippocampal volume showed significantly greater capability to aid the discrimination of patients from controls than did entorhinal metabolism (P < .001, AD vs HC group; P < .01, MCI vs HC group; and P < .05, SMCI vs HC group). Moreover, in the presumed earliest stage of preclinical AD, SMCI, hippocampal volume showed greater correlation with memory deficits, the hallmark of AD, than did entorhinal metabolism. Although the odds ratio of conversion from MCI to AD was larger for hippocampal volume than for entorhinal metabolism, this difference was not significant. These results show that both FDG PET and MR imaging are sensitive to the changes that occur in preclinical and mild AD, but they provide no support for the notion that FDG PET is superior to MR imaging in the detection of early changes associated with AD.
FDG PET is more expensive, less widely available, and, owing to the requirement to inject a radioactive tracer, more invasive than MR imaging. Together with our findings, this suggests that quantitative morphometric measures, such as hippocampal volume, may be better suited as noninvasive biomarkers of early AD than are FDG PET measures. Previous work (28) has shown that combining MR imaging and cerebrospinal fluid biomarkers can improve diagnostic classification (controls versus AD), but like FDG PET, obtaining cerebrospinal fluid biomarkers is invasive and not as routinely available.
This result contradicts data in prior reports in which researchers found FDG PET to be relatively superior to MR measures in the detection of changes associated with mild AD and MCI (3–5,7). However, it is consistent with data in other reports (29). Included among these other reports is a report that was based on ADNI data (30) that showed that combinations of FDG PET measures display discriminative accuracy similar to the accuracy of combinations of MR imaging measures but that the FDG PET measures do not provide an independent contribution to classification accuracy once morphometric measures are taken into account. The prior studies in which investigators reported that FDG PET measures were superior to MR imaging measures included a small number of subjects, included an analysis of data obtained from a single site, and were performed with voxel-based morphometric or manual drawing–based methods. Methodological differences, including procedures designed to improve the signal-to-noise ratio and optimize MR image contrast may account for some of the discrepancy. The multisite design also adds variability caused by different imager platforms, which may have affected FDG PET measures to a greater degree than it did MR imaging measures, a factor that would also affect any multisite, large-scale clinical trial. A recent study (29) with the use of methods similar to those used here, but for analysis of FDG PET data from a single site, also observed greater discriminative accuracy for morphometric measures than for metabolic measures, suggesting that the discrepancy between our results and those of some prior reports does not arise mainly from the multisite nature of the current study.
Despite the general redundancy of FDG PET measures with MR measures, some complementary information was identified. Significant hypometabolism was observed in posterior cingulate, inferior parietal, and precuneus regions, even after regressing out the effects of regional atrophy, suggesting that tissue in these areas is truly hypometabolic. Chételat et al (3) also reported several areas in which hypometabolism exceeded atrophy in individuals with mild AD. Here, we observed that this occurs even at the presumed earliest stage of the disease, SMCI, in which significant (P < . 05) hypometabolism was found in the posterior cingulate without concomitant atrophic changes.
Researchers in prior studies (28–30) have also noted that a combination of FDG PET and MR imaging measures improved prediction of neuropsychological performance and that FDG PET and MR imaging measures show differential sensitivity to neuropsychological measures. Thus, although the results reported here suggest that, for practical clinical purposes, MR imaging may be better suited than FDG PET for detection of mild and preclinical AD, FDG PET and MR imaging provide complementary information that may improve understanding of the neurobiological consequences of preclinical AD and the differential effect that functional and structural changes have on cognition (28,30,31).
Atrophy in the posterior cingulate in MCI has been inconsistently reported (32–35). In the subset of the ADNI MCI participants analyzed here, we observed a small decrease in posterior cingulate thickness that failed to reach significance; however, in a somewhat different and slightly larger ADNI cohort, we observed small, but significant structural effects in individuals with SMCI (10). MCI is a heterogeneous condition (36,37), and atrophy in the posterior cingulate may not occur in all individuals but may, instead, be associated with a more rapid course of progression (11,38).
Limitations of the current study included the lack of histopathologic verification of disease status; it is possible that some individuals in the AD and MCI groups had pathologic findings unassociated with AD that may have served to increase the variability of the measures. This study was also limited by the cross-sectional nature of the analyses; ongoing longitudinal analyses of the ADNI PET cohort by using these methods will allow for better assessment of the trajectory of metabolic and structural changes with disease progression. Finally, intrarater and interrater reliability of the cortical editing procedures have not been formally assessed. Because editing included correction of instances in which the gray matter–white matter boundary invaded white matter to include white matter areas of hypointensity in the cortical ribbon, the thickness measures in cases of white matter disease may be less reliable, although subjects with extreme white matter disease were excluded from analysis. Volumetric measures of the hippocampus were automatically derived and, thus, were not subject to intra- or interrater variability.
In summary, FDG PET measures were largely redundant with MR imaging measures at all stages of disease, with hippocampal volume exhibiting the overall largest effect. These results suggest that MR imaging measures, such as hippocampal volume, are at least as robust as FDG PET measures even at early preclinical stages and may be more practical for clinical use in early detection of AD.
Advances in Knowledge.
Regional, subject-specific, semiautomated techniques can be used to define specific regions of interest (ROIs) across the brain for morphometric and metabolic analysis, allowing for the quantification of morphometric and metabolic effects in mild and prodromal Alzheimer disease (AD).
For most ROIs, metabolic 18F fluorodeoxyglucose PET measures generally exhibited smaller standardized effect sizes and were largely redundant with morphometry, with hippocampal volume demonstrating the largest single effect size in mild AD.
Compared with entorhinal metabolism, hippocampal volume showed significantly greater capability to aid in the discrimination between AD or mild cognitive impairment (MCI) patients from healthy controls, greater correlation with memory measures in the early preclinical stage, and similar ability to predict conversion to AD in patients with MCI, suggesting that MR imaging measures may be preferred for the early detection and monitoring of disease progression in mild and preclinical AD.
Implication for Patient Care.
Future work may demonstrate feasibility in the application of subject-specific, semiautomated methods in a patient care setting for the early detection of AD, as well as for monitoring disease progression.
Supplementary Material
Acknowledgments
Data collection and sharing for this project were funded by ADNI. ADNI is funded by the National Institute on Aging, the National Institute of Biomedical Imaging and Bioengineering, and through generous contributions from the following: Abbott, AstraZeneca, Bayer Schering Pharma, Bristol-Myers Squibb, Eisai Global Clinical Development, Elan, Genentech, GE Healthcare, GlaxoSmithKline, Innogenetics, Johnson and Johnson, Eli Lilly, Medpace, Merck, Novartis, Pfizer, F. Hoffman-La Roche, Schering-Plough, Synarc, as well as nonprofit partners the Alzheimer’s Association and Alzheimer’s Drug Discovery Foundation, with participation from the U.S. Food and Drug Administration. Private sector contributions to ADNI are facilitated by the Foundation for the National Institutes of Health (http://www.fnih.org/). The grantee organization is the Northern California Institute for Research and Education, and the study is coordinated by the Alzheimer’s Disease Cooperative Study at the University of California, San Diego, Calif. ADNI data are disseminated by the Laboratory for Neuro Imaging at the University of California, Los Angeles, Calif. We thank Michele E. Perry, MS, Christopher J. Pung, BA, and Elaine Wu, BS, for assistance in preparing and processing the MR imaging data.
Received August 12, 2009; revision requested November 14; final revision received March 19, 2010; accepted March 24; final version accepted March 30.
From the 2008 RSNA Annual Meeting.
Supported by the Dana Foundation.
Data used in the preparation of this article were obtained from the Alzheimer’s Disease Neuroimaging Initiative (ADNI) database (http://www.loni.ucla.edu/ADNI). As such, the investigators within the ADNI contributed to the design and implementation of ADNI and/or provided data but did not participate in the analysis or writing of this report. A complete listing of ADNI investigators is available at http://www.loni.ucla.edu/ADNI/Collaboration/ADNI_Citation.shtml.
Funding: This research was supported by the National Institutes of Health (grants U24 RR021382, U01 AG024904, P30 AG010129, K01 AG030514).
See Materials and Methods for pertinent disclosures.
Abbreviations:
- AD
- Alzheimer disease
- ADAS-Cog
- Alzheimer’s Disease Assessment Scale-Cognitive
- ADNI
- Alzheimer’s Disease Neuroimaging Initiative
- ANCOVA
- analysis of covariance
- AVLT
- Auditory Verbal Learning Test
- AUC
- area under the curve
- CI
- confidence interval
- FDG
- fluorine 18 fluorodeoxyglucose
- HC
- healthy control
- MCI
- mild cognitive impairment
- ROI
- region of interest
- SMCI
- single-domain amnestic MCI
References
- 1.Hebert LE, Scherr PA, Bienias JL, Bennett DA, Evans DA. Alzheimer disease in the US population: prevalence estimates using the 2000 census. Arch Neurol 2003;60(8):1119–1122 [DOI] [PubMed] [Google Scholar]
- 2.Petersen RC. Mild cognitive impairment as a diagnostic entity. J Intern Med 2004;256(3):183–194 [DOI] [PubMed] [Google Scholar]
- 3.Chételat G, Desgranges B, Landeau B, et al. Direct voxel-based comparison between grey matter hypometabolism and atrophy in Alzheimer’s disease. Brain 2008;131(pt 1):60–71 [DOI] [PubMed] [Google Scholar]
- 4.Kawachi T, Ishii K, Sakamoto S, et al. Comparison of the diagnostic performance of FDG-PET and VBM-MRI in very mild Alzheimer’s disease. Eur J Nucl Med Mol Imaging 2006;33(7):801–809 [DOI] [PubMed] [Google Scholar]
- 5.De Santi S, de Leon MJ, Rusinek H, et al. Hippocampal formation glucose metabolism and volume losses in MCI and AD. Neurobiol Aging 2001;22(4):529–539 [DOI] [PubMed] [Google Scholar]
- 6.Ishii K, Sasaki H, Kono AK, Miyamoto N, Fukuda T, Mori E. Comparison of gray matter and metabolic reduction in mild Alzheimer’s disease using FDG-PET and voxel-based morphometric MR studies. Eur J Nucl Med Mol Imaging 2005;32(8):959–963 [DOI] [PubMed] [Google Scholar]
- 7.Mosconi L, Sorbi S, de Leon MJ, et al. Hypometabolism exceeds atrophy in presymptomatic early-onset familial Alzheimer’s disease. J Nucl Med 2006;47(11):1778–1786 [PubMed] [Google Scholar]
- 8.Mosconi L, Tsui WH, De Santi S, et al. Reduced hippocampal metabolism in MCI and AD: automated FDG-PET image analysis. Neurology 2005;64(11):1860–1867 [DOI] [PubMed] [Google Scholar]
- 9.Sun FT, Schriber RA, Greenia JM, He J, Gitcho A, Jagust WJ. Automated template-based PET region of interest analyses in the aging brain. Neuroimage 2007;34(2):608–617 [DOI] [PMC free article] [PubMed] [Google Scholar]
- 10.Fennema-Notestine C, Hagler DJ, Jr, McEvoy LK, et al. Structural MRI biomarkers for preclinical and mild Alzheimer’s disease. Hum Brain Mapp 2009;30(10):3238–3253 [DOI] [PMC free article] [PubMed] [Google Scholar]
- 11.McEvoy LK, Fennema-Notestine C, Roddey JC, et al. Alzheimer disease: quantitative structural neuroimaging for detection and prediction of clinical and structural changes in mild cognitive impairment. Radiology 2009;251(1):195–205 [DOI] [PMC free article] [PubMed] [Google Scholar]
- 12.Mueller SG, Weiner MW, Thal LJ, et al. The Alzheimer’s disease neuroimaging initiative. Neuroimaging Clin N Am 2005;15(4):869–877, xi–xii [DOI] [PMC free article] [PubMed] [Google Scholar]
- 13.Jack CR, Jr, Bernstein MA, Fox NC, et al. The Alzheimer’s Disease Neuroimaging Initiative (ADNI): MRI methods. J Magn Reson Imaging 2008;27(4):685–691 [DOI] [PMC free article] [PubMed] [Google Scholar]
- 14.Jovicich J, Czanner S, Greve D, et al. Reliability in multi-site structural MRI studies: effects of gradient non-linearity correction on phantom and human data. Neuroimage 2006;30(2):436–443 [DOI] [PubMed] [Google Scholar]
- 15.Desikan RS, Ségonne F, Fischl B, et al. An automated labeling system for subdividing the human cerebral cortex on MRI scans into gyral based regions of interest. Neuroimage 2006;31(3):968–980 [DOI] [PubMed] [Google Scholar]
- 16.Callen DJ, Black SE, Gao F, Caldwell CB, Szalai JP. Beyond the hippocampus: MRI volumetry confirms widespread limbic atrophy in AD. Neurology 2001;57(9):1669–1674 [DOI] [PubMed] [Google Scholar]
- 17.Minoshima S, Frey KA, Foster NL, Kuhl DE. Preserved pontine glucose metabolism in Alzheimer disease: a reference region for functional brain image (PET) analysis. J Comput Assist Tomogr 1995;19(4):541–547 [DOI] [PubMed] [Google Scholar]
- 18.Fischl B, Sereno MI, Tootell RB, Dale AM. High-resolution intersubject averaging and a coordinate system for the cortical surface. Hum Brain Mapp 1999;8(4):272–284 [DOI] [PMC free article] [PubMed] [Google Scholar]
- 19.Hanley JA, McNeil BJ. A method of comparing the areas under receiver operating characteristic curves derived from the same cases. Radiology 1983;148(3):839–843 [DOI] [PubMed] [Google Scholar]
- 20.Singh V, Chertkow H, Lerch JP, Evans AC, Dorr AE, Kabani NJ. Spatial patterns of cortical thinning in mild cognitive impairment and Alzheimer’s disease. Brain 2006;129(pt 11):2885–2893 [DOI] [PubMed] [Google Scholar]
- 21.Ramani A, Jensen JH, Helpern JA. Quantitative MR imaging in Alzheimer disease. Radiology 2006;241(1):26–44 [DOI] [PubMed] [Google Scholar]
- 22.Mosconi L. Brain glucose metabolism in the early and specific diagnosis of Alzheimer’s disease: FDG-PET studies in MCI and AD. Eur J Nucl Med Mol Imaging 2005;32(4):486–510 [DOI] [PubMed] [Google Scholar]
- 23.Jack CR, Jr, Dickson DW, Parisi JE, et al. Antemortem MRI findings correlate with hippocampal neuropathology in typical aging and dementia. Neurology 2002;58(5):750–757 [DOI] [PMC free article] [PubMed] [Google Scholar]
- 24.Jack CR, Jr, Petersen RC, Xu YC, et al. Prediction of AD with MRI-based hippocampal volume in mild cognitive impairment. Neurology 1999;52(7):1397–1403 [DOI] [PMC free article] [PubMed] [Google Scholar]
- 25.de Leon MJ, Convit A, Wolf OT, et al. Prediction of cognitive decline in normal elderly subjects with 2-[(18)F]fluoro-2-deoxy-D-glucose/poitron-emission tomography (FDG/PET). Proc Natl Acad Sci U S A 2001;98(19):10966–10971 [DOI] [PMC free article] [PubMed] [Google Scholar]
- 26.Mosconi L, Mistur R, Switalski R, et al. FDG-PET changes in brain glucose metabolism from normal cognition to pathologically verified Alzheimer’s disease. Eur J Nucl Med Mol Imaging 2009;36(5):811–822 [DOI] [PMC free article] [PubMed] [Google Scholar]
- 27.Braak H, Braak E. Neuropathological stageing of Alzheimer-related changes. Acta Neuropathol 1991;82(4):239–259 [DOI] [PubMed] [Google Scholar]
- 28.Walhovd KB, Fjell AM, Brewer J, et al. Combining MR imaging, positron-emission tomography, and CSF biomarkers in the diagnosis and prognosis of Alzheimer disease. AJNR Am J Neuroradiol 2010;31(2):347–354 [DOI] [PMC free article] [PubMed] [Google Scholar]
- 29.Walhovd KB, Fjell AM, Amlien I, et al. Multimodal imaging in mild cognitive impairment: metabolism, morphometry and diffusion of the temporal-parietal memory network. Neuroimage 2009;45(1):215–223 [DOI] [PubMed] [Google Scholar]
- 30.Walhovd KB, Fjell AM, Dale AM, et al. Multi-modal imaging predicts memory performance in normal aging and cognitive decline. Neurobiol Aging 2010;31(7):1107–1121 [DOI] [PMC free article] [PubMed] [Google Scholar]
- 31.Chetelat G, Desgranges B, de la Sayette V, et al. Dissociating atrophy and hypometabolism impact on episodic memory in mild cognitive impairment. Brain 2003;126(pt 9):1955–1967 [DOI] [PubMed] [Google Scholar]
- 32.Pengas G, Hodges JR, Watson P, Nestor PJ. Focal posterior cingulate atrophy in incipient Alzheimer’s disease. Neurobiol Aging 2010;31(1):25–33 [DOI] [PubMed] [Google Scholar]
- 33.Chételat G, Desgranges B, De La Sayette V, Viader F, Eustache F, Baron JC. Mapping gray matter loss with voxel-based morphometry in mild cognitive impairment. Neuroreport 2002;13(15):1939–1943 [DOI] [PubMed] [Google Scholar]
- 34.Karas GB, Scheltens P, Rombouts SA, et al. Global and local gray matter loss in mild cognitive impairment and Alzheimer’s disease. Neuroimage 2004;23(2):708–716 [DOI] [PubMed] [Google Scholar]
- 35.Shiino A, Watanabe T, Maeda K, Kotani E, Akiguchi I, Matsuda M. Four subgroups of Alzheimer’s disease based on patterns of atrophy using VBM and a unique pattern for early onset disease. Neuroimage 2006;33(1):17–26 [DOI] [PubMed] [Google Scholar]
- 36.Whitwell JL, Petersen RC, Negash S, et al. Patterns of atrophy differ among specific subtypes of mild cognitive impairment. Arch Neurol 2007;64(8):1130–1138 [DOI] [PMC free article] [PubMed] [Google Scholar]
- 37.Bell-McGinty S, Lopez OL, Meltzer CC, et al. Differential cortical atrophy in subgroups of mild cognitive impairment. Arch Neurol 2005;62(9):1393–1397 [DOI] [PubMed] [Google Scholar]
- 38.Chételat G, Landeau B, Eustache F, et al. Using voxel-based morphometry to map the structural changes associated with rapid conversion in MCI: a longitudinal MRI study. Neuroimage 2005;27(4):934–946 [DOI] [PubMed] [Google Scholar]
Associated Data
This section collects any data citations, data availability statements, or supplementary materials included in this article.


