This study showed that the approach with which biopsies are performed evolved in the past decade, with continuing substitution away from more invasive and nonimaging-guided percutaneous biopsy approaches in favor of imaging-guided percutaneous approaches.
Abstract
Purpose:
To assess national levels and trends in utilization of biopsy procedures during the past decade and investigate the relative roles of biopsy approaches (open, endoscopic, and percutaneous) and physician specialties.
Materials and Methods:
Institutional review board approval was not necessary because only public domain data were used. Aggregated Medicare claims data were used to determine utilization of biopsies performed in 10 anatomic regions from 1997 to 2008. Utilization levels according to biopsy approach and anatomic region were calculated. Trends in the relative utilization of percutaneous needle biopsy (PNB) and imaging-guided percutaneous biopsy (IGPB) were assessed. The relative roles of radiologists and nonradiologists in the performance of all biopsies, PNBs, and IGPBs were evaluated.
Results:
Biopsy procedures with all approaches increased from 1380 to 1945 biopsies per 100 000 Medicare enrollees between 1997 and 2008, which represents a compound annual growth rate (CAGR) of 3%. Utilization of non-PNBs fell, while the absolute level and relative share of PNBs increased. In 2008, 67% of all biopsies were performed by using a percutaneous route. IGPB as a percentage of all PNBs increased over time in the regions for which data were available. Radiology was the leading specialty providing biopsy services. The total number of biopsies performed by radiologists increased at a CAGR of 8%, and radiologists’ share of all biopsies increased from 35% to 56%.
Conclusion:
During the past decade, there was continuing substitution away from invasive approaches and non–imaging-guided percutaneous approaches in favor of PNBs and IGPBs, likely related to increasing use of advanced imaging modalities for biopsy guidance. Consequently, radiologists are performing an increasing share of biopsies across all anatomic regions.
© RSNA, 2010
Supplemental material:http://radiology.rsna.org/lookup/suppl/doi:10.1148/radiol.10092130/-/DC1
Introduction
The concept of microscopic examination of tissue as a means of disease diagnosis was first described in the mid-19th century (1). Initially, these procedures were performed as part of therapeutic surgery or involved an operation dedicated to biopsy. The first percutaneous needle biopsy (PNB) of the liver was reported by Adolf Bingel in 1923 (2), and percutaneous biopsies subsequently developed into an invaluable diagnostic tool in many organ systems. PNBs were originally performed blind or with fluoroscopic guidance. PNBs had lower morbidity than open biopsies and had the added benefits of possibly obviating surgery and allowing for cost savings (3,4). On the other hand, because the percutaneous approach did not allow for direct visualization of organs, it was hampered by suboptimal diagnostic yields and was still prone to complications (5,6). After the advent of computed tomography (CT), ultrasonography (US), and magnetic resonance (MR) imaging, modern techniques for PNB with advanced imaging guidance were developed. Imaging guidance allows for greater precision in targeting lesions, resulting in high sensitivities and low complication rates (7–11).
Given this background, a natural expectation is that, for organs for which PNB is an option, this approach will have largely replaced open surgical biopsies and further, that imaging-guided percutaneous biopsies (IGPBs) will have replaced non-IGPBs. Because radiologists play a central role in the development and provision of imaging services, another expectation is that radiologists initially perform the majority of the IGPBs. On the other hand, the history of other imaging and imaging-guided procedures such as percutaneous arterial interventions suggests that, while radiologists may at first perform the majority of IGPBs, over time, nonradiologists assume a growing share of these procedures (12–15). None of these expectations has been empirically investigated; data confirming or refuting these expected trends can help policymakers and administrators make decisions related to issues such as resource allocation.
Previous authors (13–18) have written on the effects of new imaging and imaging-guided procedures on utilization and the roles of radiologists in performing these procedures. However, with rare exceptions, these studies have not included the procedures traditionally performed by nonradiologists which may have been supplanted by the new techniques. Furthermore, these studies include data across relatively short time spans and tend to focus on one specific organ system. This study evaluates the utilization of open and percutaneous biopsy procedures for 10 anatomic sites and investigates the relative roles of providers during the past decade. By taking a wider perspective across an extended time period, we seek to gain insight on the long-term effect of new imaging technologies on the performance of a variety of biopsy procedures within and outside of the field of radiology.
Materials and Methods
We used the Centers for Medicare and Medicaid Services Physician/Supplier Procedure Summary Master Files from 1997 to 2008. These files include aggregated claims information for all patients with Medicare Supplemental Medical Insurance (Medicare Part B) who did not receive their services through a Medicare managed care plan (Medicare Advantage).
The 2008 Current Procedural Terminology (CPT) codes for percutaneous biopsy procedures outside of the central nervous system were selected and grouped into 10 anatomic regions: abdomen and retroperitoneum, bone, breast, chest, kidney, liver, musculoskeletal soft tissue, pancreas, superficial lymph node, and thyroid. For example, for biopsies in the chest, codes 32400 “percutaneous needle biopsy of the pleura” and 32405 “percutaneous needle biopsy of the lung or mediastinum” were included. Fine-needle aspirations (FNAs) were kept as a separate group because the CPT codes for these procedures are not specific for an organ or anatomic region. CPT codes for open, laparoscopic, or bronchoscopic biopsy procedures in the same anatomic regions were also selected. For example, for biopsies of the chest, the comparable surgical codes included biopsies of the lung, mediastinum, and pleura with limited thoracotomy, thorascopic, and bronchoscopic approaches.
Because thyroid lobectomy is not an appropriate alternative to thyroid core biopsy, no surgical codes were included for comparison to percutaneous thyroid core biopsies. For percutaneous abdominal biopsies, inclusion of the possibly relevant CPT code 49000 “exploratory laparotomy, exploratory celiotomy with or without biopsy(s)” would have been too broad and not appropriate for comparison. Thus, no code for an open surgical approach was included; however, the code 49321 “laparoscopy, surgical; with biopsy” was included.
CPT codes 19120 and 19125 for lumpectomy and lumpectomy with wire localization, respectively, include both excisional biopsies and therapeutic excisions, but because the former indication represents the minority of cases, these codes were excluded for general analyses. We wanted to try to account for some of these excluded cases, and thus we performed two sets of analyses for growth rates for biopsies with all approaches. The first set of analysis excluded the CPT codes for lumpectomies, and the second set included them with a weighting of 0.36. This number was based on a recent study (19) demonstrating that about 36% of lumpectomies are performed as the first diagnostic intervention for a new breast finding.
Only the 10000 to 60000 series of CPT codes for procedures were included. The 70000 series of CPT codes corresponding to radiologic studies were excluded so as to not count more than once those procedures that resulted in codes for both the procedure and the related imaging.
Table E1 (online) lists the CPT codes included in this study according to anatomic region (where relevant).
The Medicare Physician/Supplier Procedure Summary files report the self-designated specialty of the provider for each claim by using one of 100 specialty codes. To make the information according to specialty more useful, we grouped some of the specialty codes. Specialty codes for diagnostic radiology, interventional radiology, nuclear medicine, and osteopathic roentgenology were classified as radiology. Codes for family practice, general practice, and internal medicine were classified as general medicine. For analyses that were not specific for anatomic region, all medical subspecialty physician providers and multispecialty medical practices were grouped as medical specialists. All surgical subspecialty providers and multispecialty surgical practices were grouped as surgical specialists. Nonphysician providers were grouped as other.
The total number of Medicare enrollees for each year was obtained from the Centers for Medicare and Medicaid Services (20) and was calculated as the number of enrollees in Supplemental Medical Insurance (Medicare Part B) minus the number of enrollees with Medicare Advantage. Compound annual growth rates (CAGRs) were calculated per 100 000 Medicare enrollees for each calendar year. All data analyses were performed by using software (SAS, version 9.2, SAS Institute, Cary, NC; Excel 2007, Microsoft, Redmond, Wash).
Institutional review board approval was not required because these public domain data do not involve individually identifiable health information.
Results
Biopsy Approach
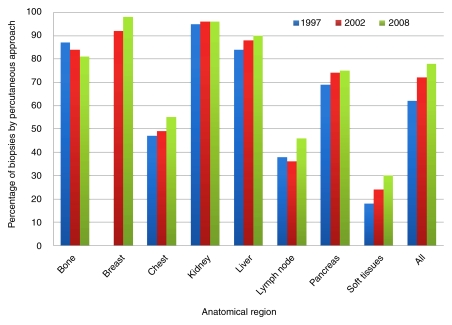
As summarized in Figure 1, PNBs as a percentage of all approaches increased during our study period for six anatomic regions: breast, chest, liver, lymph node, pancreas, and musculoskeletal soft tissue. The percentage of PNBs was essentially unchanged for kidney and decreased for bone. Total biopsies across all of these regions showed a modest growth in the share of PNBs, from 73% to 78%, between 2002 and 2008. With the exclusion of breast biopsies (breast biopsies underwent a coding change in 2001 which affected the reported distribution of open vs percutaneous biopsies), PNBs increased from 59% to 67% of all biopsies during the entire study period from 1997 to 2008. Biopsies of the abdomen and thyroid and FNAs were excluded from this part of the analysis because no comparable open approach was included in our data set for reasons detailed previously.
Figure 1:
Graph shows percentage of biopsies performed with percutaneous approach according to anatomic region in 1997, 2002, and 2008. Lymph node = superficial lymph nodes, Soft tissues = soft tissues of the musculoskeletal system.
A wide range existed in the relative roles of percutaneous and nonpercutaneous approaches for the anatomic regions. At one extreme, PNBs were the dominant approach for biopsies of the kidney and liver, representing 96% and 90%, respectively, of all biopsies performed in these sites in 2008. At the other extreme, PNBs constituted the minority of all biopsies in the superficial lymph nodes and musculoskeletal soft tissues, at 46% and 30%, respectively.
There was relatively modest growth of total biopsy procedures, with all approaches included. In 1997, 428 144 biopsies, or 1380 biopsies per 100 000 Medicare enrollees, were performed. In 2008, 677 811 biopsies, or 1945 biopsies per 100 000 Medicare enrollees, were performed. This represents a CAGR of 3% across the entire study period; there was no difference in the CAGR between the earlier part of the study period (1997–2002) and the later part (2004–2008). When lumpectomies with a weighting factor were included in the analysis, the CAGR for all biopsies was 2%. The utilization of PNBs rose from 295 836 to 573 397 between 1997 and 2008. This equaled a rise from 953 to 1645 biopsies per 100 000 enrollees, for a CAGR of 5%. There was again no change in the growth rate between the early and later part of the study period. In contrast, utilization of biopsies performed with nonpercutaneous approaches had a CAGR of −3% between 1997 and 2008.
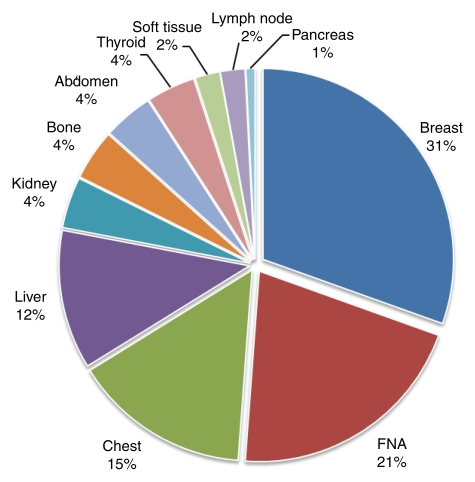
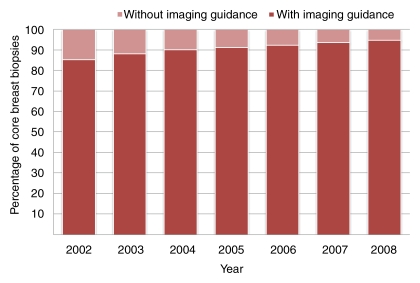
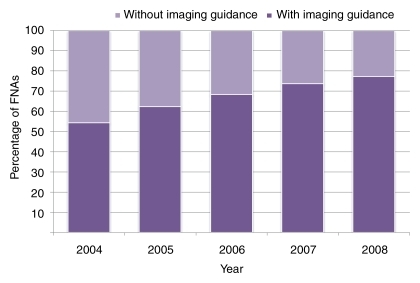
Most CPT codes for percutaneous biopsies do not distinguish whether procedures are performed with or without imaging guidance. Two notable exceptions are percutaneous core biopsies of the breast and FNAs, for which CPT codes specifying the use of imaging guidance were created in 2001 and 2002, respectively. These biopsies represent the two largest groups of percutaneous biopsies included in this study, together representing 60% of all percutaneous biopsies in 2008. They were also the two largest groups of biopsies performed by radiologists (Fig 2), together accounting for 52% of all biopsy work performed by radiologists in 2008. Analysis of percutaneous breast core biopsies and FNAs demonstrate a consistent trend, with substitution away from non–imaging-guided biopsies in favor of those performed with imaging guidance. For breast core biopsies, IGPBs rose from 85% to 95% of all percutaneous core biopsies between 2002 and 2008 (Fig 3). For FNAs, the imaging-guided portion increased from 54% to 77% between 2004 and 2008 (Fig 4).
Figure 2:
Pie chart shows biopsies according to anatomic region as a percentage of all biopsies performed by radiologists in 2008. Lymph node = superficial lymph nodes, Soft tissue = soft tissue of the musculoskeletal system.
Figure 3:
Graph shows percutaneous breast core biopsies performed with or without imaging guidance as a percentage of all percutaneous breast biopsies from 2002 to 2008.
Figure 4:
Graph shows FNAs performed with or without imaging guidance as a percentage of all FNAs from 2004 to 2008.
Provider Specialty
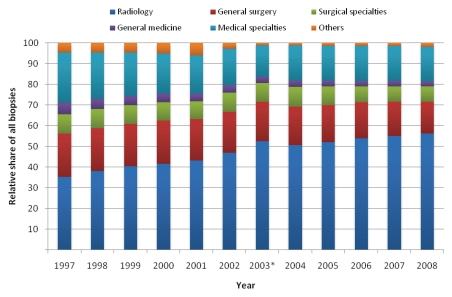
The top three specialties involved in performing all biopsy procedures from 1997 to 2008 were radiology, general surgery, and pulmonology; these specialties together performed 75% of all biopsy work in this period. Radiologists’ share of all biopsies increased steadily during this time, from 35% in 1997 to 56% in 2008 (Fig 5). In comparison, general surgery and pulmonology had a decrease in their respective shares, from 21% to 15% and 10% to 5%.
Figure 5:
Graph shows relative share of all biopsies performed according to specialty from 1997 to 2008. * = Data in 2003 were affected by a coding discrepancy for FNAs.
Between 1997 and 2008, the total number of biopsies performed by nonradiologist providers fell from 894 to 852 procedures per 100 000 Medicare enrollees, for a CAGR of −0.4%. Much of the loss in volume took place in the beginning of the study period; from 1997 to 2002, biopsies performed by nonradiologists had a CAGR of −1%, compared with 0.5% from 2003 to 2008. When lumpectomies with a weighting factor were included, the loss in volume was even more pronounced, from 1053 to 925 procedures per 100 000 Medicare enrollees, for a CAGR of −1.2%. The total number of biopsies performed by radiologists rose from 485 to 1093 procedures per 100 000 enrollees, for a CAGR of 8%. The rate of growth slowed during the study period, as evidenced by a decrease in the growth rate from 9% in the period from 1997 to 2002 to 6% from 2004 to 2008.
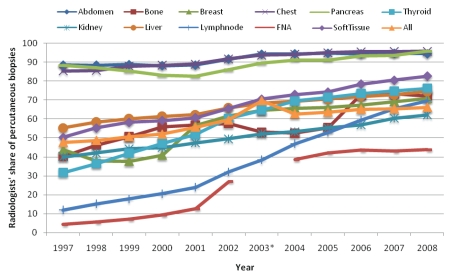
Anatomic region–level analysis revealed that this robust growth was because of an increase in radiologists’ share of PNBs in all regions (Fig 6). The percentage of percutaneous biopsies performed by radiologists increased from 48% to 66% between 1997 and 2008. The anatomic region that had the most rapid growth was lymph node biopsies, where radiologists’ share increased from 12% to 70%, for a CAGR of 22%. Radiologists’ share of FNAs increased from 4% to 44%, for a CAGR of 37%.
Figure 6:
Graph shows radiologists’ share of percutaneous biopsy procedures according to anatomic region from 1997 to 2008. * = Data in 2003 were affected by a coding discrepancy for FNAs.
Analysis of the top specialists performing breast core biopsies and FNAs that were imaging guided (Table) revealed divergent trends. With respect to image-guided breast core biopsies, radiologists performed the majority of these procedures and their share increased slightly, from 70% to 75% between 2002 and 2008. In contrast, radiologists’ share of imaging-guided FNAs fell during a similar period, from 70% to 56% between 2004 and 2008. In the same period, endocrinologists increased their share of imaging-guided FNAs from 12% to 21%.
Top Specialties Involved in Breast Core Biopsies and FNAs with Imaging Guidance
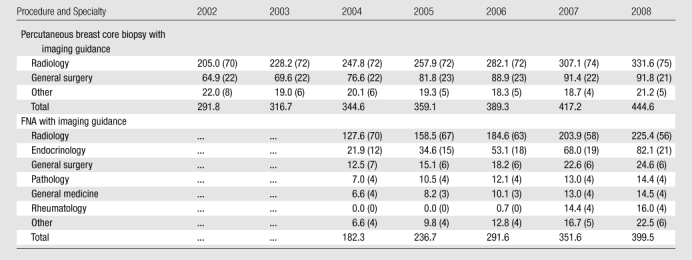
Note.—Numbers are procedures per 100 000 Medicare enrollees. Values may not add up to totals because of rounding. Data in parentheses are percentages of all specialties and may not add up to 100% because of rounding. Data for FNAs are not available for 2003 and not included for 2002 because claims coding is less reliable in the 1st year after the introduction of a new CPT code.
Discussion
One salient finding of this study is that practice patterns are still in evolution—albeit not rapid evolution—in the field of biopsies. The data demonstrate that there was continued substitution away from more invasive biopsy approaches in favor of a percutaneous approach for the majority of the anatomic regions studied. Because PNB techniques were established well over a half-century ago, we might have expected that the distribution of biopsy approach would have stabilized prior to our study period. A likely explanation is that the relatively recent proliferation of CT, MR imaging, and US had an effect on the overall approach used for performing biopsies, because more lesions can be efficiently and safely targeted with a percutaneously inserted needle now that imaging guidance is more readily available. Breast core biopsy is one example of where this holds true. We found that the percentage of IGPBs increased concomitant with decreases in the percentages of both open biopsies and nonimaging-guided percutaneous biopsies.
We were somewhat surprised that, while a large percentage of biopsies were performed with a percutaneous approach, the percentage was not higher than the 78% seen in 2008. Of course, as discussed previously, this number is expected to continue to evolve with time. Some explanations do emerge when the data are examined according to anatomic regions. The only two regions for which the PNBs do not represent the majority of biopsies are superficial lymph nodes and musculoskeletal soft tissues. These regions are primarily superficial tissues; this fact allows for low morbidity from open biopsies. The areas of concern are more likely to be palpable (in contrast to the breast, for example, where screening mammography results in evaluation of many nonpalpable lesions), and thus there is less need for imaging guidance. Furthermore, many of the CPT codes for biopsies of the soft tissues are vague in their description of how the procedure is performed (although PNBs are specifically excluded), and some of these biopsies are probably punch or shave biopsies which could be loosely classified as percutaneous by merit of not requiring a large skin incision.
While PNBs and imaging-guided FNAs and breast biopsies had CAGRs of 5% and 13%, respectively, the growth in overall biopsy utilization was a modest 2%–3%, in part because the percutaneous approach was replacing other approaches. Despite rapid increases in imaging utilization (21,22) in the same time span, growth in the total number of biopsies performed was not rampant. This finding may assuage some fears that increased imaging utilization is resulting in additional costly work-ups, including biopsies (23,24).
Consistent with the rising role of IGPBs as the preferred approach was the rapid increase in the share of PNBs performed by radiologists during this period. At the same time as the number of biopsies performed by nonradiologists as a whole fell, biopsy procedures performed by radiologists grew by a robust CAGR of 8%. However, the rate of growth appears to be slowing; CAGR was 6% in the second half of the period studied.
One factor that might contribute to this slowdown is that other specialties are increasingly performing IGPBs. The data were inconsistent as to whether this is occurring. In the case of breast biopsies, the share IGPBs performed by radiologists increased from 2002 to 2008. In contrast, the share of image-guided FNAs performed by radiologists fell as endocrinologists performed more of these procedures. These divergent findings may be in part a result of differences in the regulatory environment related to these services. A facility must go through a rigorous accreditation process to perform mammography, and accreditation for breast biopsy may become mandatory in the near future (25). This presents a large barrier to entry. On the other hand, there is sparse regulation of the use of US imaging, the modality used most often for FNA guidance. In keeping with this, nonradiologists have been shown to perform about two-thirds of all US work in the Medicare population (26), and it makes sense that this trend might extend to US-guided biopsies.
Our study had limitations. The Medicare data used in this study have the advantage of including claims data on more than 30 million enrollees, or about one-third of the health care workload in the United States. The data collection method is relatively uniform through multiple years. However, there was an irregularity in the data for FNAs in 2003. For this reason, 2003 was not used for any CAGR calculations. This irregularity should not affect overall trends. One limitation of Medicare data is that they are predominantly composed of services provided to the elderly; the nonelderly population will have different utilization rates.
The use of aggregated data limited our analysis of the proportion of biopsies performed with imaging guidance to those biopsies for which CPT codes explicitly separate procedures performed with versus without imaging guidance. A claims-level data set would have enabled us to perform this analysis for other biopsy procedures. However, these data sets with physician identifiers are available only for a 5% sample of beneficiaries, and it is difficult to accurately capture volumes for procedures that are not commonly performed with sample data. Furthermore, these large claims-level data sets are relatively expensive and difficult to obtain. Our use of aggregated data permitted us to perform comprehensive analyses during a period of 11 years.
Because the data were reported according to CPT codes, we were somewhat restricted by the idiosyncrasies of CPT coding. While we generally classified the biopsy procedures according to anatomic region, we were unable to do this for FNAs because CPT coding does not specify anatomic regions for these procedures. This would be expected to artificially underestimate the total biopsies performed in each specific anatomic region and underestimate the percentage performed percutaneously, with a larger effect on breast, thyroid, and chest biopsies.
We were also unable to capture the full range of biopsy procedures for the abdomen, because the CPT code for open laparotomies included all laparotomies, nonspecific for whether they were performed for the purpose of tissue sampling. The effect of not including the open biopsy equivalent is to overestimate the growth rate of all biopsy procedures, because our analysis for other anatomic regions demonstrated that growth rates for open biopsies were either flat or decreased due to substitution with percutaneous approaches. We estimate the effect of excluding open abdominal biopsies to be very small because biopsies of the abdomen constituted only a small percentage of all biopsies in this study.
In conclusion, this study showed that that the approach with which biopsies are performed evolved in the past decade, with continuing substitution away from more invasive and nonimaging-guided percutaneous biopsy approaches in favor of imaging-guided percutaneous approaches. Because of this shift, radiologists are performing an increasing share of biopsies across all anatomic regions. However, there is some evidence to suggest that other specialties are increasing their share of certain types of imaging-guided percutaneous biopsies.
Advances in Knowledge.
Percutaneous needle biopsies are replacing biopsies that have more invasive approaches, and imaging-guided biopsies are replacing non–imaging-guided biopsies.
Radiologists are performing an increasing fraction of biopsies relative to other physicians.
The total number of biopsies being performed grew from 1380 to 1945 per 100 000 Medicare enrollees, which represents a modest compound annual growth rate of 3% between 1997 and 2008.
Implications for Patient Care.
The majority of tissue sampling is now being performed by using percutaneous needle biopsy.
Recent trends suggest that the portion of biopsies performed with imaging guidance will continue to increase.
Supplementary Material
Acknowledgments
The authors thank Rebecca Lewis, MPH, for her assistance with the data sources.
Received November 12, 2009; revision requested January 13, 2010; revision received February 12; accepted March 18; final version accepted March 22.
Funding: This work was supported by a National Institute of Biomedical Imaging and Bioengineering grant (NIH/NIBIB T32 EB001631-05).
Authors stated no financial relationship to disclose.
Abbreviations:
- CAGR
- compound annual growth rate
- CPT
- Current Procedural Terminology
- FNA
- fine-needle aspiration
- IGPB
- imaging-guided percutaneous biopsy
- PNB
- percutaneous needle biopsy
References
- 1.Rosen G. Beginnings of surgical biopsy. Am J Surg Pathol 1977;1(4):361–364 [Google Scholar]
- 2.Grant A, Neuberger J. Guidelines on the use of liver biopsy in clinical practice. British Society of Gastroenterology. Gut 1999;45(suppl 4):IV1–IV11 [DOI] [PMC free article] [PubMed] [Google Scholar]
- 3.White RR, Halperin TJ, Olson JA, Jr, Soo MS, Bentley RC, Seigler HF. Impact of core-needle breast biopsy on the surgical management of mammographic abnormalities. Ann Surg 2001;233(6):769–777 [DOI] [PMC free article] [PubMed] [Google Scholar]
- 4.Rimm DL, Stastny JF, Rimm EB, Ayer S, Frable WJ. Comparison of the costs of fine-needle aspiration and open surgical biopsy as methods for obtaining a pathologic diagnosis. Cancer 1997;81(1):51–56 [DOI] [PubMed] [Google Scholar]
- 5.Milner LB, Ryan K, Gullo J. Fatal intrathoracic hemorrhage after percutaneous aspiration lung biopsy. AJR Am J Roentgenol 1979;132(2):280–281 [DOI] [PubMed] [Google Scholar]
- 6.Altebarmakian VK, Guthinger WP, Yakub YN, Gutierrez OH, Linke CA. Percutaneous kidney biopsies: complications and their management. Urology 1981;18(2):118–122 [DOI] [PubMed] [Google Scholar]
- 7.Burbank F, Kaye K, Belville J, Ekuan J, Blumenfeld M. Image-guided automated core biopsies of the breast, chest, abdomen, and pelvis. Radiology 1994;191(1):165–171 [DOI] [PubMed] [Google Scholar]
- 8.Liberman L. Percutaneous image-guided core breast biopsy. Radiol Clin North Am 2002;40(3):483–500, vi [DOI] [PubMed] [Google Scholar]
- 9.Maya ID, Maddela P, Barker J, Allon M. Percutaneous renal biopsy: comparison of blind and real-time ultrasound-guided technique. Semin Dial 2007;20(4):355–358 [DOI] [PubMed] [Google Scholar]
- 10.Farrell RJ, Smiddy PF, Pilkington RM, et al. Guided versus blind liver biopsy for chronic hepatitis C: clinical benefits and costs. J Hepatol 1999;30(4):580–587 [DOI] [PubMed] [Google Scholar]
- 11.Cesur M, Corapcioglu D, Bulut S, et al. Comparison of palpation-guided fine-needle aspiration biopsy to ultrasound-guided fine-needle aspiration biopsy in the evaluation of thyroid nodules. Thyroid 2006;16(6):555–561 [DOI] [PubMed] [Google Scholar]
- 12.Levin DC, Rao VM, Parker L, Frangos AJ, Sunshine JH. Endovascular repair vs open surgical repair of abdominal aortic aneurysms: comparative utilization trends from 2001 to 2006. J Am Coll Radiol 2009;6(7):506–509 [DOI] [PubMed] [Google Scholar]
- 13.Levin DC, Intenzo CM, Rao VM, Frangos AJ, Parker L, Sunshine JH. Comparison of recent utilization trends in radionuclide myocardial perfusion imaging among radiologists and cardiologists. J Am Coll Radiol 2005;2(10):821–824 [DOI] [PubMed] [Google Scholar]
- 14.Levin DC, Rao VM, Parker L, Bonn J, Maitino AJ, Sunshine JH. The changing roles of radiologists, cardiologists, and vascular surgeons in percutaneous peripheral arterial interventions during a recent five-year interval. J Am Coll Radiol 2005;2(1):39–42 [DOI] [PubMed] [Google Scholar]
- 15.Maitino AJ, Levin DC, Parker L, Rao VM, Sunshine JH. Practice patterns of radiologists and nonradiologists in utilization of noninvasive diagnostic imaging among the Medicare population 1993–1999. Radiology 2003;228(3):795–801 [DOI] [PubMed] [Google Scholar]
- 16.Levin DC, Rao VM, Parker L, Frangos AJ, Sunshine JH. Recent trends in utilization rates of abdominal imaging: the relative roles of radiologists and nonradiologist physicians. J Am Coll Radiol 2008;5(6):744–747 [DOI] [PubMed] [Google Scholar]
- 17.Levin DC, Parker L, Intenzo CM, Sunshine JH. Recent rapid increase in utilization of radionuclide myocardial perfusion imaging and related procedures: 1996–1998 practice patterns. Radiology 2002;222(1):144–148 [DOI] [PubMed] [Google Scholar]
- 18.Levin DC, Parker L, Sunshine JH, Pentecost MJ. Cardiovascular imaging: who does it and how important is it to the practice of radiology? AJR Am J Roentgenol 2002;178(2):303–306 [DOI] [PubMed] [Google Scholar]
- 19.Clarke-Pearson EM, Jacobson AF, Boolbol SK, et al. Quality assurance initiative at one institution for minimally invasive breast biopsy as the initial diagnostic technique. J Am Coll Surg 2009;208(1):75–78 [DOI] [PubMed] [Google Scholar]
- 20.Centers for Medicare & Medicaid Services 2003 and 2009 Medicare trustees report. http://www.cms.hhs.gov/ReportsTrustFunds Accessed October 14, 2009
- 21.Medicare Payment Advisory Comission Report to the Congress: improving incentives in the Medicare program. http://www.medpac.gov/documents/Jun09_EntireReport.pdf. Published June 2009.Accessed October 15, 2009
- 22.Bhargavan M, Sunshine JH. Utilization of radiology services in the United States: levels and trends in modalities, regions, and populations. Radiology 2005;234(3):824–832 [DOI] [PubMed] [Google Scholar]
- 23.Killeen RP, Dodd JD, Cury RC. Noncardiac findings on cardiac CT. I: Pros and cons. J Cardiovasc Comput Tomogr 2009;3(5):293–299 [DOI] [PubMed] [Google Scholar]
- 24.Sánchez-Martín FM, Millán-Rodríguez F, Urdaneta-Pignalosa G, Rubio-Briones J, Villavicencio-Mavrich H. Small renal masses: incidental diagnosis, clinical symptoms, and prognostic factors. Adv Urol 2008310694. [DOI] [PMC free article] [PubMed] [Google Scholar]
- 25.Nov. 8-FDA Mammography Advisory Committee votes to include stereotactic breast biopsy under MQSA regulations. ADVANCE for Imaging and Radiation Oncology Web site. http://imaging-radiation-oncology.advanceweb.com/Editorial/Content/Editorial.aspx?CC = 101185. Published November 2007.Accessed October 15, 2009
- 26.Sunshine JH, Bansal S, Evens RG. Radiology performed by nonradiologists in the United States: who does what? AJR Am J Roentgenol 1993;161(2):419–429; discussion 430–431 [DOI] [PubMed] [Google Scholar]
Associated Data
This section collects any data citations, data availability statements, or supplementary materials included in this article.


