

We observed compensatory remodeling of the internal carotid artery associated with greater maximum wall thickness, without a reduction in lumen area, below a wall thickness of 1.38 mm, which was the 69th percentile in a population-based sample of older adults.
Abstract
Purpose:
To determine the extent of thickening of the carotid arterial walls that may be accommodated by outward remodeling.
Materials and Methods:
Institutional review board approval was obtained at each participating site, and informed consent was obtained from each participant. All study sites conducted this study in compliance with HIPAA requirements. A total of 2066 participants (age range, 60–85 years) from the Atherosclerosis Risk in Communities (ARIC) study were enrolled in the ARIC Carotid MRI Study. Maximum wall thickness and luminal area were measured with gadolinium-enhanced magnetic resonance (MR) imaging in both common carotid arteries (CCAs) and in one internal carotid artery (ICA) 2 mm above the flow divider. Complete data were available for 1064 ICAs and 3348 CCAs. The association of maximum wall thickness with lumen area was evaluated with linear regression, and adjustments were made for participant age, sex, race, height, and height squared.
Results:
In the ICA, lumen area was relatively constant across patients with a wall thickness of 1.38 mm or less. In patients with a wall thickness of more than 1.38 mm, however, lumen area decreased linearly as wall thickness increased. Wall area represented a median of 61.9% of the area circumscribed by the vessel at a maximum wall thickness of 1.50 mm ± 0.05 (standard deviation) and 75.4% at a maximum wall thickness of 4.0 mm ± 0.10. In the CCA, lumen area was preserved across wall thicknesses less than 2.06 mm, representing 99% of vessels.
Conclusion:
Atherosclerotic thickening in the ICA appears to be accommodated for vessels with a maximum wall thickness of less than 1.5 mm. Beyond this threshold, greater thickness is associated with a smaller lumen. The CCA appears to accommodate a wall thickness of less than 2.0 mm. These estimates indicate that the carotid arteries are able to compensate for a greater degree of thickening than are the coronary arteries.
© RSNA, 2010
Introduction
Thickening of the arterial wall may be accommodated by outward remodeling of the vessel, thereby preserving the luminal area. One must understand the relationship between the luminal area and vessel wall disease to understand the natural history of atherosclerotic lesions and interpret angiographic findings, which focus on the vessel lumen. Beyond a threshold in plaque growth, however, this compensatory remodeling may be inadequate to fully maintain the lumen, and any further increase will result in luminal narrowing. In the left main coronary artery, this threshold has been reported as the point at which the vessel wall area comprises 40% of the area circumscribed by the internal elastic lamina. Results of pathologic analyses suggest that the proportion of the vessel wall area that can be accommodated by outward remodeling in the common carotid artery (CCA) is quantitatively similar to that of the coronary arteries (1).
Although outwardly remodeled coronary arteries accommodate plaque growth in the vessel wall, they may be particularly vulnerable to plaque rupture, and they are associated with acute coronary syndromes (2). The clinical correlates of remodeling in carotid arteries are unclear (3,4). Plaque rupture in the carotid arteries leads to cerebrovascular disease, typically from distal embolization. Inadequate accommodation of plaque in a carotid vessel, however, may compromise the lumen and contribute to cerebral hypoperfusion.
On the basis of ultrasonographic (US) measurements of the lumen diameter and intima-media thickness (IMT), we reported greater compensatory remodeling in the CCA, which is an elastic vessel, than in the more muscular internal carotid artery (ICA) (5). This finding was replicated in patients with coronary artery disease (6), but evidence of differential remodeling from population-based studies is limited. The known measurement limitations of US, including the lack of circumferential measurements of wall thickness and lumen area with measurements limited to arterial walls perpendicular to the imaging axis, also limit the conclusions that can be drawn from these studies.
The purpose of this study was to determine the extent of thickening of the carotid arterial walls that may be accommodated by outward remodeling.
Materials and Methods
Study Population
Institutional review board approval for this study was obtained at each participating site, and informed consent was obtained from each participant. All sites conducted this study in compliance with the Health Insurance Portability and Accountability Act. Study participants were selected from the Atherosclerosis Risk in Communities (ARIC) study cohort (7). The ARIC study is a prospective biracial observational cohort of 15 792 individuals aged 45 to 64 years recruited from a probability sample of four communities (Forsyth County, NC; Jackson, Miss; suburban Minneapolis, Minn; and Washington County, Md). Participants took part in clinic examinations, starting with a baseline visit between 1987 and 1989 and continuing with three follow-up examinations at approximately 3-year intervals, at which point carotid artery IMT was measured with B-mode US (8).
Participants in the ARIC Carotid MRI Study were selected from among the surviving ARIC study participants with a stratified sampling plan on the basis of the most recent IMT and field center. The goal was to recruit 1200 participants with high values of maximum carotid artery IMT (maximum over six sites: left and right CCA, carotid bifurcation, and ICA) at their most recent US examination (examination 3 or 4, performed between 1993 and 1995 or between 1996 and 1998, respectively) and 800 individuals who were selected randomly from among the remaining eligible participants. Field center–specific cutoff points of carotid IMT were adjusted over the recruitment period to approximately achieve this goal, with 100% sampling above the cutoff point and a sampling fraction (16.5%–25.5%) below the cutoff point. The cutoff point was 1.135 mm in Forsyth County, NC; 1.000 mm in Jackson, Miss; 1.280 mm in suburban Minneapolis, Minn; and 1.215 mm in Washington County, Md; representing the 73rd, 69th, 73rd, and 68th percentiles of maximal IMT from examination 4, respectively.
Persons who were not black or white (n = 10 in Forsyth County, NC) were excluded from the selection process, as were those without IMT measurements at examination 3 or 4 (n = 1428). A total of 4306 persons were contacted and invited to participate in the study. Of these, 1403 refused, 837 were ineligible, and 2066 participated (1250 with high IMT, 816 with low IMT). Participants with contraindications to magnetic resonance (MR) imaging or contrast media were excluded (n = 206), as were participants who had difficulty understanding questions or providing informed consent (n = 51), those who had undergone prior carotid revascularization on either side (for the low IMT group) or on the side selected for imaging (for the high IMT group) (n = 58), and those who could not participate because of a self-reported health problem (n = 486) or another reason (n = 36). Of the 2066 participants, 1939 had undergone MR imaging, and 1769 MR studies were of sufficient quality and adherence to the MR imaging protocol to merit inclusion.
MR Imaging Methods
Black-blood MR images were acquired by using a two-dimensional cardiac-gated double inversion-recovery fast spin-echo sequence that was based on a standardized protocol (9,10) and the following parameters: field of view, 13 cm; section thickness, 2 mm; matrix, 256 × 224; echo train length, 10; one signal acquired; and acquired resolution, 0.51 × 0.58 × 2 mm. Three long-axis black-blood MR imaging sections (repetition time msec/echo time msec/inversion time msec, two R-R intervals/5/600) were acquired through each carotid artery bifurcation by using a time-of-flight MR angiogram as a scout image (Fig 1). The black-blood MR image that best depicted the bifurcation, including the flow divider, was used to orient all transverse T1-weighted black-blood MR images. The transverse sections were acquired (repetition time msec/echo time msec, one R-R interval/5) with chemical suppression of fat signal before and 5 minutes after the intravenous injection of gadodiamide (0.1 mmol per kilogram of body weight; Omniscan, GE Healthcare, Prineton, NJ) with a power injector. The inversion time was changed to 200 msec for postcontrast images to enable blood signal suppression. A transverse T1-weighted black-blood MR section was acquired through each distal CCA, positioned 1.5 cm below the flow divider, and oriented perpendicular to the vessel axis (Fig 1). Sixteen contrast-enhanced transverse T1-weighted black-blood MR images (total longitudinal coverage, 3.2 cm) were then acquired through the carotid bifurcation found to have the greatest maximum wall thickness at the participant’s most recent US examination (Fig 2). If the contralateral carotid bifurcation wall appeared thicker to the MR imaging technologist on the MR angiographic source images or more stenotic on the MR angiographic maximum intensity projection images, however, this vessel was selected for the multisection acquisition. The sections were oriented perpendicular to the vessel axis and centered at the thickest part of the carotid bifurcation or through the flow divider if no plaque was present. Analyses were repeated after excluding 34 vessels that were oriented obliquely (≥25%), with nearly identical results. We used ICA measurements from the section located one section (2 mm) above the flow divider for the present analysis.
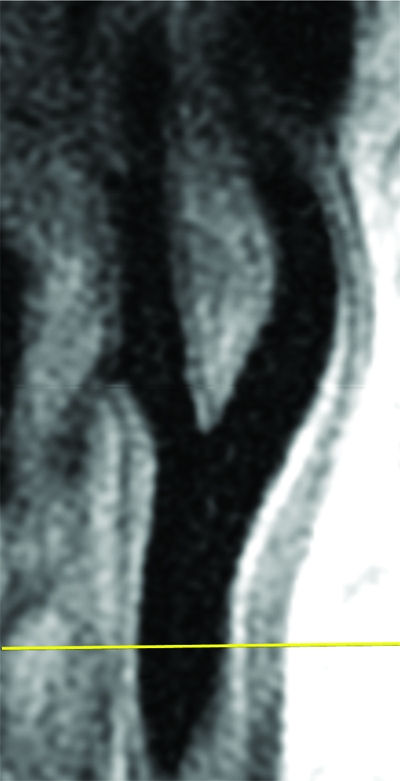
Figure 1a:
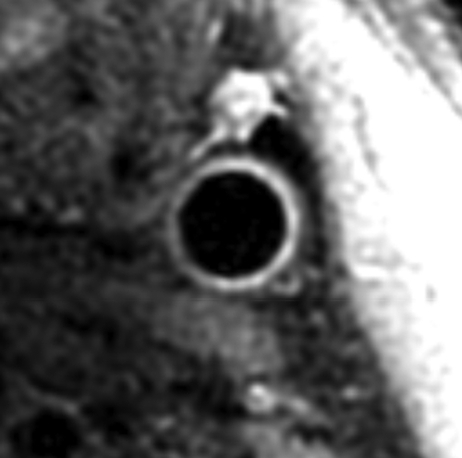
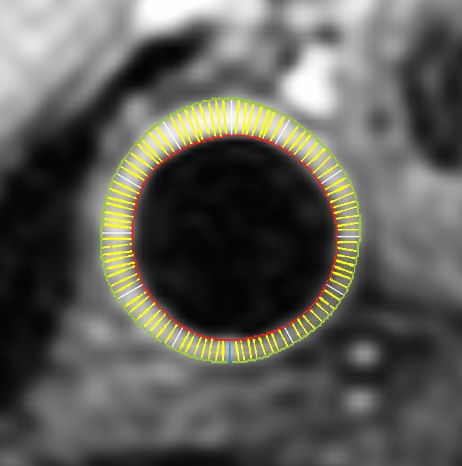
Black-blood MR images through the CCAs of a 71-year-old man. (a, b) Long-axis images through the (a) right and (b) left carotid bifurcation were used to orient subsequent images. (c, d) Contrast material–enhanced T1-weighted transverse images through the (c) right and (d) left CCA were positioned 1.5 cm below the flow divider (yellow lines in a and b). (e, f) Magnifications of c and d. Contours were drawn to delineate the lumen (red circle) and outer wall (green circle) on each image, and the wall was automatically divided into 12 radial segments (white lines). Wall thickness measurements (average of the yellow line thicknesses) and area measurements were generated for each segment and for the entire wall; area measurements were generated for the lumen.
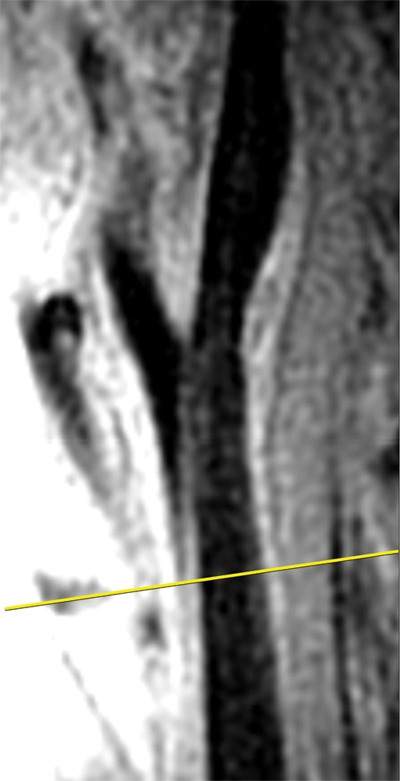
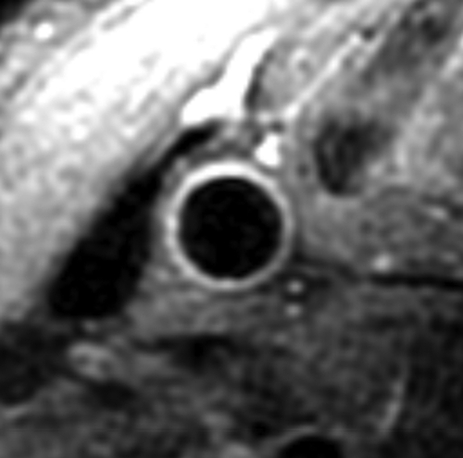
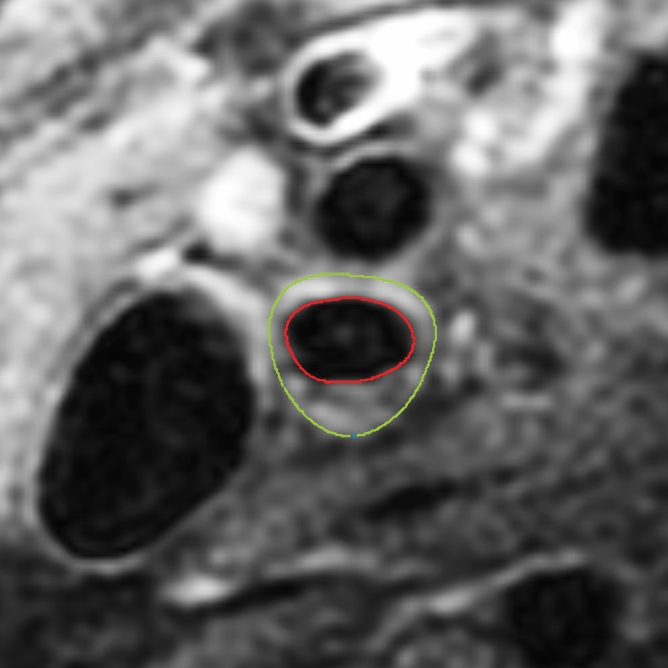
Figure 2a:
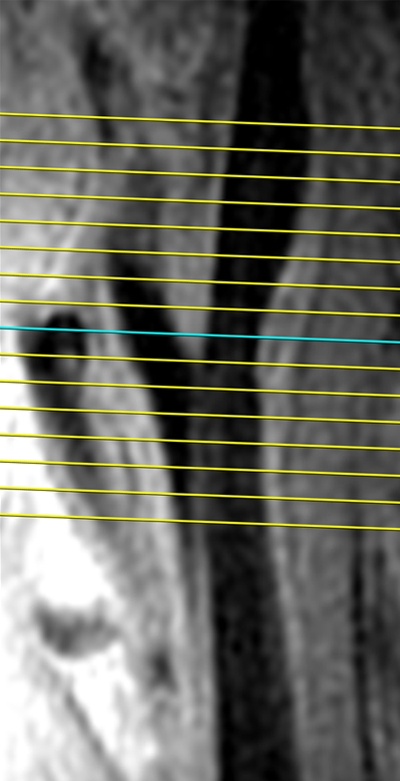
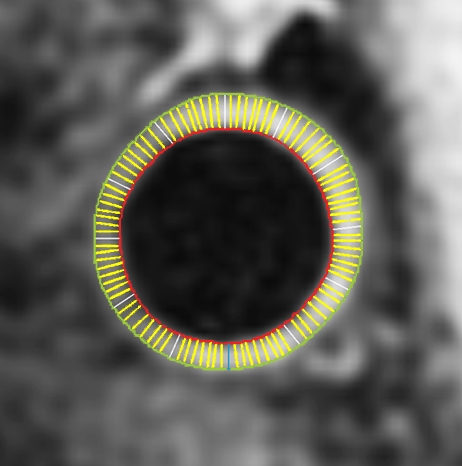
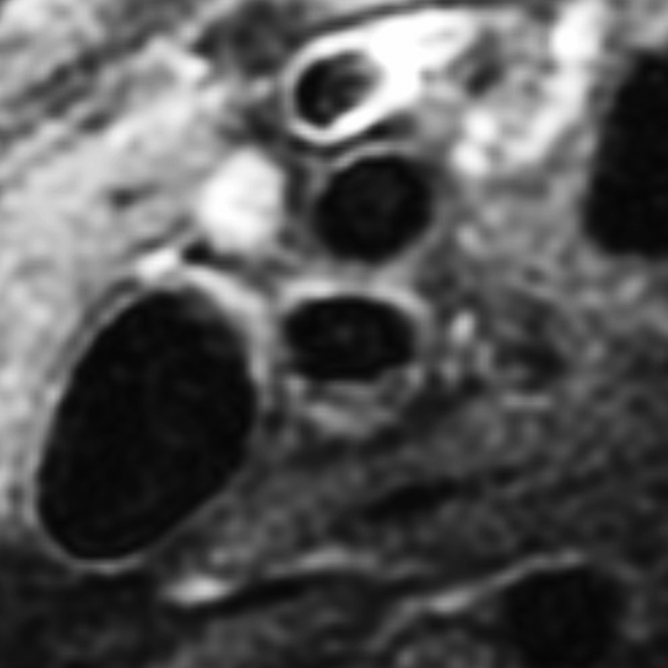
Black-blood MR images obtained through the carotid bifurcation plaque of the same 71-year-old man as in Figure 1. (a) Long-axis image through the thicker carotid bifurcation was selected to orient 16 contrast-enhanced T1-weighted transverse black-blood MR images (yellow lines) centered at the thickest wall or plaque. (b) For this study of remodeling, only the image located one section (2 mm) above the flow divider (blue line in a) was analyzed. (c, d) Contours were drawn to delineate the lumen (red circle), outer wall (green circle), and lipid core (blue line), and the wall was automatically divided into 12 radial segments (white lines in d); thickness and area measurements were generated.
Figure 1b:
Black-blood MR images through the CCAs of a 71-year-old man. (a, b) Long-axis images through the (a) right and (b) left carotid bifurcation were used to orient subsequent images. (c, d) Contrast material–enhanced T1-weighted transverse images through the (c) right and (d) left CCA were positioned 1.5 cm below the flow divider (yellow lines in a and b). (e, f) Magnifications of c and d. Contours were drawn to delineate the lumen (red circle) and outer wall (green circle) on each image, and the wall was automatically divided into 12 radial segments (white lines). Wall thickness measurements (average of the yellow line thicknesses) and area measurements were generated for each segment and for the entire wall; area measurements were generated for the lumen.
Figure 1c:
Black-blood MR images through the CCAs of a 71-year-old man. (a, b) Long-axis images through the (a) right and (b) left carotid bifurcation were used to orient subsequent images. (c, d) Contrast material–enhanced T1-weighted transverse images through the (c) right and (d) left CCA were positioned 1.5 cm below the flow divider (yellow lines in a and b). (e, f) Magnifications of c and d. Contours were drawn to delineate the lumen (red circle) and outer wall (green circle) on each image, and the wall was automatically divided into 12 radial segments (white lines). Wall thickness measurements (average of the yellow line thicknesses) and area measurements were generated for each segment and for the entire wall; area measurements were generated for the lumen.
Figure 1d:
Black-blood MR images through the CCAs of a 71-year-old man. (a, b) Long-axis images through the (a) right and (b) left carotid bifurcation were used to orient subsequent images. (c, d) Contrast material–enhanced T1-weighted transverse images through the (c) right and (d) left CCA were positioned 1.5 cm below the flow divider (yellow lines in a and b). (e, f) Magnifications of c and d. Contours were drawn to delineate the lumen (red circle) and outer wall (green circle) on each image, and the wall was automatically divided into 12 radial segments (white lines). Wall thickness measurements (average of the yellow line thicknesses) and area measurements were generated for each segment and for the entire wall; area measurements were generated for the lumen.
Figure 1e:
Black-blood MR images through the CCAs of a 71-year-old man. (a, b) Long-axis images through the (a) right and (b) left carotid bifurcation were used to orient subsequent images. (c, d) Contrast material–enhanced T1-weighted transverse images through the (c) right and (d) left CCA were positioned 1.5 cm below the flow divider (yellow lines in a and b). (e, f) Magnifications of c and d. Contours were drawn to delineate the lumen (red circle) and outer wall (green circle) on each image, and the wall was automatically divided into 12 radial segments (white lines). Wall thickness measurements (average of the yellow line thicknesses) and area measurements were generated for each segment and for the entire wall; area measurements were generated for the lumen.
Figure 1f:
Black-blood MR images through the CCAs of a 71-year-old man. (a, b) Long-axis images through the (a) right and (b) left carotid bifurcation were used to orient subsequent images. (c, d) Contrast material–enhanced T1-weighted transverse images through the (c) right and (d) left CCA were positioned 1.5 cm below the flow divider (yellow lines in a and b). (e, f) Magnifications of c and d. Contours were drawn to delineate the lumen (red circle) and outer wall (green circle) on each image, and the wall was automatically divided into 12 radial segments (white lines). Wall thickness measurements (average of the yellow line thicknesses) and area measurements were generated for each segment and for the entire wall; area measurements were generated for the lumen.
Figure 2b:
Black-blood MR images obtained through the carotid bifurcation plaque of the same 71-year-old man as in Figure 1. (a) Long-axis image through the thicker carotid bifurcation was selected to orient 16 contrast-enhanced T1-weighted transverse black-blood MR images (yellow lines) centered at the thickest wall or plaque. (b) For this study of remodeling, only the image located one section (2 mm) above the flow divider (blue line in a) was analyzed. (c, d) Contours were drawn to delineate the lumen (red circle), outer wall (green circle), and lipid core (blue line), and the wall was automatically divided into 12 radial segments (white lines in d); thickness and area measurements were generated.
Figure 2c:
Black-blood MR images obtained through the carotid bifurcation plaque of the same 71-year-old man as in Figure 1. (a) Long-axis image through the thicker carotid bifurcation was selected to orient 16 contrast-enhanced T1-weighted transverse black-blood MR images (yellow lines) centered at the thickest wall or plaque. (b) For this study of remodeling, only the image located one section (2 mm) above the flow divider (blue line in a) was analyzed. (c, d) Contours were drawn to delineate the lumen (red circle), outer wall (green circle), and lipid core (blue line), and the wall was automatically divided into 12 radial segments (white lines in d); thickness and area measurements were generated.
Figure 2d:

Black-blood MR images obtained through the carotid bifurcation plaque of the same 71-year-old man as in Figure 1. (a) Long-axis image through the thicker carotid bifurcation was selected to orient 16 contrast-enhanced T1-weighted transverse black-blood MR images (yellow lines) centered at the thickest wall or plaque. (b) For this study of remodeling, only the image located one section (2 mm) above the flow divider (blue line in a) was analyzed. (c, d) Contours were drawn to delineate the lumen (red circle), outer wall (green circle), and lipid core (blue line), and the wall was automatically divided into 12 radial segments (white lines in d); thickness and area measurements were generated.
Image Analysis
Seven analysts were trained by an author (B.A.W., 12 years of experience) to interpret the MR images with semiautomated software (VesselMASS; Division of Image Processing, Radiology Department, Leiden University Medical Center, Leiden, the Netherlands). The analysts were blinded to the characteristics of the study participants. All studies were graded for image quality and adherence to the imaging protocol, and studies that failed were not analyzed. Postcontrast black-blood MR images were analyzed by using semiautomated analysis software, as described previously (11). The vessel walls were divided into 12 radial segments at each section, thickness measurements were taken for each segment, and maximum segmental wall thickness was used for all analyses. The percentage of stenosis was measured by using North American Symptomatic Carotid Endarterectomy Trial criteria (12) and based on the time of flight MR angiogram maximum intensity projection images, unless poor image quality precluded interpretation (7%, 143 participants), in which case the contrast-enhanced MR angiogram maximum intensity projections were used.
Statistical Methods
All analyses were weighted by the inverse of the sampling fractions in the eight sampling strata (four field centers times two IMT groups), such that data from individuals in strata that were proportionally underrepresented (low IMT group) were given less weight in the analyses than were data from individuals in strata that were overrepresented (high IMT group, which had a sampling fraction of 100%). The sampling fractions were based on those persons actually screened for participation rather than on those persons invited to participate. Analyses were performed by an author (L.E.C., 28 years of experience) with SAS (release 9.1; SAS Institute, Cary, NC) and SUDAAN (release 9.0; RTI International, Research Triangle Park, NC) software. Analyses were performed separately for the selected ICA and both CCAs. Left and right CCAs were combined, and analyses accounted for within-person correlation.
The association of maximum wall thickness with lumen area was evaluated with linear regression. We adjusted for participant age, sex, race, height, and height squared because of the strong association of height with both vessel measurements. The mean values presented from these models are adjusted to the study population means for all covariates. The proportion of the total vessel area represented by the vessel wall was calculated for several windows of maximum wall thickness, each either 0.10 or 0.20 mm in width. Linear spline regression models were adjusted for age, sex, race, height, and height squared. They were used to identify the location of the single knot in terms of maximum wall thickness that resulted in the best-fitting model. Additional knots that significantly (P < .05) improved model fit were also located. Model fit was determined by calculating the coefficient of determination for multivariate analysis (R2). Additional models for figures included a third-order polynomial and a piecewise polynomial (linear at the ends, cubic otherwise) with knots (joint points) set at the 5th, 25th, 50th, 75th, and 95th percentiles. Individual data points on the figures also were adjusted to the mean values for the covariates by fitting a model of age, sex, height, and height squared on lumen area and adding the residuals to the mean lumen area. Because of hetroscedasticity (nonconstant variance of wall thickness across the range of lumen area), the following transformation was used before fitting these models: Y = L(WTmax + 1), where Y is the transformed value, L is lumen area, and WTmax is maximum wall thickness. Results were transformed back to the original scale for presentation.
Outliers were excluded from regression analyses and values and were defined as follows: CCAs had a maximum wall thickness greater than 5.0 mm, a lumen area greater than 109 mm2, or both a maximum wall thickness greater than 2.14 mm and a lumen area greater than 95 mm2 (n = 4). ICAs had a lumen area greater than 110 mm2 (n = 4) or a maximum wall thickness greater than 5.3 mm and a transformed value greater than 4.0 mm3 (n = 6).
Results
Maximum wall thickness and lumen area measurements were available for 1064 selected ICAs and 3348 CCAs (both CCAs were imaged). The weighted population mean age of participants with data from any vessel was 70.3 years (Table 1). A total of 56.5% of participants were women, and 19.0% were black. An estimated 1.3% of participants were identified as having a carotid stenosis of at least 50%. The weighted population mean ICA maximum wall thickness was 1.43 mm, and the mean ICA lumen area was 43.5 mm2. Each 1 cm greater height was associated with a 0.40 mm2 greater ICA lumen area after adjusting for sex and race. The weighted population mean CCA maximum wall thickness was 0.95 mm, and the mean CCA lumen area was 38.5 mm2.
Table 1.
Characteristics of 1769 Participants in the ARIC Carotid MR Imaging Study
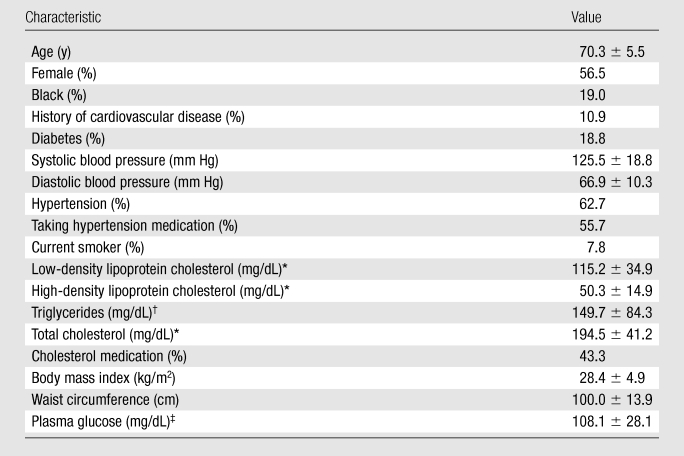
Note.— Unless otherwise indicated, data are means ± standard deviations.
To convert to Systéme International units (millimoles per liter), multiply by 0.02586.
To convert to Systéme International units (millimoles per liter), multiply by 0.01129.
To convert to Systéme International units (millimoles per liter), multiply by 0.05551.
The adjusted mean ICA lumen area was relatively constant for all maximum wall thickness categories less than 1.5 mm but was smaller with greater thickness above this value (Fig 3). Adjusted mean CCA lumen diameters were slightly smaller than those for the ICA at every wall thickness category and remained relatively constant across all maximum wall thickness categories. The mean lumen area of the CCA was smaller than that of the ICA because the CCA was imaged 1.5 cm below the carotid bulb and the ICA was imaged 2 mm above the flow divider and therefore included the carotid bulb.
Figure 3:

Graph shows adjusted mean lumen area by grouped maximum wall thickness and artery. Predicted values and 95% confidence intervals were calculated with a linear regression model and adjusted for age, sex, race, height, and height squared.
Figure 4 shows the adjusted lumen area and maximum wall thickness for the ICA. The best-fitting location for a single knot in a linear spline model was at a maximum wall thickness of 1.38 mm. A total of 68.8% of vessels had a maximum wall thickness below this value, whereas 31.2% had a maximum wall thickness above this value. Below this value, each 1 mm greater maximum wall thickness was associated with a 2.2 mm2 (95% confidence interval: −3.4, 7.8) greater adjusted lumen area. Above this value, each 1 mm greater maximum wall thickness was associated with an 8.7 mm2 (95% confidence interval: 7.4, 10.1) smaller lumen area (P < .001 for difference of slope). The location of the best-fitting knot for the CCA was at a wall thickness of 2.06 mm (Fig 5). Only 1.0% of CCAs had a maximum wall thickness greater than this value. The slope of change in lumen area for each 1 mm greater maximum wall thickness below this value (1.4 mm2; 95% confidence interval: −0.4, 3.2) differed significantly (P = .04) from the slope above this value (−6.0 mm2; 95% confidence interval: −12.8, 0.8). Also shown on the ICA figure is the lumen area predicted with the polynomial and restricted cubic spline models, which closely resemble the results of the single-knot linear spline models. These additional models were not significantly different from the linear spline model for the CCA.
Figure 4:

Graph shows adjusted ICA lumen area by maximum wall thickness. The regression line was calculated with a linear spline regression model and adjusted for age, sex, race, height, and height squared, with a knot at 1.38 mm.
Figure 5:

Graph shows adjusted CCA lumen area by maximum wall thickness. The regression line was calculated with a linear spline regression model and adjusted for age, sex, race, height, and height squared, with knots at 0.88 mm and 2.06 mm.
At a maximum ICA wall thickness of 1.00 mm ± 0.05 (standard deviation), the median proportion of the total vessel area that was represented by the vessel wall was 59.4% (Table 2). This value was similar for maximum wall thickness values near the identified threshold of 1.38 mm but increased at maximum wall thickness values greater than 1.50 mm. The proportion of the total CCA area that was represented by the vessel wall changed minimally over the range of maximum CCA wall thicknesses (Table 3).
Table 2.
Proportion of Total Vessel Area Represented by Wall Area in the ICA
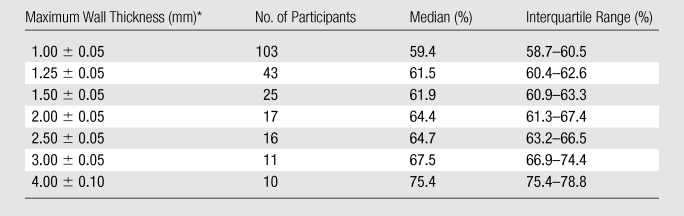
Data are means ± standard deviations.
Table 3.
Proportion of Total Vessel Area Represented by Wall Area in the CCA
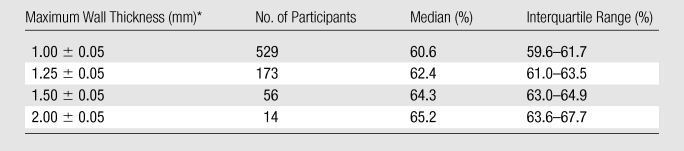
Data are means ± standard deviations.
Discussion
We observed compensatory remodeling of the ICA associated with greater maximum wall thickness without a reduction in lumen area until the maximum wall thickness exceeded 1.38 mm, which was the 69th percentile in a population-based sample with a mean age of 71 years. Above that value, greater maximum wall thickness was associated with a smaller lumen area, with each 1 mm greater maximum wall thickness associated with an average reduction in lumen area of approximately 8.6 mm2, corresponding to an approximately 20% reduction in lumen area. The CCA appeared to accommodate increased wall thickness more effectively, with no significant reduction in lumen area for a wall thickness up to 2.06 mm, which was the 99th percentile in our study population.
At the 1.38-mm threshold, where greater ICA wall thickness began to be associated with reduced luminal area, we estimated that 62% of the total vessel area was occupied by the vessel wall. Glagov et al (13) estimated that coronary artery lumens began to narrow when the plaque burden, defined histologically as the percentage of the area circumscribed by the internal elastic lamina occupied by plaque, reached 40%. We were not able to define the internal elastic lamina with MR imaging, so our vessel wall included the media and adventitia, whereas the plaque measurements reported by Glagov et al (13) included only the intima. This difference may be small in vessels with large plaque, where the greatly enlarged intima represents a larger proportion of the total vessel wall, but it would be more important in vessels without a large plaque. This difference in methods, however, cannot fully explain the difference in the results that we observed in carotid arteries compared with those observed in coronary arteries. These estimates suggest that the ICA is able to compensate for a greater degree of thickening than are the coronary arteries. Our results agree closely with those from a smaller study in which black-blood MR imaging was used and in which it was estimated that 63.1% of the total ICA vessel area was occupied by the vessel wall when 0% area stenosis was observed with contrast-enhanced MR angiography (14).
Pasterkamp et al (1) also reported that remodeling varied among vascular beds. They examined 329 arteries from 49 autopsies and found that outward remodeling occurred in all arterial beds and that the degree of plaque area accommodation by outward remodeling was similar in the coronary artery and the CCA (an estimated 77% of plaque area for both). However, we found significantly less accommodation in the ICA than in the CCA. It is impossible to tell from our data whether this difference was due to compositional differences between the vessels (the CCA is more elastic than the ICA) or differences in size (the CCA is a larger vessel than the ICA).
Available literature on remodeling in the carotid artery is limited (5,6). The findings of a clinical study in patients with more severe disease than was found in our study population agree with our finding of less accommodation in the ICA than in the CCA (6). Other studies, which were restricted to the CCA, yielded conflicting results. While some studies showed that the common carotid lumen was reduced (15), did not vary across categories of US-assessed IMT (3,16,17), or remained stable until an IMT threshold was reached (18,19), others actually showed overcompensation (larger lumens with greater IMT) (6,20–22).
Remodeling of the carotid arteries has not been previously studied in living populations with MR imaging, as previous studies have relied on two-dimensional US imaging. While US offers better resolution, the directionality of the beam limits reliability of measurements for portions of the vessel wall that are not perpendicular to the transducer. We were able to use the maximum wall thickness of any radial segment rather than being limited to far wall values. The use of MR imaging, however, resulted in a relatively high number of unreadable images. We assumed that these data were missing at random with respect to remodeling and did not affect our results. We limited our analysis of the ICA to a single section, located 2 mm above the flow divider, to achieve maximum comparability between subjects.
Our findings are relevant to the cerebrovascular diseases that are associated with extracranial atherosclerosis. Carotid atherosclerosis is associated with not only clinical stroke but also silent infarcts and white matter disease (23,24), and the mechanisms probably relate to plaque rupture, with artery-to-artery emboli or thrombotic occlusion with hypoperfusion of deep subcortical watershed zones (25). In the coronary artery, outward remodeling of the coronary artery is related to arterial plaque rupture and acute coronary events (2,26,27). This is not unexpected, since outwardly remodeled vessels have more hemorrhage (28) and more evidence of inflammation, including those factors thought to affect plaque vulnerability: macrophages, lymphocyte T cells, and matrix metalloproteinases (28–30). Hermans et al (17) recently showed that outward remodeling of the CCA is associated with increased circumferential wall tension, which, in turn, has been linked to large artery stroke (4). Although we do not know the factors that cause the opposite remodeling process (failure to accommodate a large plaque), the risk associated with carotid stenosis, cerebral hypoperfusion with watershed infarcts, is clear (25,31,32).
Limitations of this study included the fact that we were not able to define the internal elastic lamina with MR imaging, thus our vessel wall included both the media and the adventitia, whereas the plaque measurements reported by Glagov et al (13) included only the intima. While this difference is small in vessels with large plaque, where the greatly enlarged intima represents a larger proportion of the total vessel wall, it is more important in vessels without a large plaque. This difference in methods, however, cannot fully explain the difference in the results that we observed in carotid arteries compared with those observed in coronary arteries. Details about interreader variability appear elsewhere (11) and are not provided in this analysis.
We have described the relationship between carotid artery wall thickness and luminal area in a large general population sample of older adults. These findings yield important information necessary for the informed interpretation of angiographic images, which depict only the vessel lumen. It is critical to understand the relationship between vessel wall thickness and luminal area and the factors that affect it in order to advance our knowledge about the natural history of atherosclerotic lesions and the associated risks for cerebrovascular events.
Advances in Knowledge.
Accommodation of mural thickening by outward remodeling of the vessel occurs in the carotid arteries, such that the lumen is preserved until thickening exceeds a threshold; however, the extent of thickening that can be accommodated differs between the internal carotid artery (ICA) and the common carotid artery (CCA).
Thickening of the ICA wall appears to be accommodated for vessels with a maximum wall thickness of less than 1.5 mm; beyond this threshold, greater thickness is associated with a smaller lumen.
The CCA appears to accommodate a wall thickness of less than 2.0 mm.
Acknowledgments
The authors thank the staff and participants of the ARIC study for their important contributions.
Received June 29, 2009; revision requested August 31; revision received January 4, 2010; accepted January 18; final version accepted March 1.
Funding: This research was supported by the National Institutes of Health (grants N01-HC-55015, N01-HC-55016, N01-HC-55018, N01-HC-55019, N01-HC-55020, N01-HC-55021, N01-HC-55022, and U01HL075572-01).
Authors stated no financial relationship to disclose.
Abbreviations:
- ARIC
- Atherosclerosis Risk in Communities
- CCA
- common carotid artery
- ICA
- internal carotid artery
- IMT
- intima-media thickness
References
- 1.Pasterkamp G, Schoneveld AH, van Wolferen W, et al. The impact of atherosclerotic arterial remodeling on percentage of luminal stenosis varies widely within the arterial system: a postmortem study. Arterioscler Thromb Vasc Biol 1997;17(11):3057–3063 [DOI] [PubMed] [Google Scholar]
- 2.Libby P, Theroux P. Pathophysiology of coronary artery disease. Circulation 2005;111(25):3481–3488 [DOI] [PubMed] [Google Scholar]
- 3.Polak JF, Kronmal RA, Tell GS, et al. Compensatory increase in common carotid artery diameter: relation to blood pressure and artery intima-media thickness in older adults—cardiovascular health study. Stroke 1996;27(11):2012–2015 [DOI] [PubMed] [Google Scholar]
- 4.Carallo C, Lucca LF, Ciamei M, Tucci S, de Franceschi MS. Wall shear stress is lower in the carotid artery responsible for a unilateral ischemic stroke. Atherosclerosis 2006;185(1):108–113 [DOI] [PubMed] [Google Scholar]
- 5.Crouse JR, Goldbourt U, Evans G, et al. Arterial enlargement in the atherosclerosis risk in communities (ARIC) cohort: in vivo quantification of carotid arterial enlargement—the ARIC investigators. Stroke 1994;25(7):1354–1359 [DOI] [PubMed] [Google Scholar]
- 6.Terry JG, Tang R, Espeland MA, et al. Carotid arterial structure in patients with documented coronary artery disease and disease-free control subjects. Circulation 2003;107(8):1146–1151 [DOI] [PubMed] [Google Scholar]
- 7.The ARIC investigators The Atherosclerosis Risk in Communities (ARIC) study: design and objectives—the ARIC investigators. Am J Epidemiol 1989;129(4):687–702 [PubMed] [Google Scholar]
- 8.Heiss G, Sharrett AR, Barnes R, Chambless LE, Szklo M, Alzola C. Carotid atherosclerosis measured by B-mode ultrasound in populations: associations with cardiovascular risk factors in the ARIC study. Am J Epidemiol 1991;134(3):250–256 [DOI] [PubMed] [Google Scholar]
- 9.Wasserman BA, Smith WI, Trout HH, 3rd, Cannon RO, 3rd, Balaban RS, Arai AE. Carotid artery atherosclerosis: in vivo morphologic characterization with gadolinium-enhanced double-oblique MR imaging initial results. Radiology 2002;223(2):566–573 [DOI] [PubMed] [Google Scholar]
- 10.Wasserman BA, Sharrett AR, Lai S, et al. Risk factor associations with the presence of a lipid core in carotid plaque of asymptomatic individuals using high-resolution MRI: the multi-ethnic study of atherosclerosis (MESA). Stroke 2008;39(2):329–335 [DOI] [PubMed] [Google Scholar]
- 11.Wasserman BA, Astor BC, Sharrett AR, Swingen C, Catellier D. MRI measurements of carotid plaque in the atherosclerosis risk in communities (ARIC) study: methods, reliability and descriptive statistics. J Magn Reson Imaging 2010;31(2):406–415 [DOI] [PMC free article] [PubMed] [Google Scholar]
- 12.North American Symptomatic Carotid Endarterectomy Trial: methods, patient characteristics, and progress. Stroke 1991;22(6):711–720 [DOI] [PubMed] [Google Scholar]
- 13.Glagov S, Weisenberg E, Zarins CK, Stankunavicius R, Kolettis GJ. Compensatory enlargement of human atherosclerotic coronary arteries. N Engl J Med 1987;316(22):1371–1375 [DOI] [PubMed] [Google Scholar]
- 14.Babiarz LS, Astor B, Mohamed MA, Wasserman BA. Comparison of gadolinium-enhanced cardiovascular magnetic resonance angiography with high-resolution black blood cardiovascular magnetic resonance for assessing carotid artery stenosis. J Cardiovasc Magn Reson 2007;9(1):63–70 [DOI] [PubMed] [Google Scholar]
- 15.Kitamura A, Iso H, Imano H, et al. Prevalence and correlates of carotid atherosclerosis among elderly Japanese men. Atherosclerosis 2004;172(2):353–359 [DOI] [PubMed] [Google Scholar]
- 16.Kiechl S, Willeit J. The natural course of atherosclerosis. II. Vascular remodeling: Bruneck study group. Arterioscler Thromb Vasc Biol 1999;19(6):1491–1498 [DOI] [PubMed] [Google Scholar]
- 17.Hermans MM, Henry RM, Dekker JM, Nijpels G, Heine RJ, Stehouwer CD. Albuminuria, but not estimated glomerular filtration rate, is associated with maladaptive arterial remodeling: the Hoorn study. J Hypertens 2008;26(4):791–797 [DOI] [PubMed] [Google Scholar]
- 18.Kazmierski R, Watala C, Lukasik M, Kozubski W. Common carotid artery remodeling studied by sonomorphological criteria. J Neuroimaging 2004;14(3):258–264 [DOI] [PubMed] [Google Scholar]
- 19.Kawamoto R, Tomita H, Oka Y, Ohtsuka N. Association between risk factors and carotid enlargement. Intern Med 2006;45(8):503–509 [DOI] [PubMed] [Google Scholar]
- 20.Mannami T, Baba S, Ogata J. Potential of carotid enlargement as a useful indicator affected by high blood pressure in a large general population of a Japanese city: the Suita study. Stroke 2000;31(12):2958–2965 [DOI] [PubMed] [Google Scholar]
- 21.Bonithon-Kopp C, Touboul PJ, Berr C, Magne C, Ducimetière P. Factors of carotid arterial enlargement in a population aged 59 to 71 years: the EVA study. Stroke 1996;27(4):654–660 [DOI] [PubMed] [Google Scholar]
- 22.Chironi G, Gariepy J, Denarie N, et al. Influence of hypertension on early carotid artery remodeling. Arterioscler Thromb Vasc Biol 2003;23(8):1460–1464 [DOI] [PubMed] [Google Scholar]
- 23.Manolio TA, Burke GL, O’Leary DH, et al. Relationships of cerebral MRI findings to ultrasonographic carotid atherosclerosis in older adults: the cardiovascular health study—CHS collaborative research group. Arterioscler Thromb Vasc Biol 1999;19(2):356–365 [DOI] [PubMed] [Google Scholar]
- 24.Vermeer SE, Den Heijer T, Koudstaal PJ, et al. Incidence and risk factors of silent brain infarcts in the population-based Rotterdam scan study. Stroke 2003;34(2):392–396 [DOI] [PubMed] [Google Scholar]
- 25.Jellinger KA. The enigma of vascular cognitive disorder and vascular dementia. Acta Neuropathol 2007;113(4):349–388 [DOI] [PubMed] [Google Scholar]
- 26.Schoenhagen P, Ziada KM, Kapadia SR, Crowe TD, Nissen SE, Tuzcu EM. Extent and direction of arterial remodeling in stable versus unstable coronary syndromes: an intravascular ultrasound study. Circulation 2000;101(6):598–603 [DOI] [PubMed] [Google Scholar]
- 27.Iwami T, Nishioka T, Fishbein MC, et al. Coronary arterial remodeling in differing clinical presentations of unstable angina pectoris: an intravascular ultrasound study. Clin Cardiol 2003;26(8):384–389 [DOI] [PMC free article] [PubMed] [Google Scholar]
- 28.Burke AP, Kolodgie FD, Farb A, Weber D, Virmani R. Morphological predictors of arterial remodeling in coronary atherosclerosis. Circulation 2002;105(3):297–303 [DOI] [PubMed] [Google Scholar]
- 29.Varnava AM, Mills PG, Davies MJ. Relationship between coronary artery remodeling and plaque vulnerability. Circulation 2002;105(8):939–943 [DOI] [PubMed] [Google Scholar]
- 30.Pasterkamp G, Galis ZS, de Kleijn DP. Expansive arterial remodeling: location, location, location. Arterioscler Thromb Vasc Biol 2004;24(4):650–657 [DOI] [PMC free article] [PubMed] [Google Scholar]
- 31.Gottesman RF, Sherman PM, Grega MA, et al. Watershed strokes after cardiac surgery: diagnosis, etiology, and outcome. Stroke 2006;37(9):2306–2311 [DOI] [PubMed] [Google Scholar]
- 32.Miklossy J. Cerebral hypoperfusion induces cortical watershed microinfarcts which may further aggravate cognitive decline in Alzheimer’s disease. Neurol Res 2003;25(6):605–610 [DOI] [PubMed] [Google Scholar]