Behçet's disease (BD) is a genetically complex disease of unknown etiology, characterized by recurrent inflammatory attacks affecting orogenital mucosa, eyes, and skin. We performed a GWAS with 311,459 SNPs in 1215 BD patients and 1278 healthy controls from Turkey. We confirmed the known HLA-B51 association and identified a second, independent association within the MHC Class I region. We also found one SNP with genome-wide evidence for association within the gene encoding interleukin-10 (IL10). A meta-analysis including a total of 2430 cases and 2660 controls established associations with the IL10 variant (rs1518111, P=3.54×10⁻¹⁸, odds ratio 1.45 with 95% confidence interval 1.34-1.58) and with a variant located between the interleukin-23 receptor (IL23R) and interleukin 12 receptor β2 (IL12RB2) genes (rs924080, P=6.69×10⁻⁹, odds ratio 1.28 with 95% confidence interval 1.18-1.39). The disease-associated IL10 variant (rs1518111 A allele) was associated with diminished mRNA expression and low protein production, suggesting novel therapeutic targets for BD.
BD is prevalent in Middle Eastern countries with the highest rate (4 in 1000 individuals) found in Turkey. A genetic contribution to BD is supported by the high sibling recurrence risk ratio (λs), estimated from 11.4 to 52.5 in the Turkish population1. HLA-B51 is the most strongly associated known genetic factor2, however it accounts for less than 20% of the genetic risk, even in familial cases3, indicating that genetic factors remain to be discovered. Candidate gene studies and several small GWASs4,5 have examined BD genetics, but the studies have been generally underpowered, making interpretation and replication of the results problematic.
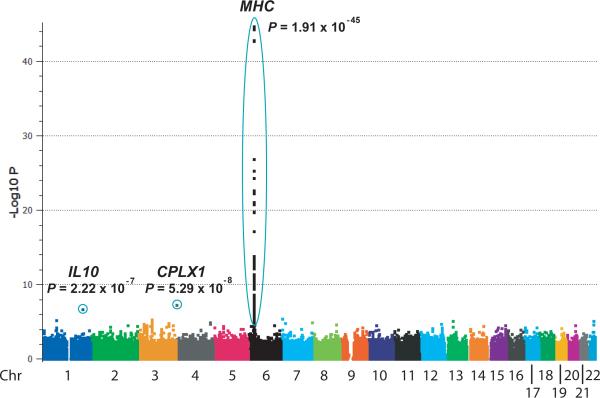
We therefore performed a GWAS of 311,459 autosomal SNPs in 1215 BD cases and 1278 healthy controls from Turkey (Fig. 1, Supplementary Fig. 1, and Supplementary Table 1). Only SNP genotype data that met strict quality control standards (see Online Methods) were included. A principal components method (Online Methods) was used to evaluate population stratification in the cases and the controls. After correction for 6 PCs, λGC, a measure of genomic inflation, was reduced from 1.06 to 1.05 (Supplementary Fig. 2a, b, c). Correcting for 6 PCs in the absence of the strongly associated MHC region SNPs reduced λGC from 1.05 to 1.04 (Supplementary Fig. 2d). Given the minimal degree of population stratification, uncorrected data are presented. P < 5.0 × 10⁻⁸ was considered genome-wide significance.
Figure 1.
Behçet's disease genome-wide association results. The –log10 P values (allelic Chi-squared test) for association of 311,459 autosomal SNPs in 1215 BD cases and 1278 controls from Turkey are shown segregated by chromosome and sorted by genomic position.
The most significantly associated SNPs (P value < 10-44) were located on chromosome 6 in the MHC region. To evaluate the contribution of the HLA-B51 type to BD, we determined the HLA-B types of 1190 of the cases and 1257 of the controls. Occurrence of the HLA-B51 type (one or two copies) was found in 59.1% of cases and only 29.3% of controls (odds ratio = 3.49 [95% CI = 2.95 to 4.12], P = 5.47 × 10-50). Within the HLA-B region the most significantly associated SNPs were located from telomeric to the HLA-B coding region to centromeric to MICA (encoding MHC Class I chain related sequence A), which has been suggested to be the source of the BD-HLA-B51 association6. We found the HLA-B51 type was more strongly associated with disease than was any genotyped SNP (HLA-B51 allele frequency = 0.352 in cases and 0.159 in controls, P = 1.44 × 10-54, Fig. 2). Strong linkage disequilibrium (LD) was observed between HLA-B51 and all the SNPs located from HLA-B to more than 62 kb centromeric to the MICA gene, despite spanning several blocks of LD (Supplementary Fig. 3). This LD pattern is observed because the HLA-B51 variant is found almost exclusively on a single extended haplotype. This extended haplotype occurred at 0.321 frequency in cases and 0.144 frequency in controls. Interestingly, the identical SNP haplotype, but lacking HLA-B51, occurred in cases and controls equally at 0.04 frequency, suggesting that HLA-B51 is required for the disease association in the HLA-B region.
Figure 2.
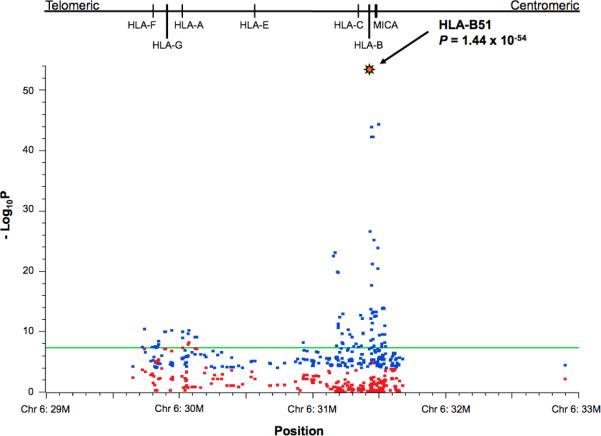
Analysis of associations within the MHC. The 292 SNPs from the MHC region with allelic Chi-squared P < 0.0001 are shown before (blue symbols) and after (red symbols) conditioning for HLA-B51. Blue symbols represent -log10 P (allelic Chi-squared test). Red symbols represent –log10 regressor P-values of the same markers from a logistic regression analysis with HLA-B51 specified as a covariate. The green horizontal line at –log10P = 7.301 corresponds to the genome-wide significance threshold of 5 × 10⁻⁸. The locations of HLA genes are shown above the association graph.
We next performed a conditional logistic regression analysis of the 292 SNPs from the MHC region with allelic Chi-squared P < 0.0001, specifying HLA-B51 as a covariate. None of the HLA-B/MICA region SNPs remained significantly associated with BD in the conditional analysis (Fig. 2). After accounting for the effect of HLA-B51, three SNPs within the HLA-A gene region with disease-associations retained genome-wide significance. The most strongly associated SNP, rs9260997, located 50 kb centromeric to the HLA-A gene, had a regressor P value = 5.49 × 10⁻⁹, suggesting a highly significant association independent of the HLA-B51 association. Coincidentally, an association of markers within the HLA-A region, independent of HLA-B51, was recently described in Japanese BD patients with attribution of the association to the HLA-A26 allele5.
In the association data (Fig. 1) we identified near genome-wide significance for one non-MHC SNP, rs936551 (P = 5.29 ×10⁻⁸), located at the telomeric end of the short arm of chromosome 4, within the promoter region of CPLX1, which encodes complexin-1, a regulator of exocytosis during vesicle membrane fusion. Additionally, one SNP located within the first intron of the IL10 gene, rs3024490, was strongly suggestive for association with a P value = 2.22 × 10⁻⁷ (Fig. 1). We also identified an additional 66 SNPs from an additional 49 chromosomal regions with suggestive evidence for disease association, P < 0.0001 (Supplementary Table 2).
To better evaluate genetic associations within the CPLX1 and IL10 gene regions, we genotyped the same case and control samples for additional SNPs from the regions predicted by HapMap CEU data to be in LD with the disease-associated SNP. We also fine-mapped the IL23R/IL12RB2 region, which was identified in an independent GWAS of Behçet's disease in the Japanese population7 and within which we found three SNPs with p < 0.0001 (Supplementary Table 2).
In the CPLX1 region, the additional genotyped SNPs increased the estimated coverage (at r2 greater than 0.8) of HapMap Phase II SNPs with minor allele frequency greater than 0.05 from 57% to 93%. The most significantly associated SNPs were located in the promoter region of the gene, although none were more significantly associated than rs936551 (Supplementary Fig. 4).
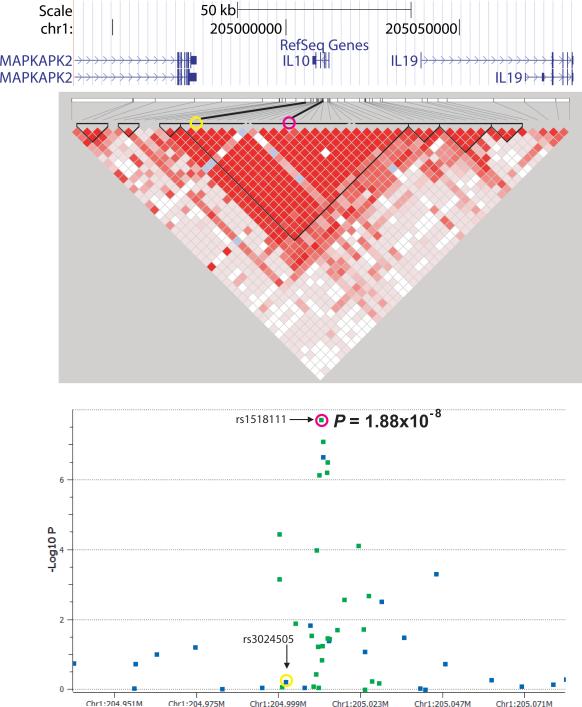
In the IL10 gene region, we genotyped 27 additional SNPs resulting in coverage of 100% of the HapMap Phase II SNPs with greater than 5% minor allele frequency in the CEU samples. Five SNPs were found strongly associated with BD, with one SNP, rs1518111, with genome-wide significance (P = 1.88 × 10⁻⁸, Fig. 3a). The disease-associated SNPs were located in the promoter region and the first, second, and third introns of the gene (Supplementary Fig. 5) and all were in strong LD with one another.
Figure 3.
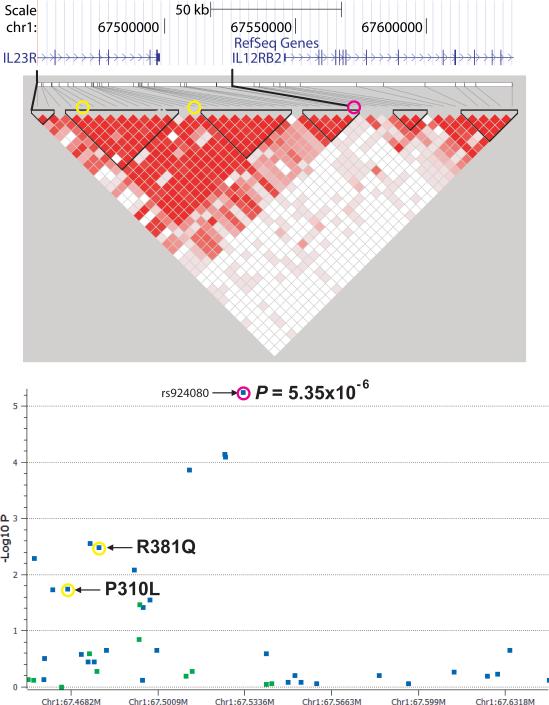
Fine-mapping of the IL10 and IL23R/IL12RB2 regions. Regional association plot and linkage disequilibrium structure of the disease-associated regions surrounding (a) IL10 and (b) IL23R/IL12RB2 showing SNPs genotyped in the genome-wide analysis (blue) and fine-mapping analysis (green). The LD structure of the same regions are shown with red filled squares linking pairs of markers indicating the intensity of LD by intensity of fill, D’= 1 (intense red) to D’ = 0 (no fill). In (a) the pink circles represent rs1518111 and the yellow circles represent rs3024505, which is associated with IBD and SLE. In (b) the pink circles represent rs924080 and the yellow circles represent the IL23R coding variants associated with other seronegative diseases.
In the IL23R/IL12RB2 region we genotyped 11 additional SNPs increasing coverage from 58% to 88% of the HapMap Phase II SNPs with greater than 5% minor allele frequency in the CEU samples. No SNPs were found with stronger association than rs924080 from the GWAS analysis (Fig. 3b). We identified a recombination hotspot located in the intergenic region between IL23R and IL12RB2 (Fig. 3b), which is also seen in the HapMap Caucasian and Asian populations (data not shown). The BD-associated variants were located on the IL23R side of the hotspot, suggesting the disease association is more likely to influence IL23R than IL12RB2. Variants within the IL23R gene have been associated with ankylosing spondylitis8, psoriasis9, and inflammatory bowel disease10, diseases with some phenotypic overlap with each other and with BD. Neither of two IL23R coding variants associated with these seronegative diseases was associated with BD (Fig. 3b).
We genotyped the BD-associated IL10, IL23R/IL12RB2, and CPLX1 SNPs in five additional collections of BD cases and controls from Turkey, the Middle East, Europe, and Asia (see Table 1 and Online Methods). A surrogate marker (rs11248047) was used in the place of the CPLX1 disease-associated SNP (rs936551), which failed quality control in the replication assay (both markers shown in Supplementary Fig. 4). The results are shown in Table 1. A number of the UK Caucasian and Middle Eastern Arab samples were previously tested for association of two IL10 promoter region SNPs with BD. Although an association with disease was reported in the UK collection, the association had not replicated in the Middle Eastern Arab collection11. The BD-associated IL10 SNP identified in the Turkish population, rs1518111, reached statistical significance after correction for three tests (P < 0.017) in the Middle Eastern Arab and Greek collections and was of nominal significance (P < 0.05) in the UK Caucasian collection (Table 1). For the most part, the IL23R/IL12RB2 and CPLX1 SNPs showed the same trend as found in the Turkish samples; however the associations did not reach statistical significance in these smaller collections. Association of these markers was not observed in the small Turkish replication collection. Although this lack of association could be explained by small sample size, an alternative explanation could be that the markers are associated with severe disease, as we have noted that disease manifestations in the replication collection (drawn from a Dermatology clinic) were milder than in the discovery collection used for the GWAS, which was obtained from a Rheumatology clinic.
Table 1.
Association of three SNPs identified in the discovery GWAS in independent collections of BD cases and controls from diverse ethnic backgrounds.
| Sample Collection | # cases | # controls | Allele freq cases | Allele freq ctrls | Chi-squared | ChiSq P-value | Odds ratio | (95% CI) |
|---|---|---|---|---|---|---|---|---|
| rs1518111 (IL10) A/G | ||||||||
| Discovery - Turkish | 1161 | 1221 | 0.38 | 0.30 | 31.62 | 1.88E-08 * | 1.41 | (1.25 - 1.59) |
| Replication - Turkish | 110 | 224 | 0.30 | 0.31 | (0.02) | 0.689 | 0.97 | (0.69 - 1.38) |
| Replication - Middle Eastern Arab | 188 | 163 | 0.35 | 0.26 | 7.15 | 0.007 | 1.56 | (1.12 - 2.16) |
| Replication - Greek | 107 | 84 | 0.40 | 0.27 | 7.21 | 0.007 | 1.41 | (1.26 - 1.59) |
| Replication - UK Caucasian | 120 | 119 | 0.31 | 0.22 | 4.49 | 0.034 | 1.56 | (1.03 - 2.34) |
| Replication - Korean | 77 | 52 | 0.71 | 0.66 | 0.57 | 0.450 | 1.23 | (0.78 - 2.10) |
| Replication - Japanese | 611 | 737 | 0.76 | 0.67 | 29.40 | 5.89E-08 | 1.60 | (1.35 - 1.90) |
| CMH-Meta-analysis | 2374 | 2600 | 75.56 | 3.54E-18 * | 1.45** | (1.34 - 1.58) | ||
| rs924080 (IL23R/IL12RB2) A/G | ||||||||
| Discovery - Turkish | 1213 | 1275 | 0.67 | 0.61 | 20.71 | 5.35E-06 | 1.31 | (1.17 - 1.47) |
| Replication - Turkish | 110 | 220 | 0.64 | 0.65 | (0.05) | 0.818 | 0.96 | (0.69 - 1.35) |
| Replication - Middle Eastern Arab | 165 | 146 | 0.65 | 0.59 | 2.60 | 0.107 | 1.31 | (0.94 - 1.81) |
| Replication - Greek | 102 | 82 | 0.58 | 0.58 | 0.00 | 0.956 | 1.01 | (0.67 - 1.53) |
| Replication - UK Caucasian | 119 | 118 | 0.55 | 0.53 | 0.30 | 0.585 | 1.11 | (0.77 - 1.59) |
| Replication - Korean | 77 | 54 | 0.79 | 0.74 | 0.72 | 0.397 | 1.28 | (0.72 - 2.28) |
| Replication - Japanese | 597 | 720 | 0.76 | 0.70 | 13.54 | 2.34E-04 | 1.39 | (1.17 - 1.65) |
| CMH-Meta-analysis | 2383 | 2615 | 33.62 | 6.69E-09 * | 1.28** | (1.18 - 1.39) | ||
| rs11248047 (CPLX1) G/A | ||||||||
| Discovery - Turkish | 1176 | 1190 | 0.58 | 0.50 | 27.93 | 1.26E-07 | 1.36 | (1.21 - 1.53) |
| Replication - Turkish | 111 | 225 | 0.54 | 0.54 | 0.00 | 0.967 | 0.99 | (0.72 - 1.37) |
| Replication - Middle Eastern Arab | 189 | 163 | 0.60 | 0.56 | 0.68 | 0.409 | 1.13 | (0.84 - 1.53) |
| Replication - Greek | 104 | 84 | 0.55 | 0.51 | 0.49 | 0.485 | 1.16 | (0.77 - 1.74) |
| Replication - UK Caucasian | 116 | 115 | 0.55 | 0.55 | 0.01 | 0.933 | 1.02 | (0.70 - 1.47) |
| Replication - Korean | 75 | 51 | 0.54 | 0.50 | 0.39 | 0.533 | 1.17 | (0.71 - 1.94) |
| Replication - Japanese | 610 | 726 | 0.46 | 0.47 | (0.58) | 0.445 | 0.94 | (0.81 - 1.10) |
| CMH-Meta-analysis | 2381 | 2554 | 13.82 | 0.0002 | 1.16** | (1.07 - 1.27) |
Genome-wide significance (P < 5.0E-08).
Breslow-Day Test for Homogeneity of the Odds Ratios: P =0.54, 0.71, and 0.027 for rs1518111, rs924080, and rs11248047, respectively.
While analyzing these data we learned that another group had also performed a GWAS for Behçet's disease7. We exchanged data for cross validation purposes and found that the IL10 and the IL23R/IL12RB2 SNP associations were also strongly supported by the data obtained from the Japanese population, whereas the CPLX1 association was not observed. A meta-analysis of all the association data (including a total of 2430 BD cases and 2660 controls) provided strong evidence for associations of the IL10 and IL23R/IL12RB2 loci with BD (Table 1). Association of the CPLX1 variant failed to replicate in any of the additional collections and failed to reach genome-wide significant association in a meta-analysis of the data. Analysis of even larger numbers of replication samples will be required to establish whether the CPLX1 locus contributes to BD susceptibility.
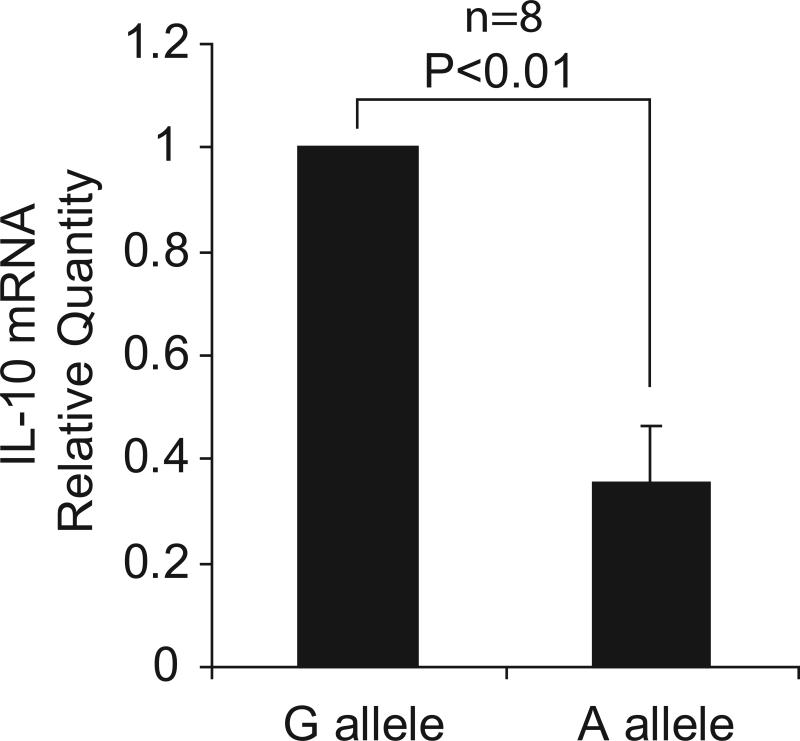
Several SNP haplotypes of the IL10 gene promoter have been reported to be associated with regulation of the gene's expression, but the reported allelic effects have been inconsistent and difficult to reconcile12-14. We therefore tested for a difference in expression of the gene from the disease-associated haplotype and other haplotypes by measuring allelic imbalance of the rs1518111 variant in pre-mRNA from monocytes isolated from 8 healthy individuals heterozygous for the disease-associated allele. In 8 donors, the pre-mRNA transcript with the rs1518111 A allele was found at reduced levels compared with the G allele. Expression from the A bearing chromosome was 35% of expression from the G bearing chromosome (Fig. 4a).
Figure 4.
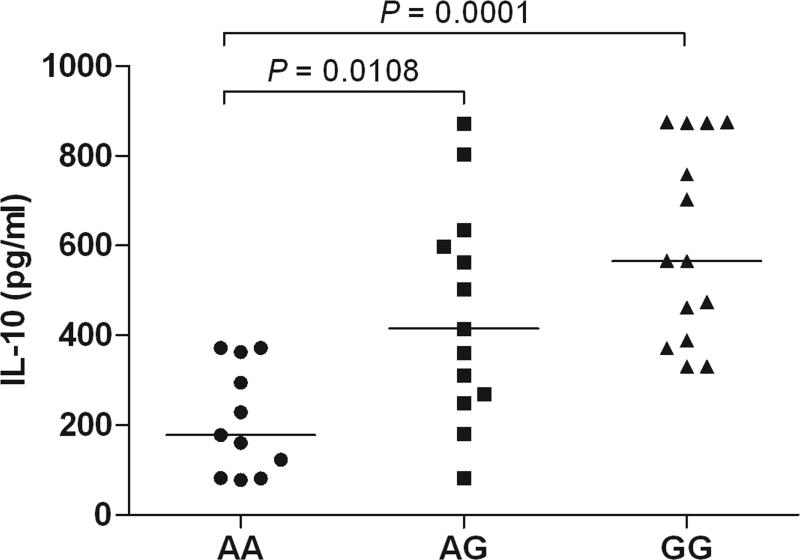
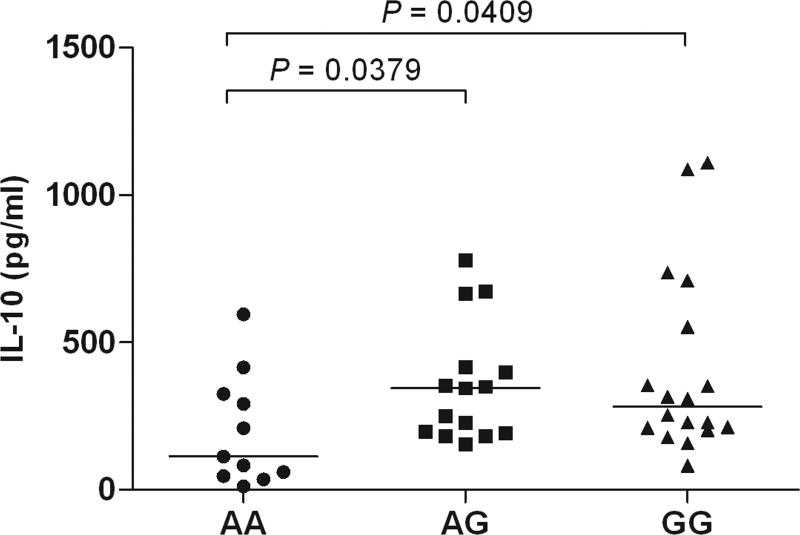
Expression analysis of IL10. (a) Allelic imbalance detected by real time PCR of the IL10 SNP, rs1518111 (A is the BD-associated allele), in pre-mRNA from purified monocytes from healthy, rs1518111 heterozygous blood donors (n=8, p<0.01). The error bar represents the standard deviation. (b) IL-10 production by peripheral blood mononuclear cells isolated from healthy Turkish blood donors measured 24 hr after stimulation with LPS, relative to rs1518111 genotype. (c) IL-10 production by CD14+ monocytes isolated from ethnically diverse, healthy American blood donors measured 24 hr after stimulation with MDP + PAM3Cys, relative to rs1518111 genotype. In (b) and (c) the horizontal lines indicate the medians.
To assess whether this expression difference was relevant in terms of cytokine production, we activated mononuclear cells from healthy Turkish donors with lipopolysaccharide (LPS) and found significantly lower amounts of IL-10 protein in supernatants from donors homozygous for the rs1518111 A allele compared with individuals with one or two G alleles (Fig. 4b). We also cultured monocytes from ethnically diverse healthy donors from the United States and stimulated them with two Toll-like receptor and nucleotide-binding oligomerization domain containing receptor ligands, the lipoprotein, Pam3Cys and muramyl dipeptide. Individuals homozygous for the BD-associated rs1518111 A allele produced significantly less IL-10 than individuals with one or two G alleles (Fig. 4c), whereas no statistically significant variation was found in TNFα production (data not shown).
Taken together, these data suggest that a genetic predisposition for low IL-10 expression is a risk factor for BD. There are extensive data in mouse models linking reduction in IL-10 with inflammation15. Variants in the IL10 gene region have been shown to be associated with ulcerative colitis (UC)16, type I diabetes17, systemic lupus erythematosus18, and severe juvenile rheumatoid arthritis (JRA)12, and IL-10 receptor mutations were recently shown to cause early onset enterocolitis19. Interestingly, the SNP found in the UC, type 1diabetes, and lupus studies, rs3024505, was not associated with BD (Fig. 3a) and the BD-associated IL10 variants were not associated with these three diseases, suggesting a different IL-10-related disease mechanism in BD compared with these other diseases. On the other hand, the IL10 association with severe JRA is the same as for BD.
Variants from several candidate genes have been examined for association with BD. Although no variants within these genes were found with genome-wide significant association in the Turkish GWAS, 6 of the 12 genes examined contained at least one SNP with nominal significance (P < 0.05, Supplementary Table 3). A much larger sample collection will be required to determine whether any of these genes harbor true BD susceptibility alleles.
In summary, this GWAS provides new insights into the genetic factors that contribute to BD. It not only supports the association of HLA-B51 as the primary MHC association with BD, but also reveals another independent MHC Class I association telomeric to the HLA-B gene. Most importantly, this study demonstrates that common variations in the IL10 gene and in the vicinity of the IL23R/IL12RB2 genes predispose to BD. Functional analyses indicate that the disease-associated IL10 variants cause decreased expression of this anti-inflammatory cytokine, and thereby, possibly in concert with commensal microorganisms20, result in an inflammation-prone state, thus suggesting a mechanistic hypothesis and possible therapeutic targets.
Data accession
The genotype data for the 311,459 SNPs in 1215 Behçet's disease cases and 1278 healthy controls from Turkey have been deposited in the National Institutes of Health database of genes and phenotypes, dbGaP (http://www.ncbi.nlm.nih.gov/sites/entrez?db=gap), accession number: phs000272.v1.p1
Supplementary Material
Acknowledgments
This research was supported by the Intramural Research Program of the National Institute of Arthritis and Musculoskeletal and Skin Diseases of the National Institutes of Health, by the Istanbul University Research Fund, and by the UK Behçet's Syndrome Society. We thank all of our patients for their enthusiastic support of our studies aiming to understand and find better treatments for Behçet's disease, and Ms. Omur Aksakalli and Ms. Hatice Ustek for their help in blood collection.
Online Methods
Patients and healthy controls
GWAS samples were collected at the Behçet's Disease Clinic of Istanbul Faculty of Medicine, Division of Rheumatology, one of the largest centers for BD in Turkey, as consecutive patients fulfilling the International Study Group Criteria21. Demographic and clinical characteristics of the patients are given in Supplementary Table 1. Healthy controls were selected among blood bank donors or healthy volunteers to match by geographic location the place of birth of the patients (Supplementary Fig. 1). All healthy controls were questioned for the absence of recurrent oral aphthous ulcers or other BD-related manifestations, or a family history for BD. All study participants provided written informed consent, and the study was approved by the Ethics Committee of the Istanbul Faculty of Medicine.
The replication study samples were from 1) a non-overlapping set of Turkish cases and controls obtained from the Department of Dermatology Behçet's Disease Clinic of the Istanbul Faculty of Medicine, 2) a collection of BD cases and controls of Middle Eastern Arab origin11, 3) a collection of Greek cases and controls22, 4) a collection of UK Caucasian BD cases and controls11, and 5) a collection of Korean BD cases and controls collected at Yonsei University College of Medicine in Seoul, South Korea. All cases fulfilled the International Study Group Criteria.
DNA preparation
Blood samples were collected from all participants and genomic DNA was isolated using the MagNA Pure Instrument with the MagNA Pure Compact DNA Isolation Kit for 1 ml volume (Roche, Mannheim, Germany).
Whole genome SNP typing, quality control, and association analysis
All DNA samples were typed using the Infinium assay (Illumina). The first 332 (146 cases and 186 controls) samples were typed on Human CNV370-Duo v1.0 chips. The remaining 2329 samples (1175 cases and 1150 controls) were typed on Human CNV370-Quad v3.0 chips. Samples with high call rates using Illumina-provided HapMap clusters (greater than 99% on Duo chips and greater than 99.5% on Quad chips) were clustered and these cluster locations were used to determine the genotypes of all the samples. All 2657 samples (1321 cases and 1336 controls) had > 95% call rate. SNPs used in the analysis were located on the autosomes, had > 95% call rate, > 1% minor allele frequency, and Hardy Weinberg equilibrium p-value > 0.00001 determined separately with Duo and Quad chip data. There were 335,887 autosomal SNPs on the Duo and 334,556 SNPs on the Quad chips. Filtering removed 9436 SNPs from the Duo and 11,886 SNPs from the Quad chip data. The Duo and Quad data were merged omitting SNPs not present on both chips (14,970 non-overlapping SNPs from the Duo and 11,188 from the Quad chips). The merged, autosomal data included 311,482 SNPs. Heterozygosity of X chromosome SNPs was used to predict the sex of the samples. We removed 19 samples with sex mismatch. PLINK23 was used to identify samples with genetic relatedness indicating identity (or monozygotic twin) or first, second, or third degree relatives. Only one of each pair of identical samples was included; if however the identity could not be confirmed, both samples were removed. Only one of each pair of first to third degree related samples was included, selecting the sample that was the case or the one with the highest call rate. A total of 145 samples were removed for relatedness. The samples used in the genome-wide association analysis included 1215 cases and 1278 controls. The SNP genotypes from these 2493 individuals were refiltered using the same criteria (> 95% call rate, > 1% minor allele frequency, and Hardy-Weinberg equilibrium > 0.00001) resulting in 311,459 SNPs in the final analysis.
The SNP data were analyzed for SNP association using Sequence Variation Suite 7 (SVS7) software (Golden Helix, Bozeman, Montana). A principal components analysis method was used to detect possible stratification present in the cases and the controls. The genomic inflation factor λGC was 1.06 before correction for the top 6 principal components and 1.05 after correction, and without the MHC region markers was 1.05 without correction and 1.04 with correction for 6 PCs (Supplementary Fig. 2).
Fine map genotyping
Additional SNPs were selected for genotyping in the regions of LD surrounding the disease-associated SNPs identified by the genome-wide association analysis. We used the Tagger algorithm in Haploview24 to select SNPs to augment the coverage of the GWAS SNPs to obtain 100% coverage of the HapMap Phase II SNPs with greater than 5% minor allele frequency in the CEU HapMap population with pairwise r2 > 0.8. Genotyping of the same samples used for the GWAS was performed using the Sequenom iPLEX gold method (Sequenom, San Diego, California). Case and control DNAs were run at the same time and genotypes determined using Typer 4.0 software (Sequenom). Genotype clusters were edited from the combined case and control data without knowledge of the case/control status of individual samples. Of the 30, 13, and 47 SNPs added respectively to the IL10, IL23R, and CPLX1 regions, 26, 11, and 30 SNPs passed quality control. The concordance rate for SNPs genotyped on the Illumina chip and Sequenom iPLEX platforms was 99.83%.
Replication sample genotyping
Replication samples were genotyped for rs1518111, rs924080, and rs11248047 with TaqMan® SNP Genotyping Assays (Applied Biosystems, Foster City, California) using the manufacturer's protocol and recommended quality control measures. Genotype clusters were edited from the combined case and control data without knowledge of the case/control status of individual samples.
HLA-B type analysis
HLA-B types were determined from case and control DNA samples using a reverse sequence-specific oligonucleotide (SSO) method (One Lambda, Canoga Park, California) and a Bio-Plex 200 suspension array system (BioRad, Hercules, California). Samples were scored for 0, 1, or 2 HLA-B51 alleles.
Preparation of PBMCs and monocytes from peripheral blood
Peripheral blood mononuclear cells (PBMCs) were isolated from whole blood by centrifugation through Ficoll-Hypaque solution (Biocall Separation solution cat: L6115, BioChrome AG, Berlin, Germany) and washed twice in phosphate buffered saline (PBS). Cells were resuspended in culture medium at a concentration of 1 × 10⁶ cells per ml. Cells were cultured in complete RPMI 1640 supplemented with 10% heat inactivated fetal bovine serum (cat. SH3008803, Thermo Scientific, Waltham, Massachusetts), 2 mM L-glutamine, penicillin (100 U/mL), streptomycin (100 ug/mL) (cat. 15670-063, Invitrogen) at 37°C in a humidified atmosphere containing 5% CO2 (Thermo Scientific). Monocytes were obtained from PBMCs by negative selection (Monocyte Isolation Kit II; Miltenyi Biotec, Gladbach, Grmany). The monocytes were washed and cultured at 2.5 × 10⁵ cells per ml in RPMI 1640 containing 5% FBS.
Assay for IL10 allelic imbalance
A genotype assay for rs1518111 (C___8828803_1_, Applied Biosystems, Foster City, California), an intronic SNP within the IL10 gene, was used in a quantitative expression assay to compare the relative expression of the disease-associated and the other copy of the IL10 gene in pre-mRNA from heterozygous carriers of the disease-associated haplotype. Monocytes were isolated from heterozygous carriers of the IL10 disease-associated haplotype. Total RNA was treated with DNase I (Invitrogen) prior to synthesis of cDNA, which was used in the assay for relative expression of the two copies of the gene. The expression data were analyzed in triplicate and corrected for the detection difference of the two alleles using genomic DNA from each donor. The relative expression of the disease-associated allele compared with other alleles was determined using the ΔΔCt method:
Relative expression of the A allele compared with the G allele = 2-ΔΔCt
ΔΔCt = (Avg FAM (A) Ct cDNA – Avg FAM (A) Ct gDNA) - (Avg VIC (G) Ct cDNA – Avg VIC (G) Ct gDNA).
The significance of the difference in expression of the A allele relative to the G allele was determined with a Wilcoxon matched pairs signed rank test with P < 0.05 considered significant.
Assay for IL-10 in supernatants of stimulated PBMCs or monocytes isolated from peripheral blood
For LPS-stimulated PBMCs, LPS (E. coli, Serotype O26:B6, cat. L-3274, Sigma Aldrich, St. Louis, Missouri) was added to the cells (1 μg/106 cells) and incubated 24 hours. Supernatants were collected, and IL-10 concentration was analyzed by enzyme-linked immunosorbent assay (ELISA) with a commercially available kit according to manufacturer's protocol (Human IL-10 ELISA Kit, cat. KHC0101, Invitrogen). Absorbance was measured at 450 nm in a DTX 800 Multimode Detector (Beckman Coulter, Brea, California). The assay detection limit was 7.8 pg/ml.
For MDP + Pam3Cys-stimulated monocyte experiments, cells were stimulated for 24 hours with medium, or medium supplemented with MDP (10 μg/ml; Sigma Aldrich) and Pam3Cys (1 μg/ml; InvivoGen, San Diego, California). Supernatants were collected and concentrations of IL-10 and TNF-α were measured with the Bio-Plex Pro Human Cytokine x-plex assay. Data were collected using the Bio-Plex 200 system according to the manufacturer's protocol (Bio-Rad).
A Mann-Whitney test was used to test for significant differences among genotypes with P < 0.05 considered significant. For LPS-stimulated PBMC, 11 homozygotes for the A allele, 13 heterozygotes, and 14 homozygotes for the G allele were used. For the MDP + Pam3Cys stimulated monocytes, 11 homozygotes for the A allele, 18 heterozygotes, and 18 homozygotes for the G allele were used.
Footnotes
None of the authors have competing financial interests.
References
- 1.Gul A, Inanc M, Ocal L, Aral O, Konice M. Familial aggregation of Behcet's disease in Turkey. Ann Rheum Dis. 2000;59:622–5. doi: 10.1136/ard.59.8.622. [DOI] [PMC free article] [PubMed] [Google Scholar]
- 2.de Menthon M, Lavalley MP, Maldini C, Guillevin L, Mahr A. HLA-B51/B5 and the risk of Behcet's disease: a systematic review and meta-analysis of case-control genetic association studies. Arthritis Rheum. 2009;61:1287–96. doi: 10.1002/art.24642. [DOI] [PMC free article] [PubMed] [Google Scholar]
- 3.Gul A, et al. Evidence for linkage of the HLA-B locus in Behcet's disease, obtained using the transmission disequilibrium test. Arthritis Rheum. 2001;44:239–40. doi: 10.1002/1529-0131(200101)44:1<239::AID-ANR31>3.0.CO;2-X. [DOI] [PubMed] [Google Scholar]
- 4.Fei Y, et al. Identification of novel genetic susceptibility loci for Behcet's disease using a genome-wide association study. Arthritis Res Ther. 2009;11:R66. doi: 10.1186/ar2695. [DOI] [PMC free article] [PubMed] [Google Scholar]
- 5.Meguro A, et al. Genetics of Behcet's disease inside and outside the MHC. Ann Rheum Dis. 2010;69:747–754. doi: 10.1136/ard.2009.108571. [DOI] [PubMed] [Google Scholar]
- 6.Mizuki N, et al. Triplet repeat polymorphism in the transmembrane region of the MICA gene: a strong association of six GCT repetitions with Behcet disease. Proc Natl Acad Sci U S A. 1997;94:1298–303. doi: 10.1073/pnas.94.4.1298. [DOI] [PMC free article] [PubMed] [Google Scholar]
- 7.Mizuki N. Pre-publication reference. Nat Genet. In press. [Google Scholar]
- 8.Burton PR, et al. Association scan of 14,500 nonsynonymous SNPs in four diseases identifies autoimmunity variants. Nat Genet. 2007;39:1329–37. doi: 10.1038/ng.2007.17. [DOI] [PMC free article] [PubMed] [Google Scholar]
- 9.Cargill M, et al. A large-scale genetic association study confirms IL12B and leads to the identification of IL23R as psoriasis-risk genes. Am J Hum Genet. 2007;80:273–90. doi: 10.1086/511051. [DOI] [PMC free article] [PubMed] [Google Scholar]
- 10.Duerr RH, et al. A genome-wide association study identifies IL23R as an inflammatory bowel disease gene. Science. 2006;314:1461–3. doi: 10.1126/science.1135245. [DOI] [PMC free article] [PubMed] [Google Scholar]
- 11.Wallace GR, et al. IL-10 genotype analysis in patients with Behcet's disease. Hum Immunol. 2007;68:122–7. doi: 10.1016/j.humimm.2006.11.010. [DOI] [PubMed] [Google Scholar]
- 12.Crawley E, et al. Polymorphic haplotypes of the interleukin-10 5' flanking region determine variable interleukin-10 transcription and are associated with particular phenotypes of juvenile rheumatoid arthritis. Arthritis Rheum. 1999;42:1101–8. doi: 10.1002/1529-0131(199906)42:6<1101::AID-ANR6>3.0.CO;2-Y. [DOI] [PubMed] [Google Scholar]
- 13.Temple SE, et al. Alleles carried at positions -819 and -592 of the IL10 promoter affect transcription following stimulation of peripheral blood cells with Streptococcus pneumoniae. Immunogenetics. 2003;55:629–32. doi: 10.1007/s00251-003-0621-6. [DOI] [PubMed] [Google Scholar]
- 14.Turner DM, et al. An investigation of polymorphism in the interleukin-10 gene promoter. Eur J Immunogenet. 1997;24:1–8. doi: 10.1111/j.1365-2370.1997.tb00001.x. [DOI] [PubMed] [Google Scholar]
- 15.Moore KW, de Waal Malefyt R, Coffman RL, O'Garra A. Interleukin-10 and the interleukin-10 receptor. Annu Rev Immunol. 2001;19:683–765. doi: 10.1146/annurev.immunol.19.1.683. [DOI] [PubMed] [Google Scholar]
- 16.Franke A, et al. Sequence variants in IL10, ARPC2 and multiple other loci contribute to ulcerative colitis susceptibility. Nat Genet. 2008;40:1319–23. doi: 10.1038/ng.221. [DOI] [PubMed] [Google Scholar]
- 17.Barrett JC, et al. Genome-wide association study and meta-analysis find that over 40 loci affect risk of type 1 diabetes. Nat Genet. 2009 doi: 10.1038/ng.381. [DOI] [PMC free article] [PubMed] [Google Scholar]
- 18.Gateva V, et al. A large-scale replication study identifies TNIP1, PRDM1, JAZF1, UHRF1BP1 and IL10 as risk loci for systemic lupus erythematosus. Nat Genet. 2009;41:1228–33. doi: 10.1038/ng.468. [DOI] [PMC free article] [PubMed] [Google Scholar]
- 19.Glocker EO, et al. Inflammatory bowel disease and mutations affecting the interleukin-10 receptor. N Engl J Med. 2009;361:2033–45. doi: 10.1056/NEJMoa0907206. [DOI] [PMC free article] [PubMed] [Google Scholar]
- 20.Rakoff-Nahoum S, Hao L, Medzhitov R. Role of toll-like receptors in spontaneous commensal-dependent colitis. Immunity. 2006;25:319–29. doi: 10.1016/j.immuni.2006.06.010. [DOI] [PubMed] [Google Scholar]
- 21.International_Study_Group_for_Behcet's_Disease Criteria for diagnosis of Behcet's disease. International Study Group for Behcet's Disease. Lancet. 1990;335:1078–80. [PubMed] [Google Scholar]
- 22.Kaklamani VG, Sadim M, Koumantaki Y, Kaklamanis P, Pasche B. Role of polymorphisms in Adamantiades-Behcet's disease. J Rheumatol. 2008;35:2376–8. doi: 10.3899/jrheum.080676. [DOI] [PMC free article] [PubMed] [Google Scholar]
- 23.Purcell S, et al. PLINK: a tool set for whole-genome association and population-based linkage analyses. Am J Hum Genet. 2007;81:559–75. doi: 10.1086/519795. [DOI] [PMC free article] [PubMed] [Google Scholar]
- 24.Barrett JC. Haploview: Visualization and analysis of SNP genotype data. CSH Protoc. 2009;2009 doi: 10.1101/pdb.ip71. pdb ip71. [DOI] [PubMed] [Google Scholar]
Associated Data
This section collects any data citations, data availability statements, or supplementary materials included in this article.


