

Abstract
In a plant, the progression from vegetative growth to reproductive growth is called the floral transition. Over the past several decades, the floral transition has been shown to be determined not by a single gene but by a complicated gene network. This important biological process, however, has not been investigated at a genome-wide network level. We collected Arabidopsis (Arabidopsis thaliana) protein-protein interaction data from several public databases and compiled them into a genome-wide Arabidopsis interactome. Then, we integrated gene expression profiles during the Arabidopsis floral transition process into the established protein-protein interaction network to identify two types of anticorrelated modules associated with vegetative and reproductive growth. Generally, the vegetative modules are conserved in plants, while the reproductive modules are more specific to advanced plants. The existence of floral transition switches demonstrates that vegetative and reproductive processes might be coordinated by the interacting interface of these modules. Our work also provides many candidates for mediating the interactions between these modules, which may play important roles during the Arabidopsis vegetative/reproductive switch.
Flowering is one of the most significant decisions that can occur during a plant life cycle. Plants switch from vegetative growth to flower development only when favorable environmental conditions for reproduction appear (Baurle and Dean, 2006). This biological process has intrigued and puzzled people for centuries. Generally, daylength is one of the key factors for inducing floral development, and the affected organ is the leaf. While the flower develops in the shoot apical meristem, the so-called “florigen” is thought to be generated in the leaves and transported to the shoot apex. It then switches the shoot apical meristem from leaf production to early flower development. After decades of careful work, this mysterious substance has been identified to be the gene product of FLOWERING LOCUS T (FT; Wigge et al., 2005; Corbesier and Coupland, 2006; Corbesier et al., 2007; Turck et al., 2008).
Besides FT, several key regulatory genes of the floral transition process in the model plant Arabidopsis (Arabidopsis thaliana) have been identified. Extensive genetic and molecular analysis has further revealed some regulatory interactions between these genes (Lagercrantz, 2009; Liu et al., 2009; Mutasa-Gottgens and Hedden, 2009). Various pathways controlling the timing of the floral transition have also been elucidated, such as the gibberellin pathway, the ambient temperature pathway, and the light quality pathway (Mockler et al., 2003; Henderson and Dean, 2004). These findings clearly suggest that the plant vegetative/reproductive transition process is controlled by an intricate gene network (Bernier et al., 1993; Jonsson and Krupinski, 2010). However, investigation of this biological process at a large-scale network level has rarely been reported, although the flowering gene network, based on a few core floral genes, was previously addressed (Mendoza and Alvarez-Buylla, 1998; Mendoza et al., 1999; Espinosa-Soto et al., 2004; Alvarez-Buylla et al., 2008).
In the past several years, large-scale protein-protein interaction (PPI) data, gene expression data, and phenotypic data have been generated by high-throughput techniques. There has been an increasingly important need for computational analysis focusing on integrating these data, as such integration could allow us to answer many biological questions at a systems biology level (He et al., 2008; Snyder and Gallagher, 2009). Han et al. (2004) first showed that the dynamics of PPI networks can be deciphered by integrating interactome and gene expression profiles. Later, Piano and coworkers integrated the PPI network, gene expression profiles, and phenotypic profiles to reveal molecular machines involved in Caenorhabditis elegans early embryogenesis (Gunsalus et al., 2005). Similar studies focusing on certain human cellular processes, such as systemic inflammation (Calvano et al., 2005), aging (Xue et al., 2007), and asthma (Hwang et al., 2008), have also been reported. To our knowledge, this type of analysis has not been applied to the plant flowering process. Xia et al. (2006) integrated the human protein interactome with the gene expression profile during the human life cycle to investigate the human aging process, providing a reference pipeline of integrating the interactome and the transcriptome to study certain biological processes.
Similar to the pipeline of Xia et al. (2006), in this work, we analyzed the Arabidopsis floral transition process at a genome-wide network level. First, we combined Arabidopsis PPI data and gene expression data during the floral transition process into an NP network, which consists only of interacting protein pairs with anticorrelated (Negative) or correlated (Positive) gene expression profiles. Second, we performed the network analysis by clustering the NP network into different modules. Each module is a group of genes that are coexpressed during the floral transition process. Finally, we focused on the characterization of two types of transcriptionally anticorrelated modules (V-ally and R-ally; see below), in which vegetative growth and reproductive growth genes, respectively, are enriched. Interestingly, we found that protein complexes and signaling pathways that are involved in flowering control are frequently distributed at the interface between these two types of modules.
RESULTS AND DISCUSSION
The NP Network
Construction of the NP Network
To construct the NP network related to the early floral induction interactome of Arabidopsis, the corresponding interactions and gene expression data were first obtained. Genome-wide Arabidopsis PPI data generated from high-throughput experimental methods are still unavailable. Although the Arabidopsis interactome was predicted using computational tools (Geisler-Lee et al., 2007; Cui et al., 2008; Brandao et al., 2009; Lin et al., 2009), the reliability of these predicted data needs further experimental validation (Shoemaker and Panchenko, 2007). Therefore, we first extracted Arabidopsis PPIs from three publicly available databases, The Arabidopsis Information Resource (TAIR; Swarbreck et al., 2008), IntAct (Hermjakob et al., 2004), and BioGrid (Breitkreutz et al., 2008), which collected experimentally validated PPI data from widely distributed literature. Then, we compiled them into an Arabidopsis PPI data set (Supplemental File S1) that contains a total of 2,303 proteins and 4,660 interactions. Although the size of the data set is relatively small, it represents, to our knowledge, the most comprehensive experimentally verified Arabidopsis interactome. We may further choose those interactions observed by two or more experimental techniques or reported in different literature as “high-confidence” interactions. However, only a few hundred interactions will be kept after such a filtering, which is not enough for a large-scale interactome analysis. Therefore, we did not conduct any filtering to improve the quality of the interaction data.
The transcriptome data used in our work were generated from the shoot apex of the Columbia wild type (Col-0), which was examined at 0, 3, 5, and 7 d after floral induction (long days, 21°C; Schmid et al., 2003). We chose this data set for the following reasons: (1) this data set was generated under the most common conditions used to induce floral development in laboratories; (2) the chip probe design is based on the genome sequence of Col-0, which is the most widely used Arabidopsis wild type in genetic and molecular studies; and (3) gene expression data of the shoot apex could reveal features of the floral transition process (Henderson and Dean, 2004). To test whether the transcriptional changes of genes in different data sets have similar tendencies or not, we compared the transcriptome data used in our work with another independent data set (http://www.ebi.ac.uk/microarray-as/ae/; ArrayExpress accession no. E-MEXP-728). Since these two data sets were generated with similar experimental conditions, the correlation of a gene's expression profiles in these two data sets, measured by Pearson correlation coefficient (PCC), can provide indirect evidence of the quality of this gene's expression profile in the data set used in our work. We found that the correlation (i.e. the average PCC value) between these two data sets is significantly higher than the one between the data set used in our work and a randomly generated microarray data set (one-tailed t test, P = 4.33 × 10⁻¹⁷), implying that both the data sets follow relatively similar trends in transcriptional changes.
The obtained gene expression data were integrated into the Arabidopsis PPI data set to construct an NP network. The PPIs with correlated or anticorrelated gene expression profiles were defined as correlated (positive) or anticorrelated (negative) interactions. We only considered correlated or anticorrelated interactions in constructing the NP network, as these interactions are biologically active during the floral transition process (Dhillon et al., 2003; Qian et al., 2003). PCC was employed to examine the correlation between two gene expression profiles. A PCC value of 1 stands for perfect correlation and −1 stands for complete anticorrelation. PCC values of 0.4/−0.4 were used as cutoff values for correlated/anticorrelated interactions. In other words, only interactions in the Arabidopsis PPI data set with PCC values greater than 0.4 or less than −0.4 were retained. Additionally, self-interactions and interactions without gene expression profiles for any one of the interacting proteins were discarded. The resulting subnetwork, called the NP network, consisted of 1,353 proteins and 1,703 interactions (1,098 positive interactions and 605 negative interactions; Supplemental File S2).
The Partition of the NP Network
Using Cluster and Treeview (Eisen et al., 1998), seven clusters were generated from the gene expression data of the NP network (Fig. 1, A and B; Supplemental File S2). To avoid confusion, the clusters originating from the gene expression profile analysis were referred to as modules at the network level. Intramodule interactions are maximally correlated, while nearly all anticorrelated interactions are distributed between modules. More details about the partition of the NP network are outlined in “Materials and Methods.”
Figure 1.


The partition of the NP network. A, Seven modules of the NP network. Two of the modules were named VP (green) and RP (orange), according to their transcriptional differences. The other five were named MR (khaki), DP (red), PS (cyan), SU (blue), and MP (purple), according to their enriched biological functions. Proteins are shown as nodes, and interactions are represented as lines. Correlated and anticorrelated interactions are colored red and green, respectively. Stronger correlations are represented by deeper colors. This image was generated by Cytoscape (http://www.cytoscape.org/). B, Clustering of gene expression profiles. The gene expression data of each gene in the NP network were clustered through Cluster and Treeview. Arabidopsis genes were clustered on the vertical dimension based on their expression similarity. The RP gene cluster is anticorrelated with the VP gene cluster. Genes in the RP cluster are up-regulated, while the genes in the VP cluster are down-regulated during the floral transition process. C, The number of interactions between/within modules. The number in parentheses is the total number of interactions. The number in front of the parentheses represents correlated interactions when it is under the dashed line, and it represents anticorrelated interactions when it is above the dashed line. The color scheme of each unit is chosen according to the proportion of anticorrelated or correlated interactions. D, Evolutionary differences of modules. AT, PT, PP, CR, and MB represent Arabidopsis, P. trichocarpa (tree), P. patens (moss), C. reinhardtii (alga), and M. brevicollis (protozoa), respectively. In this work, a BLAST e-value cutoff value of 10−12 and a sequence identity cutoff value of 25% were jointly used to define the homology between two proteins. The rates of Arabidopsis proteins sharing homology among different species are illustrated by bars with different colors. For example, the purple bar (AT-PT-PP-CR-MB) indicates the rate of Arabidopsis proteins that have homologs in protozoa, alga, moss, and angiosperm, while the blue bar (AT-PT-PP-CR) indicates the rate of Arabidopsis proteins that have homologs in alga, moss, and angiosperm but have no homolog in protozoa.
Generally, these modules are groups of genes coexpressed in the shoot apex during the floral transition and have some specific biological functions. Interestingly, two modules were mainly connected by negative interactions, with an average PCC value of −0.99, indicating that the genes in one module are up-regulated while the genes in the other module are down-regulated during the floral transition process. Since the up-regulated genes might be associated with reproductive development and the down-regulated genes with vegetative development, we defined the two modules as RP (Reproductive Phase) and VP (Vegetative Phase), respectively (Fig. 1B). Furthermore, Gene Ontology (GO; Harris et al., 2004) enrichment analysis showed that the VP module is overrepresented by plant vegetative development-related genes, such as chloroplast organization genes, while the RP module is enriched in flower developmental regulation genes (Table I). These identified biological functions are consistent with the assumption that these two modules are associated with the vegetative and reproductive phase, respectively. The other modules were named according to their enriched biological functions. There are 193, 241, 201, 297, 171, 161, and 89 proteins and 75, 108, 53, 130, 41, 35, and 16 interactions within the VP, RP, MR (Multiple Regulation), DP (Development Process), PS (Photosynthesis), MP (Metabolism and Proliferation), and SU (Small Undetermined) modules, respectively (Table I; Fig. 1C).
Table I. GO enrichment of each module.
The top five overrepresented GO terms in the Biological Process (BP) subcategory and corresponding q values are listed. Associated genes are also provided. The BP keywords are the vocabularies in GO terms (only the BP subcategory) shared by at least 5% of genes in a module.
| Module | GO Accession No. | GO Term | q Value | Gene |
| MP | GO:0022904 | Respiratory electron transport chain | 1.17 × 10⁻⁶ | CI51, At3g52730, SDH1-1, SDH2-2, At2g02050, At5g25450 |
| GO:0045005 | Maintenance of fidelity during DNA-dependent DNA replication | 2.03 × 10⁻⁶ | MSH6, MSH2, MSH7, ATMLH3, MSH3 | |
| GO:0009693 | Ethylene biosynthetic process | 4.88 × 10⁻⁶ | ACS8, ACS7, ACS11, ETO3, ACS4 | |
| GO:0009960 | Endosperm development | 1.87 × 10⁻³ | AGL62, FIS2, MEA | |
| GO:0006417 | Regulation of translation | 2.94 × 10⁻³ | ATAUX2-11, MPC, ETO3 | |
| VP | GO:0009658 | Chloroplast organization | 4.96 × 10⁻⁷ | PHOT1, PDE120, CLPR2, ADL2, GLK2, ATMINE1, FTSZ2-1, STH3, ARC6 |
| GO:0000096 | Sulfur amino acid metabolic process | 6.23 × 10⁻⁶ | ACS5, OASC, ATHMT-1, ATCYSD1, PIL6, AtSerat2;2, AtSera1;1 | |
| GO:0000097 | Sulfur amino acid biosynthetic process | 6.48 × 10⁻⁵ | OASC, ATHMT-1, ATCYSD1, AtSerat2;2, AtSera1;1 | |
| GO:0006534 | Cys metabolic process | 1.28 × 10⁻⁴ | OASC, ATCYSD1, AtSerat2;2, AtSera1;1 | |
| GO:0009813 | Flavonoid biosynthetic process | 1.28 × 10⁻⁴ | DFR, ATOMT1, TT8, STH3, PAP1, ATMYBL2 | |
| BP keyword | Signaling | ABF1, RCD1, CBL6, JAZ1, ATMPK4, ATMPK3, CBL2, CAM9, WOL, ARR5, ABF3, ATNAC3, ARR7, CBL1, ATMYC2 | ||
| BP keyword | Biosynthetic process | DFR, ABI5, MYB113, ATOMT1, CESA8, FAH1, PAP1, TT8, STH3, ATMYBL2, GLK2, ATMYC2 | ||
| MR | GO:0009966 | Regulation of signal transduction | 1.52 × 10⁻⁸ | SLY1, TMAC2, ERS1, FTA, RGL2, SLY2, ATGID1C, ATGGT-IB, TAF12B, CTR1 |
| GO:0009968 | Negative regulation of signal transduction | 1.97 × 10⁻⁵ | TMAC2, ERS1, FTA, RGL2, ATGGT-IB, CTR1 | |
| GO:0009909 | Regulation of flower development | 1.97 × 10⁻⁵ | FY, CO, COL1, ELF8, FIE, VIP4, EMF2, FCA | |
| GO:0009937 | Regulation of gibberellic acid-mediated signaling | 1.83 × 10⁻⁴ | SLY1, RGL2, SLY2, ATGID1C | |
| GO:0006605 | Protein targeting | 2.03 × 10⁻⁴ | MAG2, ATVTI1A, MAG1, ATVTI12, SYP121, TOC159, PEX5 | |
| BP keyword | Signaling | TMAC2, AFP1, TTL, PAD4, EEL, HY5, PIF3, TAF12B, SLY1, BIM1, ATGGT-IB, RGL2, CPK32, CTR1, ATGID1C, FTA, BIN2, CO, ERS1, OBF5, SYP121 | ||
| SU | GO:0045333 | Cellular respiration | 7.65 × 10⁻³ | NAD6, COB, NAD7 |
| GO:0050832 | Defense response to fungus | 7.65 × 10⁻³ | PRL1, BAK1, NPR1, COI1 | |
| GO:0010043 | Response to zinc ion | 1.49 × 10⁻² | CXIP4, At3g22460 | |
| GO:0031348 | Negative regulation of defense response | 1.49 × 10⁻² | NPR1, COI1 | |
| GO:0048440 | Carpel development | 1.49 × 10⁻² | SHP2, SHP1 | |
| PS | GO:0009658 | Chloroplast organization | 4.40 × 10⁻⁸ | CRB, GPRI1, PMI2, CLPP4, CLPC, FTSZ1-1, CLPP6, ATTIC110, CPN60A |
| GO:0019253 | Reductive pentose phosphate cycle | 5.69 × 10⁻⁷ | SBPASE, CP12-2, GAPBGAPB, TIM, At3g04790 | |
| GO:0045038 | Protein import into chloroplast thylakoid membrane | 3.74 × 10⁻⁶ | FFC, CAO, ALB3, PSB29 | |
| GO:0017038 | Protein import | 3.74 × 10⁻⁶ | FFC, CAO, ALB3, CLPC, PSB29, ATTIC110 | |
| GO:0010207 | PSII assembly | 2.74 × 10⁻⁵ | LPA2, PSBO1, PSBO-2, PSB29 | |
| BP keyword | Signaling | PKS1, ARR16, ARR4, ARR15, NDPK2, PIF4, ARR9, BRL2, ARR6, SGT1B | ||
| BP keyword | Light | PKS1, PSBO-2, JAR1, PMI2, PSBO1, ARR4, CAB2, PRN, NDPK2, RBCS1A, PIF4, KAT2, ROC4, CAO | ||
| DP | GO:0009908 | Flower development | 2.53 × 10⁻⁷ | ZTL, LUG, GCR1, MP, AP1, ARF8, HTA11, SEP1, SEP3, SEP2, DCL1 |
| GO:0048364 | Root development | 1.07 × 10⁻⁵ | NIP3;1, NPH4, HBT, XLG3, PIN7, AGG1, AGB1, LHW, MP, JKD | |
| GO:0009736 | Cytokinin-mediated signaling | 1.84 × 10⁻⁵ | AHP2, NIP3;1, AHP1, ARR1, KNAT2, ARR10, AHK2 | |
| GO:0048437 | Floral organ development | 2.62 × 10⁻⁵ | NUA, ROXY1, STM, ATPGP1, AFB3, AG, AP3 | |
| GO:0009909 | Regulation of flower development | 2.62 × 10⁻⁵ | ESD1, NUA, ELF3, UBC1, SEU, BRI1, CRY2, CIB5, CLV2 | |
| BP keyword | Response | NPH4, ATTRX3, CRY1, AGG1, HUB1, CAT2, RIN13, HD1, RPM1, BAG6, ATPGP1, PHYB, RPS2, ATMPK6, AGB1, NPR4, BZO2H1, PUB17, CRY2 | ||
| RP | GO:0009742 | Brassinosteroid-mediated signaling | 3.22 × 10⁻⁷ | GRF2, TTL3, GRF6, GRF8, BZR1, BES1, ASKdZeta |
| GO:0048827 | Phyllome development | 1.74 × 10⁻⁵ | RPN12A, TCP10, HSP81-2, AN3, AtGRF5, AtGRF1, CDC2B, NHX1, RBR1 | |
| GO:0007126 | Meiosis | 2.45 × 10⁻⁵ | ATDMC1, BRCA2V, BRCA2, ATRAD51C, SKP1 | |
| GO:0009909 | Regulation of flower development | 5.65 × 10⁻⁵ | COL2, SEF, ATFYPP3, TFL1, SOC1, FD, FUL, CAL | |
| GO:0009966 | Regulation of signal transduction | 5.65 × 10⁻⁵ | ATCDPK2, RGL1, CIPK15, EBF2, RCN1, PLDALPHA1, GAI | |
| BP keyword | Signaling | GAI, At3g02880, RPT5B, RKL1, AT3G56370, ECT1, ETO1, RGL3, FLS2, RCN1, RAX2, CAM7, CIPK15, ATCDPK2, EDS1, ATHXK1, JAZ3, CAM8, PLDALPHA1, AHBP-1B, RGL1, LFY, ATCUL1, HFR1, PIL5, At1g68400 | ||
| BP keyword | Assembly | TAF4, EIF3E, TAF13, HTB2, TBP2, XPO1A, FUS6, NAP1;2, CSN6A, ATCUL1, FUS5, CSN6B, HTA2 |
In addition to the most significant anticorrelation between VP and RP, more than 75% of the interactions were also anticorrelated in the module pairs VP-MP, MR-MP, DP-MP, PS-SU, RP-SU, DP-PS, and RP-PS (Fig. 1C). Of the seven identified modules in the NP network, four modules (VP, RP, PS, and DP) contributed the top three significantly anticorrelated module pairs (VP-RP, DP-PS, and RP-PS), of which the average PCCs were −0.99, −0.78, and −0.77, respectively. Approximately 40% of all negative interactions in the entire NP network occurred between these four modules. As shown in Table I, VP and PS are associated with plant vegetative growth, while DP and RP are largely associated with plant reproductive growth. Thus, VP and PS are referred to as V-ally (Vegetative Phase Ally), and DP and RP are referred to as R-ally (Reproductive Phase Ally).
To test whether the partition of V-ally and R-ally relies on certain PCC cutoffs, the construction and partition of the NP network were recalculated using two more stringent PCC cutoffs (0.5/−0.5 and 0.6/−0.6). Generally, the more stringent the cutoff, the lower the number of the generated modules. For example, there were five modules identified in the NP network when the PCC cutoff was set to 0.5/−0.5 (Supplemental File S3). When we increased the cut-off up to 0.6/−0.6, only a three-module NP network was identified (Supplemental File S3). One possible explanation is that the ratio of positive interactions in the resulting NP network is augmented as we increase the PCC cutoff (from 65% at 0.4/−0.4 to 70% at 0.6/−0.6). Nevertheless, the partition of V-ally and R-ally is largely stable with the alteration of PCC cutoffs (Supplemental File S3).
To investigate whether genes in the same module can still be coexpressed in other tissues or not, we mapped these genes onto a recently published coexpression gene network called AraGenNet (Mutwil et al., 2010), which can be divided into 181 different groups. Genes in each group share similar expression profiles across 351 microarray data sets, and similar groups are connected (Mutwil et al., 2010). Among seven modules in our NP network, the largest proportions of module members appearing in the same fraction of the coexpression network (i.e. a group and its directly connected neighboring groups) vary from 11% to 36%. Therefore, most genes in the same module are not necessary to be coexpressed in microarray data sets generated from a variety of tissues, indicating that the partition of the NP network is relatively specific to the shoot apex.
Moreover, a series of control experiments showed that the module partition of our NP network cannot be generated from randomized gene expression data or randomized PPI networks. Shuffling the expression values of each gene among different time points or shuffling the expression profiles among genes generated smaller modules (one-sample t test, P < 10−16; Table II). Extremely small modules were generated, and almost no intramodule interaction appeared after shuffling the PCC among interactions (one-sample t test, P < 10−16; Table II). Randomizing the topology of the NP network while keeping the same degree distribution had little impact on module partition, but the resulting modules had relatively little overlap with those identified from the NP network (Table II). These control experiments clearly indicate that the module partition of the NP network is mainly determined by the transcriptome of the shoot apex and the Arabidopsis PPI network.
Table II. The module partitions inferred from the established NP network and some control experiments.
Each control experiment was repeated 100 times, and P values were computed through a one-sample t test.
| Treatment | Protein/Module |
Intramodule PPI/Module |
No. of Modules |
Overlap with the Established NP Network | No. of Pseudomodulesa | |||
| Average | P | Average | P | Average | P | |||
| The established NP network | 193.3 | – | 65.4 | – | 7 | – | – | 0/1 |
| Shuffle among genesb | 142.0 | 3.45 × 10−37 | 34.9 | 4.43 × 10−47 | 9.1 | 1.07 × 10⁻²³ | 68.9% | 18/100 |
| Shuffle expression valuesc | 71.6 | 3.80 × 10−102 | 8.6 | 5.50 × 10−135 | 14.4 | 6.91 × 10−41 | 56.5% | 45/100 |
| Shuffle PCCsd | 15.6 | 8.60 × 10−200 | 0.4 | 8.10 × 10−281 | 90.4 | 2.03 × 10−89 | 74.9% | 100/100 |
| Randomized networke | 178.1 | 8.23 × 10⁻⁵ | 53.1 | 1.58 × 10⁻⁹ | 7.7 | 1.50 × 10⁻⁵ | 63.6% | 19/100 |
The pseudomodule represents the module with few intramodule interactions.
The control experiment was performed by shuffling expression profiles among genes.
The control experiment was carried out by shuffling expression values of each gene among different time points.
The control experiment was performed by shuffling PCC values among PPIs.
We randomized the NP network while keeping the degree distribution, which was used to test whether an artificial network that has the same topology as the established NP network can result in the same module partition.
Evolutionary Traits of Different Modules
These seven identified modules also reveal different evolutionary traits (Fig. 1D). The MP module, which contains basic metabolic genes, is the most highly conserved among the seven modules. More than half of the MP genes are conserved from Monosiga brevicollis (protozoa) to Chlamydomonas reinhardtii (single-celled green alga), Physcomitrella patens (moss), and Populus trichocarpa (angiosperm). By contrast, the MR module is the least conserved, since it is related to the regulation of signal transduction of advanced plants. Approximately 35% of the MR genes are conserved among the four organisms. Sixty-four percent of the VP genes are conserved in plants, and nearly 6% of them are specific to angiosperms, whereas 57% of the RP genes are conserved in plants and 12% of them are angiosperm specific. We found homologs from alga to moss and angiosperm for 65% of the PS genes and 53% of the DP genes, respectively. However, the same percentage of PS and DP genes is conserved in multicellular plants. These observations are consistent with their biological functions. The rate of conserved V-ally proteins from alga to Arabidopsis is significantly higher than that of R-ally proteins (Fisher's exact test, P = 2.39 × 10⁻³). Therefore, V-ally is conserved in plants while R-ally is more specific to advanced plants. The SU module was associated mainly with defense responses, which seems to be unrelated to the floral transition and was found to be the least conserved module in multicellular plants.
Seeking Floral Switches through the Module Interface
The Definition of Module Interface
In this work, the interface between two modules represents the corresponding PPIs between two modules. For example, the VP-RP interface denotes the interacting protein pairs between VP and RP. Moreover, the VP interface proteins represent those proteins in the VP module that have interactions with any other module, and the VP-RP interface proteins specify those proteins that are involved in PPIs between VP and RP. We refer to the interface between V-ally and R-ally as the V-R interface.
Module dissection is likely to be a provisional compartmentalization of biological roles in the cellular network (Tu et al., 2005; Wu et al., 2009). NP network modules may stand for different cellular states during a certain biological process and may control the cellular switch through their interface (Xia et al., 2006). Many floral promoting or repressive genes have been identified previously, and some of them appear on the module interface of our NP network. Interestingly, inhibition of the V-ally interface gene EARLY IN SHORT DAYS4 (ESD4) has been shown to promote the floral transition, while inhibition of the R-ally interface gene SUPPRESSOR OF OVEREXPRESSION OF CO1 (SOC1) leads to the opposite result (Henderson and Dean, 2004). These two genes, together with FT, PHOTOPERIOD-INDEPENDENT EARLY FLOWERING1 (PIE1), and SHORT VEGETATIVE PHASE (SVP), are all present on the V-R interface. All five genes participate in regulation of the floral transition and are potential floral switches (Henderson and Dean, 2004). These findings highlight the importance of the V-R interface during the plant vegetative/reproductive transition. In subsequent sections, we discuss how the network modules in our NP network, especially V-ally and R-ally, control the floral switch through their interface.
Degree of the Interface Proteins
The number of connected neighbors of a node is defined as degree, which is a key parameter in characterizing the network topology. In our work, we found that the probability [P(k)] of nodes having a degree of k follows the scale-free topology [P(k) ∼ 0.56k−1.96]. The scale-free topology is one of the most significant features of the PPI network, which is typically characterized by many nodes with few links and only a few highly connected nodes (Jeong et al., 2001). Those highly connected proteins are called hubs, which generally play central roles in the network (He and Zhang, 2006). We defined the first 2.5% of highly connected proteins as hubs. Interestingly, 79% of the hub proteins are localized on the V-R interface, which indicates the importance of that area. Moreover, we also found that the V-ally and R-ally proteins on the V-R interface have higher degrees than their intramodule counterparts (Mann-Whitney U test, P = 7.77 × 10⁻¹⁶ for V-ally, P = 8.45 × 10⁻⁷ for R-ally). The degrees of V-ally proteins on the V-R interface are 1.9 times those of other V-ally proteins, while the degrees of R-ally proteins on the V-R interface are 2.6 times those of other R-ally proteins. The unusual high degree distribution of V-R interface proteins implies their critical roles in the NP network. One explanation of this phenomenon is that highly connected network components, such as protein complexes, may lie on the V-R interface.
Some Protein Complexes Formed by the V-R Interface Proteins Are Involved in Floral Transition Control
Undoubtedly, the established Arabidopsis PPI data set should contain many protein complexes. Although some protein complexes that have no significant gene expression correlation among their members were discarded when we constructed the NP network, there may still be some complexes on the V-R interface that are due to the unusual high degree distribution of the interface proteins. Since core members of a protein complex tend, in most cases, to have correlated gene expression profiles (Dezso et al., 2003), we attempted to find core members of potential protein complexes by identifying network clusters from the subnetwork consisting of only positive interactions in the NP network. The network clusters identified here are densely connected areas in the subnetwork. A total of 28 network clusters were detected (Table III). Indeed, protein complexes were found to exist in some of these 28 clusters. For instance, cluster 9 contains three experimentally validated complexes, including SHORT ROOT (SHR)/SCARECROW (SCR), SHR/SCR/JACKDAW (JKD), and SHR/SCR/MAGPIE (MGP; Welch et al., 2007). A G-protein heterotrimer is also formed by the three proteins in cluster 21 (Perfus-Barbeoch et al., 2004).
Table III. Clusters in the NP network.
Clusters containing R-ally proteins on the V-R interface are shown in boldface, while clusters containing V-ally proteins on the V-R interface are underlined.
| No. | Seed | Members | Modules |
| 1 | ATHB25 | ATHB23, ATHB29, ATHB28, ATHB33, ATHB34, ATHB31 | DP, MR, RP |
| 2 | AP1 | SEP1, AGL42, SEP2, AGL6, AG, AGL21 | DP, RP |
| 3 | BLH2 | KNAT3, ATOFP1, BLH1, BLH4 | VP, MR |
| 4 | BRCA2V | ATDSS1, ATRAD51, BRCA2, ATDMC1 | RP |
| 5 | AFP3 | AFP2, TMAC2, EEL, AFP1 | MR |
| 6 | DRB5 | DCL1, HYL1, DRB2 | DP, MR |
| 7 | BZO2H3 | ATBZIP53, BZO2H2, GBF5 | MR, DP, RP |
| 8 | TAF12 | TAFII15, TAF12B, TAF6B | DP, MR |
| 9 | JKD | SHR, MGP, SCR | DP, RP |
| 10 | PGR5-LIKE A | ATLFNR2, ATLFNR1, FEDA | VP, PS |
| 11 | SR1 | RSZ33, SCL30, SRZ21 | DP, SU |
| 12 | ACS8 | ACS4, ETO3, ACS7 | MP |
| 13 | ATPHB1 | ATPHB3, GAMMACA3, ATPHB6 | MP, RP |
| 14 | FUL | PI, SOC1, AP3, SEP3 | DP, RP |
| 15 | AT5G65260 | AT5G10350, ATPABN1 | RP |
| 16 | ATGID1B, SLY1, GAI | DP, MR, RP | |
| 17 | AGL62 | AGL86, AGL90 | DP, MP |
| 18 | ATCHS | F3H, FLS | MR, RP |
| 19 | ATTOC34 | ATTOC120, ATTOC132 | DP, RP |
| 20 | TFL1 | FDP, FD | MR, RP |
| 21 | AGG1 | AGB1, GPA1 | DP |
| 22 | GAPA | CP12-2, PRK | PS, MR |
| 23 | HUB1 | HUB2, UBC1 | MR, DP |
| 24 | AKT1 | CIPK23, AT1G07430 | VP |
| 25 | CYCD1;1 | CDKB2;1, CDKA; 1 | RP, MR, DP |
| 26 | FTSZ2-1 | FTSZ1-1, ARC6 | PS, VP |
| 27 | OBF5 | NPR4, TGA3, ROXY1 | DP, VP, MR |
| 28 | AT1G32150 | GBF4, GBF3, GBF2 | DP, MR |
Most of the identified clusters contain V-R interface proteins, which is consistent with the hypothesis that the high degrees of interface proteins are caused by the existence of protein complexes (Table III). Two protein complexes, CYCLIN-DEPENDENT KINASE A;1 (CDKA;1)/CYCLIN D1;1 (CYCD1;1)/KIP-RELATED PROTEIN1 (ICK1) and CYCLIN D2;1 (CYCD2;1)/CYCLIN-DEPENDENT KINASE B2 (CDKB2;1), formed by members of cluster 25 and their directly interacting proteins outside of the cluster, are found to pass through the V-R interface and may participate in cell cycle regulation (Verkest et al., 2005). Two V-R interface proteins, HISTONE MONO-UBIQUITINATION1 (HUB1) and HUB2, members of cluster 23, may first form a heterotetramer. Then, together with another member of cluster 23, UBIQUITIN CARRIER PROTEIN1 (UBC1), and a neighbor of cluster 23, UBIQUITIN-CONJUGATING ENZYME2 (ATUBC2), they cause histone H2B monoubiquitination in the chromatin of FLOWERING LOCUS C (FLC). This process can regulate FLC gene expression and control flowering time in Arabidopsis (Cao et al., 2008). Moreover, many other protein complexes that were reported to regulate the floral transition process are found on the V-R interface, which will be further detailed in the following subsection.
The Distribution of MADS Box Proteins Indicates the Importance of the Module Interface in the Floral Transition Process
The module interface might be the place where different cellular states coordinate with each other (Xia et al., 2006). Molecular machines existing on the V-R interface may play roles in regulating plant vegetative/reproductive growth. Many protein complexes that appear on the V-R interface have unknown biological roles in the floral transition process. The overrepresented distribution of MADS box transcription factors in the NP network (Fisher's exact test, P = 2.2 × 10⁻¹⁶) may better explain how these modules, especially V-ally and R-ally, control the floral transition through their interface. One hundred seven MADS box genes were identified by a thorough genome sequence analysis of Arabidopsis; 46 of them are in the NP network. Due to the ancestral gene duplication that occurred before the divergence of plants and animals, there are two types of MADS box genes (type I and type II). Generally, only type II MADS box genes are believed to be associated with flower development (Parenicova et al., 2003), which is apparent in our NP network, as the majority of MADS box gene-related PPIs are formed between type II proteins (Fig. 2).
Figure 2.

MADS box proteins in the NP network. Type I MADS box proteins are separated from type II MADS box proteins. Type II MADS box proteins are mainly distributed on the V-R interface. The corresponding color scheme is the same as in Figure 1A.
Two clusters (clusters 2 and 14) are formed by type II MADS box proteins in the NP network (Fig. 2; Table III); they are based on two seed proteins, APETALA1 (AP1) and FRUITFULL (FUL), respectively. As the base of a cluster, removal of a seed protein will lead to destruction of the cluster (Bader and Hogue, 2003). These two seed proteins are important for the floral transition process (Bernier and Perilleux, 2005). Nearly all other MADS box proteins that connect with these two clusters are also type II. Most of the members in clusters 2 and 14 are R-ally proteins, and some of them are interface proteins (Fig. 2). Previous studies have shown that these proteins are directly or indirectly involved in flowering control (Immink et al., 2009). Cluster 17 is formed by three type I proteins and is isolated from the V-R interface. Their neighboring MADS box proteins are also type I (Fig. 2). This clear separation of the two types of MADS box proteins in the NP network is consistent with their different evolutionary traits. Generally, type I proteins are involved in gametophyte and embryo development, and members of cluster 17 have not been reported to be involved in floral transition control (Parenicova et al., 2003).
Recently, the yeast three-hybrid method has been utilized to identify MADS box trimers (Immink et al., 2009). Three trimers, SHATTERPROOF1 (SHP1)/SEPALLATA3(SEP3)/SVP, SOC1/AGAMOUS-LIKE19 (AGL19)/AGL17, and SEEDSTICK (STK)/SEP3/SVP, pass through the V-R interface, implying their potentially crucial roles in floral induction. Indirect experimental evidence can be found to support such a role for two of the trimers. Immink et al. (2009) pointed out that SHP1/SEP3/SVP might function as a negative autoregulatory loop to repress floral development. A recent investigation utilizing ChIP-chip technology showed that SHP1 and SVP are target genes of SEP3, which further supported the hypothesis of Immink et al. (2009) regarding this complex (Kaufmann et al., 2009). They also reported that the protein complex SOC1/AGL19/AGL17 participates in regulation of the floral transition, since all three members play roles during the floral transition process (Immink et al., 2009). So far, the function of the protein complex STK/SEP3/SVP has not been experimentally determined. Here, we expect that it might repress flowering development, because it has the same architecture as the protein complex SHP1/SEP3/SVP (D function gene/SEP3/SVP). However, we are still not able to determine whether an autoregulatory loop also exists in this protein complex, because, according to a recent study, STK is not a target gene of SEP3 (Kaufmann et al., 2009). Taken together, MADS box proteins on the V-R interface provide an example that shows the importance of the module interface in the plant vegetative/reproductive growth phase switch.
Some Pathways Related to Flowering Pass through the V-R Interface
We analyzed the enriched biological functions of V-ally and R-ally interface proteins on the V-R interface. Interestingly, these two groups of proteins share several GO terms that are related to flowering, such as photoperiodism, regulation of photomorphogenesis, and regulation of flower development (Table IV). However, this kind of sharing cannot be observed between intramodule proteins, indicating that the interactions between V-ally and R-ally might be a step in flowering pathways crossing the V-R interface. We identified 15 potential signaling pathways through calculation of the entire NP network. Eight pathways pass through the V-R interface, and we expect that these eight pathways are involved in flowering control (Fig. 3).
Table IV. Shared GO enrichment between V-ally and R-ally proteins on V-R interface.
| GO Term | Description | V-ally Interface Proteins | R-ally Interface Proteins |
| GO:0031461 | Cullin-RING ubiquitin ligase complex | RBX1, IAA7, TIR1 | EBF2, GRH1, SKP1, ZTL, ASK4, ATCUL3B, ASK2 |
| GO:0009736 | Cytokinin-mediated signaling | ARR9, ARR15, ARR6, ARR4, ARR5, WOL, ARR7 | AHP3, ARR2, AHP2, KNAT2, AHK2 |
| GO:0048581 | Negative regulation of postembryonic development | GPRI1, GLK2, SPA1, PIE1, SVP | DET1, NUA, ESD1 |
| GO:0009648 | Photoperiodism | WNK8, FT, SPA1 | COP1, CAT2, ZTL |
| GO:0004673 | Protein His kinase activity | WOL, ATHK1 | PHYB, AHK2 |
| GO:0009909 | Regulation of flower development | ESD4, FT, GPRI1, GLK2, PIE1, SVP | CAL, CIB5, NUA, ESD1 |
| GO:0010099 | Regulation of photomorphogenesis | STH3, SPA1 | CAM7, DET1 |
| GO:0009637 | Response to blue light | RBCS1A, PHOT1, GI, IAA19 | LSH1, NPH4, PHYB |
| GO:0051592 | Response to calcium ion | SOS3, CAM9, CAM1 | CAM8, CAM7 |
| GO:0019005 | SCF ubiquitin ligase complex | RBX1, IAA7, TIR1 | EBF2, GRH1, SKP1, ZTL, ASK4, ATCUL3B, ASK2 |
| GO:0019932 | Second messenger-mediated signaling | CAM9, CBL2, CBL1, CBL6 | CAM8, CAM7 |
Figure 3.

Potential signaling pathways in the NP network. Signaling pathways that have the same medium step are merged into one group. Pathways 12 and 12′ share a medium step but have at least one interaction with an opposite correlation. The corresponding color is the same as in Figure 1A. The red arrow represents the correlated interaction, while the green arrow represents the anticorrelated interaction. Right arrows represent the interaction between upstream and downstream protein. Double-headed arrows represent the interaction between transcriptional factors. “A|B” represents A or B.
Some of the pathways have been experimentally identified to be involved in the control of flowering time. For example, pathway 6, which starts from the DP module (CRYPTOCHROME2 [CRY2] or PHYTOCHROME B [PHYB]), passes across the RP and VP module (CONSTITUTIVE PHOTOMORPHOGENIC1 [COP1] and SUPPRESSOR OF PHYA-105 1 [SPA1]), and ends at the MR module (CONSTANS [CO] or ELONGATED HYPOCOTYL5 [HY5]; Fig. 3), is a photoperiod pathway that plays a central role in flowering control (Lagercrantz, 2009). CO is a key protein in photoperiod sensing in Arabidopsis, and accumulation of CO can promote flowering. Various molecules regulate the expression level of CO to ensure that flowering occurs under optimal environmental conditions (Lagercrantz, 2009). SPA1, a WD-repeat protein with a major role in the suppression of photomorphogenesis, is known to act in CO degradation together with a component of a ubiquitin ligase, COP1. Mutations in cop1 cause extreme early flowering during short days (Jang et al., 2008). A starting point of pathway 6, CRY2, is responsive to blue light and accelerates CO protein levels through the repression of degradation, which initiates the floral transition (Liu et al., 2008). Another start point, PHYB, can inhibit CO protein accumulation independently of COP1 (Lagercrantz, 2009).
Pathway 11 shows the biological relationship between photoperiod and gibberellin signaling. This pathway starts with a DP protein (PHYB), passes through a PS protein (PHYTOCHROME-INTERACTING FACTOR4 [PIF4]), and ends with an MP protein (REPRESSOR OF GA1-3 1 [RGA1]; Fig. 3). With functions in hypocotyl elongation control, chlorophyll biosynthesis, and seed germination (de Lucas et al., 2008), PIF4 is a bHLH protein containing three domains, a phytochrome-binding domain, a DNA-binding domain, and a basic helix-loop-helix domain (Lucyshyn and Wigge, 2009). RGA1 was reported to be a central repressor in the control of hypocotyl growth and stem elongation. It is likely to be a transcriptional regulator that represses the gibberellin signaling pathway through inhibition of the transcription of gibberellin-inducible genes (Cheng et al., 2004). PHYB can be transported from the cytoplasm to the nucleus upon irradiation, where it binds with PIF4 and leads to proteasome-mediated degradation of PIF4 to repress hypocotyl growth. RGA1 interacts with the PIF4 bHLH DNA recognition domain and may block PIF4 DNA-binding ability. Thus, RGA1 functions indirectly as a transcription factor through PIF4 (Mutasa-Gottgens and Hedden, 2009). This pathway may reveal cross talk between photoperiod signaling and gibberellin signaling during the floral transition process. In the NP network, PIF4 is in the V-ally and is down-regulated during the floral transition process, while its anticorrelated interacting partner, PHYB, is in the R-ally.
Although all PPIs were extracted from the literature and some proteins in our identified pathways have been individually reported to play a role in flowering, the majority of identified pathways themselves have not yet been discovered. Detection of these pathways should be attributed to the advantage of integrating PPIs and gene expression profiles. In addition to pathways 6 and 11, other pathways across the V-R interface should play potential roles in the regulation of vegetative/reproductive growth. For instance, three pathways (pathways 1, 2, and 10) related to cytokinin signaling were found to pass through the V-R interface (Fig. 3). Previous studies showed that cytokinins are associated with floral induction (To and Kieber, 2008). Plants deficient in cytokinins may not start reproductive growth until death. Although there is no direct experimental evidence that pathways 1, 2, and 10 have functions in flowering control, they provide new clues to explore how cytokinin signaling regulates flowering time.
Limitations of Current Work and Future Perspectives
One major limitation of the current NP network analysis is the quality and data bias of the established Arabidopsis interactome. Although the established interactome was based on experimentally determined PPIs, it certainly contains some false positives (Shoemaker and Panchenko, 2007). Furthermore, data bias may also inevitably exist in the established interactome. On the one hand, the established Arabidopsis PPI data set is far from complete, and only strongly correlated or anticorrelated interactions were used to construct the NP network. Thus, genes not included in this work may also be involved in floral transition regulation. On the other hand, the established Arabidopsis PPI network may also be overrepresented by some biologically important proteins, since PPIs related to these proteins were often experimentally investigated with higher priority. For instance, flowering-related genes are indeed overrepresented in the established interactome. However, we found that the flowering-related genes are enriched in the V-R interface even in comparison with all genes involved in the established Arabidopsis interactome (data not shown), suggesting that the overrepresentation of flowering regulators in the module interfaces is not merely caused by the data bias of the established Arabidopsis interactome.
The reliability of the established NP network can also be affected by the quality of the transcriptome data used in this work (i.e. the microarray data of Schmid et al. [2003]). Generally, microarray data are often reported to be not reproducible (Shi et al., 2008). Although we used another independent microarray data set with similar experimental conditions to validate the data set of Schmid et al. (2003), such validation can only provide indirect evidence. The quality of their data set remains to be further experimentally verified.
Undoubtedly, more high-throughput interactome or transcriptome data from the floral transition process will be generated in the near future, which will allow us to conduct a more comprehensive analysis of integrating the Arabidopsis interactome and the gene expression data. Therefore, we proposed a new pipeline for reconstructing the NP network by integrating more interactome or transcriptome data in the future (Supplemental File S4).
CONCLUSION
By integrating Arabidopsis PPIs and gene expression data, we constructed the NP network to investigate the dynamics of the PPI network during the floral transition process. Interestingly, two kinds of transcriptionally anticorrelated modules, V-ally and R-ally, were identified, in which vegetative growth and reproductive growth genes, respectively, are enriched. V-ally includes two down-regulated modules (VP and PS), and R-ally contains two up-regulated modules (RP and DP). R-ally module genes are generally more specific to advanced plants, whereas V-ally module genes are conserved in plants. These modules may stand for alternative cellular states of Arabidopsis because they display alternatively lower or higher expression levels during the floral transition process and are enriched in vegetative or reproductive growth genes. Many V-R interface proteins were found to participate in floral transition control through the formation of protein complexes or signaling pathways. These findings suggest that the two cellular states do indeed coordinate with each other through their interacting interface. To the best of our knowledge, this is the first time that the plant floral transition process has been investigated at a genome-wide network level. The identification of Arabidopsis cellular phase switches on the module interface will help to decipher the molecular mechanism of flowering.
MATERIALS AND METHODS
Data Sources
The Arabidopsis (Arabidopsis thaliana) PPI data set was extracted from the following three public databases: TAIR interactome 2.0 (ftp://ftp.arabidopsis.org/home/tair/Proteins/Interactome2.0/), IntAct (version of May 2009; http://www.ebi.ac.uk/intact/), and BioGrid (release 2.0.52; http://www.thebiogrid.org/downloads.php). In 2008, Arabidopsis PPI data stored in BIND (Willis and Hogue, 2006), IntAct, and BioGrid were integrated into TAIR interactome 2.0. Although TAIR released a new Arabidopsis genome version and updated its PPI data in June 2009, the newly updated PPI data were derived only from TAIR and BioGrid. The number of PPIs in the new TAIR version is much smaller in comparison with TAIR interactome 2.0. Therefore, we decided to use TAIR interactome 2.0 to build the Arabidopsis PPI data set. For a more comprehensive Arabidopsis PPI data set, moreover, the PPI data in IntAct (version of May 2009) and BioGrid (release 2.0.52) were also used to build the Arabidopsis PPI data set. Genetic interactions and predicted PPIs were not taken into account.
Gene expression data were obtained from Gene Expression Omnibus (http://www.ncbi.nlm.nih.gov/sites/GDSbrowser?acc=GDS453). Four samples were collected from the Arabidopsis shoot apical meristem at 0, 3, 5, and 7 d. Each sample was measured twice. Thus, the gene expression profile contained eight expression values. The expression data of the Col-0 wild type grown at 21°C was used in our analysis. Only 150 Arabidopsis (Col-0) genes do not have corresponding probes on the array.
Construction of the NP Networks
PCC was calculated for each pair of interacting proteins. For each pair of interacting proteins, the PCC between the gene expression profiles was calculated as follows:
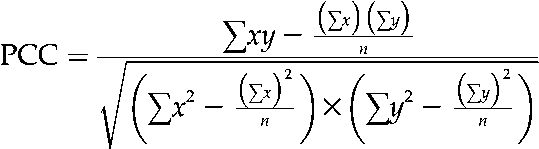 |
where x and y represent the corresponding expression profiles of two interacting proteins and n denotes the number of data points in an expression profile. In this work, n = 8. Only PPIs with PCC > 0.4 were used to build the NP network. Self-interactions and those without corresponding gene expression profiles were further removed from our analysis. Cluster and Treeview (Eisen et al., 1998) were utilized to cluster the gene expression profiles of the proteins in the NP network, with parameters “-l -cg m -ng -ca m -na -g 1 -e 1 -m m,” and view the clustering result, respectively. We scanned from the top of the hierarchical tree to obtain groups of genes that had less than 5% intragroup anticorrelated interactions. These groups of genes were referred as modules at the network level.
GO Enrichment Analysis
Arabidopsis GO information was downloaded from TAIR (ftp://ftp.arabidopsis.org/home/tair/Ontologies/Gene_Ontology/) on May 20, 2009. According to the GO database archive, we added all father nodes for each Arabidopsis GO term. Only the term in the sixth depth was considered, because the number of GO terms in this depth was the largest among depths 4 through 8. GO enrichment was calculated as follows through Fisher's exact test:
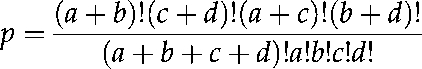 |
where a is the number of genes with the tested GO term in a module, b is the number of genes without that GO term in the module, c is the number of genes with the tested GO term in the entire genome, and d is the number of genes without the tested GO term in the entire genome. The resulting P value was corrected through the q value software in the R package (Storey and Tibshirani, 2003). To filter GO terms that are generally associated with all genes, only the GO terms satisfied with the following condition were used, according to the Bonferroni correction:
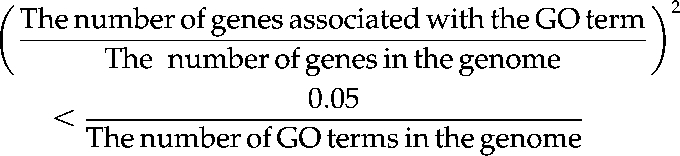 |
Sequence Conservation Analysis
Arabidopsis genome sequences were downloaded from TAIR 8 (ftp://ftp.arabidopsis.org/home/tair/Sequences/blast_datasets/TAIR8_blastsets/TAIR8_pep_20080412). Populus trichocarpa and Physcomitrella patens genome sequences were obtained from Refseq release 34 (http://www.ncbi.nlm.nih.gov/RefSeq/). Chlamydomonas reinhardtii and Monosiga brevicollis genome sequences were downloaded from the Joint Genome Institute (http://genome.jgi-psf.org/). The protein sequences in the NP network were BLASTed against other genomes to identify homologs with an e value cutoff of 10−12 and a sequence identity cutoff value of 25%.
Identification of Protein Complexes and Pathways in the NP Network
To find potential protein complexes, the subnetwork containing only positive PPIs was clustered using MCODE (Bader and Hogue, 2003) with default parameters. We defined a potential signaling pathway using the following criteria. First, a potential pathway should start with a gene annotated with the GO term “receptor binding or activity” or be directly described as “transmembrane protein kinase.” Second, a potential pathway should end with a transcription factor. Third, genes in the middle of the pathway should be annotated with the GO term “signal transduction” or “response to abiotic or biotic stimulus.” Finally, the pathway length was restricted to a range of three to five genes.
Supplemental Data
The following materials are available in the online version of this article.
Supplemental File S1. A table listing all Arabidopsis PPIs, data sources, and corresponding PCC values.
Supplemental File S2. A Cytoscape session file of the NP network.
Supplemental File S3. A table showing a comparison of the seven network modules in our work with the newly identified network modules using more stringent PCC cutoffs.
Supplemental File S4. A text file that describes a pipeline for reconstructing the NP network by integrating more interactome or transcriptome data.
Supplementary Material
Acknowledgments
We thank the anonymous referees whose constructive comments were very helpful in improving the quality of this work. We also thank Drs. Yuzhen Han and De Ye (China Agricultural University), Dr. Chentao Lin (Chinese Academy of Agricultural Sciences), and Dr. Ping Wan (Capital Normal University) for helpful comments. We are grateful to Dr. Jing-Dong Jackie Han (Chinese Academy of Sciences) and her laboratory members for sharing their in-house network analysis tools. F.H. is also grateful to Ph.D. candidates Chen Chen, Qiwen Hu, and Zhe Lv at China Agricultural University for considerable discussions.
References
- Alvarez-Buylla ER, Chaos A, Aldana M, Benitez M, Cortes-Poza Y, Espinosa-Soto C, Hartasanchez DA, Lotto RB, Malkin D, Escalera Santos GJ, et al. (2008) Floral morphogenesis: stochastic explorations of a gene network epigenetic landscape. PLoS ONE 3: e3626. [DOI] [PMC free article] [PubMed] [Google Scholar]
- Bader GD, Hogue CW. (2003) An automated method for finding molecular complexes in large protein interaction networks. BMC Bioinformatics 4: 2. [DOI] [PMC free article] [PubMed] [Google Scholar]
- Baurle I, Dean C. (2006) The timing of developmental transitions in plants. Cell 125: 655–664 [DOI] [PubMed] [Google Scholar]
- Bernier G, Havelange A, Houssa C, Petitjean A, Lejeune P. (1993) Physiological signals that induce flowering. Plant Cell 5: 1147–1155 [DOI] [PMC free article] [PubMed] [Google Scholar]
- Bernier G, Perilleux C. (2005) A physiological overview of the genetics of flowering time control. Plant Biotechnol J 3: 3–16 [DOI] [PubMed] [Google Scholar]
- Brandao MM, Dantas LL, Silva-Filho MC. (2009) AtPIN: Arabidopsis thaliana Protein Interaction Network. BMC Bioinformatics 10: 454. [DOI] [PMC free article] [PubMed] [Google Scholar]
- Breitkreutz BJ, Stark C, Reguly T, Boucher L, Breitkreutz A, Livstone M, Oughtred R, Lackner DH, Bahler J, Wood V, et al. (2008) The BioGRID Interaction Database: 2008 update. Nucleic Acids Res 36: D637–D640 [DOI] [PMC free article] [PubMed] [Google Scholar]
- Calvano SE, Xiao W, Richards DR, Felciano RM, Baker HV, Cho RJ, Chen RO, Brownstein BH, Cobb JP, Tschoeke SK, et al. (2005) A network-based analysis of systemic inflammation in humans. Nature 437: 1032–1037 [DOI] [PubMed] [Google Scholar]
- Cao Y, Dai Y, Cui S, Ma L. (2008) Histone H2B monoubiquitination in the chromatin of FLOWERING LOCUS C regulates flowering time in Arabidopsis. Plant Cell 20: 2586–2602 [DOI] [PMC free article] [PubMed] [Google Scholar]
- Cheng H, Qin L, Lee S, Fu X, Richards DE, Cao D, Luo D, Harberd NP, Peng J. (2004) Gibberellin regulates Arabidopsis floral development via suppression of DELLA protein function. Development 131: 1055–1064 [DOI] [PubMed] [Google Scholar]
- Corbesier L, Coupland G. (2006) The quest for florigen: a review of recent progress. J Exp Bot 57: 3395–3403 [DOI] [PubMed] [Google Scholar]
- Corbesier L, Vincent C, Jang S, Fornara F, Fan Q, Searle I, Giakountis A, Farrona S, Gissot L, Turnbull C, et al. (2007) FT protein movement contributes to long-distance signaling in floral induction of Arabidopsis. Science 316: 1030–1033 [DOI] [PubMed] [Google Scholar]
- Cui J, Li P, Li G, Xu F, Zhao C, Li Y, Yang Z, Wang G, Yu Q, Shi T. (2008) AtPID: Arabidopsis thaliana Protein Interactome Database—an integrative platform for plant systems biology. Nucleic Acids Res 36: D999–D1008 [DOI] [PMC free article] [PubMed] [Google Scholar]
- de Lucas M, Daviere JM, Rodriguez-Falcon M, Pontin M, Iglesias-Pedraz JM, Lorrain S, Fankhauser C, Blazquez MA, Titarenko E, Prat S. (2008) A molecular framework for light and gibberellin control of cell elongation. Nature 451: 480–484 [DOI] [PubMed] [Google Scholar]
- Dezso Z, Oltvai ZN, Barabasi AL. (2003) Bioinformatics analysis of experimentally determined protein complexes in the yeast Saccharomyces cerevisiae. Genome Res 13: 2450–2454 [DOI] [PMC free article] [PubMed] [Google Scholar]
- Dhillon IS, Marcotte EM, Roshan U. (2003) Diametrical clustering for identifying anti-correlated gene clusters. Bioinformatics 19: 1612–1619 [DOI] [PubMed] [Google Scholar]
- Eisen MB, Spellman PT, Brown PO, Botstein D. (1998) Cluster analysis and display of genome-wide expression patterns. Proc Natl Acad Sci USA 95: 14863–14868 [DOI] [PMC free article] [PubMed] [Google Scholar]
- Espinosa-Soto C, Padilla-Longoria P, Alvarez-Buylla ER. (2004) A gene regulatory network model for cell-fate determination during Arabidopsis thaliana flower development that is robust and recovers experimental gene expression profiles. Plant Cell 16: 2923–2939 [DOI] [PMC free article] [PubMed] [Google Scholar]
- Geisler-Lee J, O'Toole N, Ammar R, Provart NJ, Millar AH, Geisler M. (2007) A predicted interactome for Arabidopsis. Plant Physiol 145: 317–329 [DOI] [PMC free article] [PubMed] [Google Scholar]
- Gunsalus KC, Ge H, Schetter AJ, Goldberg DS, Han JD, Hao T, Berriz GF, Bertin N, Huang J, Chuang LS, et al. (2005) Predictive models of molecular machines involved in Caenorhabditis elegans early embryogenesis. Nature 436: 861–865 [DOI] [PubMed] [Google Scholar]
- Han JD, Bertin N, Hao T, Goldberg DS, Berriz GF, Zhang LV, Dupuy D, Walhout AJ, Cusick ME, Roth FP, et al. (2004) Evidence for dynamically organized modularity in the yeast protein-protein interaction network. Nature 430: 88–93 [DOI] [PubMed] [Google Scholar]
- Harris MA, Clark J, Ireland A, Lomax J, Ashburner M, Foulger R, Eilbeck K, Lewis S, Marshall B, Mungall C, et al. (2004) The Gene Ontology (GO) database and informatics resource. Nucleic Acids Res 32: D258–D261 [DOI] [PMC free article] [PubMed] [Google Scholar]
- He F, Zhang Y, Chen H, Zhang Z, Peng YL. (2008) The prediction of protein-protein interaction networks in rice blast fungus. BMC Genomics 9: 519. [DOI] [PMC free article] [PubMed] [Google Scholar]
- He X, Zhang J. (2006) Why do hubs tend to be essential in protein networks? PLoS Genet 2: e88. [DOI] [PMC free article] [PubMed] [Google Scholar]
- Henderson IR, Dean C. (2004) Control of Arabidopsis flowering: the chill before the bloom. Development 131: 3829–3838 [DOI] [PubMed] [Google Scholar]
- Hermjakob H, Montecchi-Palazzi L, Lewington C, Mudali S, Kerrien S, Orchard S, Vingron M, Roechert B, Roepstorff P, Valencia A, et al. (2004) IntAct: an open source molecular interaction database. Nucleic Acids Res 32: D452–D455 [DOI] [PMC free article] [PubMed] [Google Scholar]
- Hwang S, Son SW, Kim SC, Kim YJ, Jeong H, Lee D. (2008) A protein interaction network associated with asthma. J Theor Biol 252: 722–731 [DOI] [PubMed] [Google Scholar]
- Immink RG, Tonaco IA, de Folter S, Shchennikova A, van Dijk AD, Busscher-Lange J, Borst JW, Angenent GC. (2009) SEPALLATA3: the ‘glue’ for MADS box transcription factor complex formation. Genome Biol 10: R24. [DOI] [PMC free article] [PubMed] [Google Scholar]
- Jang S, Marchal V, Panigrahi KC, Wenkel S, Soppe W, Deng XW, Valverde F, Coupland G. (2008) Arabidopsis COP1 shapes the temporal pattern of CO accumulation conferring a photoperiodic flowering response. EMBO J 27: 1277–1288 [DOI] [PMC free article] [PubMed] [Google Scholar]
- Jeong H, Mason SP, Barabasi AL, Oltvai ZN. (2001) Lethality and centrality in protein networks. Nature 411: 41–42 [DOI] [PubMed] [Google Scholar]
- Jonsson H, Krupinski P. (2010) Modeling plant growth and pattern formation. Curr Opin Plant Biol 13: 5–11 [DOI] [PubMed] [Google Scholar]
- Kaufmann K, Muino JM, Jauregui R, Airoldi CA, Smaczniak C, Krajewski P, Angenent GC. (2009) Target genes of the MADS transcription factor SEPALLATA3: integration of developmental and hormonal pathways in the Arabidopsis flower. PLoS Biol 7: e1000090. [DOI] [PMC free article] [PubMed] [Google Scholar]
- Lagercrantz U. (2009) At the end of the day: a common molecular mechanism for photoperiod responses in plants? J Exp Bot 60: 2501–2515 [DOI] [PubMed] [Google Scholar]
- Lin M, Hu B, Chen L, Sun P, Fan Y, Wu P, Chen X. (2009) Computational identification of potential molecular interactions in Arabidopsis. Plant Physiol 151: 34–46 [DOI] [PMC free article] [PubMed] [Google Scholar]
- Liu C, Thong Z, Yu H. (2009) Coming into bloom: the specification of floral meristems. Development 136: 3379–3391 [DOI] [PubMed] [Google Scholar]
- Liu H, Yu X, Li K, Klejnot J, Yang H, Lisiero D, Lin C. (2008) Photoexcited CRY2 interacts with CIB1 to regulate transcription and floral initiation in Arabidopsis. Science 322: 1535–1539 [DOI] [PubMed] [Google Scholar]
- Lucyshyn D, Wigge PA. (2009) Plant development: PIF4 integrates diverse environmental signals. Curr Biol 19: R265–R266 [DOI] [PubMed] [Google Scholar]
- Mendoza L, Alvarez-Buylla ER. (1998) Dynamics of the genetic regulatory network for Arabidopsis thaliana flower morphogenesis. J Theor Biol 193: 307–319 [DOI] [PubMed] [Google Scholar]
- Mendoza L, Thieffry D, Alvarez-Buylla ER. (1999) Genetic control of flower morphogenesis in Arabidopsis thaliana: a logical analysis. Bioinformatics 15: 593–606 [DOI] [PubMed] [Google Scholar]
- Mockler T, Yang H, Yu X, Parikh D, Cheng YC, Dolan S, Lin C. (2003) Regulation of photoperiodic flowering by Arabidopsis photoreceptors. Proc Natl Acad Sci USA 100: 2140–2145 [DOI] [PMC free article] [PubMed] [Google Scholar]
- Mutasa-Gottgens E, Hedden P. (2009) Gibberellin as a factor in floral regulatory networks. J Exp Bot 60: 1979–1989 [DOI] [PubMed] [Google Scholar]
- Mutwil M, Usadel B, Schutte M, Loraine A, Ebenhoh O, Persson S. (2010) Assembly of an interactive correlation network for the Arabidopsis genome using a novel heuristic clustering algorithm. Plant Physiol 152: 29–43 [DOI] [PMC free article] [PubMed] [Google Scholar]
- Parenicova L, de Folter S, Kieffer M, Horner DS, Favalli C, Busscher J, Cook HE, Ingram RM, Kater MM, Davies B, et al. (2003) Molecular and phylogenetic analyses of the complete MADS-box transcription factor family in Arabidopsis: new openings to the MADS world. Plant Cell 15: 1538–1551 [DOI] [PMC free article] [PubMed] [Google Scholar]
- Perfus-Barbeoch L, Jones AM, Assmann SM. (2004) Plant heterotrimeric G protein function: insights from Arabidopsis and rice mutants. Curr Opin Plant Biol 7: 719–731 [DOI] [PubMed] [Google Scholar]
- Qian J, Lin J, Luscombe NM, Yu H, Gerstein M. (2003) Prediction of regulatory networks: genome-wide identification of transcription factor targets from gene expression data. Bioinformatics 19: 1917–1926 [DOI] [PubMed] [Google Scholar]
- Schmid M, Uhlenhaut NH, Godard F, Demar M, Bressan R, Weigel D, Lohmann JU. (2003) Dissection of floral induction pathways using global expression analysis. Development 130: 6001–6012 [DOI] [PubMed] [Google Scholar]
- Shi L, Perkins RG, Fang H, Tong W. (2008) Reproducible and reliable microarray results through quality control: good laboratory proficiency and appropriate data analysis practices are essential. Curr Opin Biotechnol 19: 10–18 [DOI] [PubMed] [Google Scholar]
- Shoemaker BA, Panchenko AR. (2007) Deciphering protein-protein interactions. Part I. Experimental techniques and databases. PLoS Comput Biol 3: e42. [DOI] [PMC free article] [PubMed] [Google Scholar]
- Snyder M, Gallagher JE. (2009) Systems biology from a yeast omics perspective. FEBS Lett 583: 3895–3899 [DOI] [PMC free article] [PubMed] [Google Scholar]
- Storey JD, Tibshirani R. (2003) Statistical significance for genomewide studies. Proc Natl Acad Sci USA 100: 9440–9445 [DOI] [PMC free article] [PubMed] [Google Scholar]
- Swarbreck D, Wilks C, Lamesch P, Berardini TZ, Garcia-Hernandez M, Foerster H, Li D, Meyer T, Muller R, Ploetz L, et al. (2008) The Arabidopsis Information Resource (TAIR): gene structure and function annotation. Nucleic Acids Res 36: D1009–D1014 [DOI] [PMC free article] [PubMed] [Google Scholar]
- To JP, Kieber JJ. (2008) Cytokinin signaling: two: components and more. Trends Plant Sci 13: 85–92 [DOI] [PubMed] [Google Scholar]
- Tu BP, Kudlicki A, Rowicka M, McKnight SL. (2005) Logic of the yeast metabolic cycle: temporal compartmentalization of cellular processes. Science 310: 1152–1158 [DOI] [PubMed] [Google Scholar]
- Turck F, Fornara F, Coupland G. (2008) Regulation and identity of florigen: FLOWERING LOCUS T moves center stage. Annu Rev Plant Biol 59: 573–594 [DOI] [PubMed] [Google Scholar]
- Verkest A, Weinl C, Inze D, De Veylder L, Schnittger A. (2005) Switching the cell cycle: Kip-related proteins in plant cell cycle control. Plant Physiol 139: 1099–1106 [DOI] [PMC free article] [PubMed] [Google Scholar]
- Welch D, Hassan H, Blilou I, Immink R, Heidstra R, Scheres B. (2007) Arabidopsis JACKDAW and MAGPIE zinc finger proteins delimit asymmetric cell division and stabilize tissue boundaries by restricting SHORT-ROOT action. Genes Dev 21: 2196–2204 [DOI] [PMC free article] [PubMed] [Google Scholar]
- Wigge PA, Kim MC, Jaeger KE, Busch W, Schmid M, Lohmann JU, Weigel D. (2005) Integration of spatial and temporal information during floral induction in Arabidopsis. Science 309: 1056–1059 [DOI] [PubMed] [Google Scholar]
- Willis RC, Hogue CW. (2006) Searching, viewing, and visualizing data in the Biomolecular Interaction Network Database (BIND). Curr Protoc Bioinformatics Chapter 8: Unit 8.9 [DOI] [PubMed] [Google Scholar]
- Wu X, Guo J, Zhang DY, Lin K. (2009) The properties of hub proteins in a yeast-aggregated cell cycle network and its phase sub-networks. Proteomics 9: 4812–4824 [DOI] [PubMed] [Google Scholar]
- Xia K, Xue H, Dong D, Zhu S, Wang J, Zhang Q, Hou L, Chen H, Tao R, Huang Z, et al. (2006) Identification of the proliferation/differentiation switch in the cellular network of multicellular organisms. PLoS Comput Biol 2: e145. [DOI] [PMC free article] [PubMed] [Google Scholar]
- Xue H, Xian B, Dong D, Xia K, Zhu S, Zhang Z, Hou L, Zhang Q, Zhang Y, Han JD. (2007) A modular network model of aging. Mol Syst Biol 3: 147. [DOI] [PMC free article] [PubMed] [Google Scholar]
Associated Data
This section collects any data citations, data availability statements, or supplementary materials included in this article.