Abstract
Several important genes that are involved in inflammation and tissue remodeling are switched on by virtue of CRE response elements in their promoters. The upstream signaling mechanisms that inflammatory mediators use to activate cAMP response elements (CREs) are poorly understood. Endothelin (ET) is an important vasoactive mediator that plays roles in inflammation, vascular remodeling, angiogenesis, and carcinogenesis by activating 7 transmembrane G protein-coupled receptors (GPCR). Here we characterized the mechanisms ET-1 uses to regulate CRE-dependent remodeling genes in pulmonary vascular smooth muscle cells. These studies revealed activation pathways involving a cyclooxygenase-2 (COX-2)/prostacyclin receptor (IP receptor) autocrine loop and an interlinked calcium-dependent pathway. We found that ET-1 activated several CRE response genes in vascular smooth muscle cells, particularly COX-2, amphiregulin, follistatin, inhibin-β-A, and CYR61. ET-1 also activated two other genes epiregulin and HB-EGF. Amphiregulin, follistatin, and inhibin-β-A and epiregulin were activated by an autocrine loop involving cPLA2, arachidonic acid release, COX-2-dependent PGI2 synthesis, and IP receptor-linked elevation of cAMP leading to CRE transcription activation. In contrast COX-2, CYR61, and HB-EGF transcription were regulated in a calcium-dependent, COX-2 independent, manner. Observations with IP receptor antagonists and COX-2 inhibitors were confirmed with IP receptor or COX-2-specific small interfering RNAs. ET-1 increases in intracellular calcium and gene transcription were dependent upon ETa activation and calcium influx through T type voltage-dependent calcium channels. These studies give important insights into the upstream signaling mechanisms used by G protein-coupled receptor-linked mediators such as ET-1, to activate CRE response genes involved in angiogenesis, vascular remodeling, inflammation, and carcinogenesis.
Keywords: Arachidonic Acid, Calcium, Cyclic AMP (cAMP), Cyclooxygenase (COX) Pathway, G Protein-coupled Receptors (GPCR), Gene Expression, Transcription Regulation
Introduction
Several important genes involved in inflammation and tissue remodeling are switched on by virtue of cAMP response elements (CRE)2 in their promoters. The upstream signaling mechanisms with which inflammatory mediators, via GPCRs, activate CREs are poorly understood. Our main aim therefore was to characterize the upstream signaling mechanisms that activate the CREs and switch on angiogenic, inflammatory, and remodeling genes. We used endothelin in our studies because in a preliminary screen of inflammatory mediators it was the most potent activator of a CRE reporter construct. Endothelins are primarily expressed by vascular endothelial cells (1) but are also produced by vascular smooth muscle cells (2), monocyte/macrophages (3), cardiomyocytes (4), and alveolar epithelial cells (5). ET-1 is released in response to hypoxia (6), decreased vascular shear stress (7), and inflammation (8, 9). The endothelins act as agonists for two GPCRs, ETa and ETb, by coupling to either Gαq or guanosine triphosphate-hydrolase-αs (Gαs) and their downstream effectors (intracellular calcium or cAMP, respectively) leading to the phosphorylation of the CREB and its increased activity at the CRE of numerous gene promoters. Despite the fact that vascular remodeling genes possess CREs and previous studies have established that ET-1 activates CREB (10), there is little information detailing ET-1-dependent signal transduction mechanisms that lead to remodeling gene expression. Here we characterized the mechanisms ET-1 uses to regulate CRE-dependent genes in pulmonary vascular smooth muscle cells. These studies revealed activation pathways involving a COX-2/prostacyclin/IP receptor autocrine loop linking calcium dependent and cAMP pathways.
EXPERIMENTAL PROCEDURES
Cell Culture
Human proximal pulmonary artery smooth muscle cells (HPASMC) were purchased from Clonetics (Lonza Biologics Plc., Slough, Berkshire, UK) at passage 3 and grown to passage 6 in complete smooth muscle basal medium from TCS Cellworks (Buckingham, UK).
Materials
Dulbecco's modified Eagle's medium, prostaglandin E2 (PGE2), NS398, and indomethacin were obtained from Sigma. Smooth muscle basal medium was purchased from TCS Cell Works (Buckingham, UK). Human endothelin-1, isobutylmethylxanthine, calcium-dependent phospholipase A2 inhibitor (cPLA2-I), AH6809, L161982, BQ123, BQ788, and RO-201724 were purchased from Calbiochem/Merck Chemical Ltd. (Nottingham, UK). Glutamax and Lipofectamine 2000 where purchased from Invitrogen. [5,6,8,9,11,12,14,15-3H]Arachidonic acid was purchased from GE Healthcare. Biotin-UTP was purchased from Roche Applied Sciences. Anti-ETa (SC-33535) and anti-ETb (SC-33537) antibodies were purchased from Santa Cruz Biotechnology (Santa-Cruz, CA). Anti-COX-2 and anti-COX-1 antibodies were purchased from Cayman Chemicals Ltd. (MI). Anti-glyceraldehyde-3-phosphate dehydrogenase antibodies (P04406) were purchased from AbD Serotec (Kidlington, UK). Bosentan was a kind gift from Actelion Pharmaceuticals, iloprost a kind gift from Bayer Schering Pharmaceuticals, UK, and RO3244794 a kind gift from Roche Applied Science (see supplemental Table S1).
6xCRE-Luciferase Reporter Gene Assay
HPASMC were cultured to 90% confluence in 24-well plates, growth arrested for 24 h, and transfected with 1 × 10 μg of 6xCRE-luciferase plasmid (11), 8 ng of pRLSV40 and 3 μl of Lipofectamine 2000 for 2 h. Transfected cells were washed once with serum-free medium and stimulated with ET-1 (1 × 10⁻⁷ m) for up to 8 h. Stimulated cells were washed once with phosphate-buffered saline and lysed with Passive Lysis Buffer (Promega, UK). Lysates were assayed for firefly luciferase and control Renilla luciferase activity with the Dual Luciferase Assay Kit (Promega) in a Berthold MicroLumat Plus LB96V Luminometer (Jencons, UK). The 6xCRE-luciferase construct was a kind gift from Steve Rees, GSK, United Kingdom.
Cyclic AMP Assay
Cellular cyclic AMP levels were measured as previously described (12).
[3H]Arachidonic Acid Release Assay
HPASMC [3H]arachidonic acid release assays were performed as previously published (12).
Intracellular Calcium Mobilization
Intracellular calcium mobilization was measured as previously published (13) with the exception of a lack of probenecid preincubation prior to agonist addition.
PGE2 and 6-Keto-PGF-1α Assays
Culture supernatants were analyzed for secreted PGE2 or the oxidation product of PGI2, 6-keto-PGF1α, with a PGE2 EIA kit (Cayman Chemicals) or 6-keto-PGF1α EIA kit (Cayman Chemicals) according to the manufacturer's protocols.
Western Blot Analysis
Western blot analysis of COX-1, COX-2, ETa, ETb, and glyceraldehyde-3-phosphate dehydrogenase proteins were performed as detailed previously (14).
RNA Isolation and Reverse Transcriptase-Quantitative PCR (QPC)
Total RNA was extracted from HPASMC with the RNeasy-Plus mini-kit (Qiagen) according to the manufacturer's instructions. First strand cDNA was synthesized from 1 μg of total RNA with Superscript III reverse transcriptase according to the manufacturer's instructions (Invitrogen). Quantitative real time PCR was performed with the following primers sets: Amphiregulin, sense, GGGAAAAGTCCATGAAAACTCACAGC, antisense, GCATGTACATTTCCATTCTCTTG; Epiregulin, sense, GCACAGCTTTAGTTCAGACAG, antisense, CGGTCAAAGCCACATATTCTTTGC; HB-EGF, sense, CGGAAAGTTCCGTGACTTGCAAGAG, antisense, CCTCTCTCCATGGTAACCCGGCTG; transforming growth factor α, sense, CCAGATCCCACACTCAGTTCTGC, antisense, GGACCTGGCAGCAGTGTATCAGC; Betacellulin, sense, GGCATCTCCCTTTGATGCAGTAATGC, antisense, GGCATCTCCCTTTGATGCAGTAATGC; EGF, sense, GGAAGCAATTCTCTTATTTGCTCC, antisense, GCACTACTTTCAGTTCACCAAGTGG. ETa, sense, GGATCCTGTCCTTTATCCTGGCCATTC, antisense, GCCATTCCTTCTGTTCAACATCTCACAAAG; ETb sense, GCTTCCCGCCTGACAGGG, antisense, CCTTGATCTCGATGGGTCCTTGGCOX-1, sense, GCCACCTTCATCCGAGAGATGCTCATG, antisense, GGGCATCTGGCAACTGCTTCTTCCCOX-2, sense, GGAACACAACAGAGTATGCG, antisense, AAGGGGATGCCACTGATAGA; Follistatin sense, GCTGTGCCCTGACAGTAAGTC, antisense, CCACTCTAGAATAGAAGATATA; CYR61, sense, CGTTCTTGGAAAATGTCTCCC, antisense, GCGGCCTTGTGGACAGCCAGTGTAC; Inhibin-β-A sense, GGACAGTGAGGACCCGGACGTGCC, antisense, CGCACAGACCTTTCCTCATGCT; β2-Microglobulin, sense, GCCTGGAGGCTATCCAG, antisense, CCAGTCCTTGCTGAAAGACAAG. PCR conditions were as follows, 1 μl of 1st strand cDNA, 1:40,000 SYBR Green (Bigene, Cambridge, UK), 1× Excite Real Time master mix (Biogene, Cambridge, UK), 2 × 10⁻⁸ m sense and antisense oligonucleotide primer pairs in a 20-μl final volume. Quantitative real time PCR was performed in a Stratagene Mx3000P® real time PCR thermocycler with 1 cycle of 95 °C for 10 min, 40 cycles of 95 °C for 30 s, 55 °C for 30 s, and 72 °C for 30 s, with fluorescence integration for product quantitation during the 55 °C annealing segment. All gene-specific quantification was calculated as ΔCt (target Ct − housekeeping Ct) relative to control or untreated cell experiment control to give a final ΔCt (test)/ΔCt (basal). All Ct calculations were performed by Stratagene, MxPro 3.2.
“Human cAMP/Ca2+ Pathway Finder Gene Array” Screening
HPASMC were grown to confluence in 6 separate 75-cm2 tissue culture flasks, serum starved in Dulbecco's modified Eagle's medium/Glutamax for 24 h then treated with ET-1 (1 × 10⁻⁷ m) for 4 h (3 flasks) or vehicle control for 4 h (3 flasks). Total RNA for each flask was isolated according to the manufacturer's instructions for the RNeasy plus kit (Qiagen Ltd., Crawley, UK). Biotin-labeled 1st strand cDNA probe sets (from control and test RNA populations) were synthesized from total RNA using the GE Array® Q kit from SuperArray (Tebu-Bio, Peterborough. UK). Briefly 1 μg of total RNA was annealed to the Human cAMP/Ca2+ PathwayFinder (P) primer set followed by 1st strand cDNA synthesis with the GE-Array Q synthesis kit. 1st strand cDNA, then linear PCR amplified in the presence of biotin-16-UTP (Roche) using the AmpoLabeling-Linear PCR probe synthesis kit (SuperArray, Tebu-Bio, Peterborough. UK). 2 Human cAMP/Ca2+ Pathway Finder arrays were screened using the probes from control and ET-1-treated HPAMC as per the manufacturer's protocol, developed with a chemiluminescent detection kit (SuperArray, Tebu-Bio, Peterborough, UK), and exposed to Hyperfilm x-ray film (GE Healthcare). Array results were analyzed with the GE Array Expression Analysis Suite. Positive results were set at 2-fold greater than control for each array.
Enzyme-linked Immunosorbent Assay (ELISA)
ELISA for amphiregulin (R&D Systems, Abingdon, UK) was performed according to the manufacturer's protocol. All assay points were performed in triplicate on 24-well plates in a final volume of 500 μl.
siRNA Validation of COX-2 and IP Receptor Inhibition
HPASMC in 24-well plates were transfected with 10 nm COX-2 siRNA (Qiagen, Hs_PTGS2–1HP), 10 nm IP receptor siRNA (Hs_PTGIR_1HP), or 10 nm negative control siRNA (AllStars Negative control, Qiagen, Hilden, Germany) with 6.6 μl of HiPerFect (Qiagen, Hilden, Germany) for 72 h. After serum starvation for 24 h and ET-1 addition for 2 h, total RNA extraction and reverse transcriptase Q-PCR was performed as above. PTGIR gene-specific primer sequences were: PTGIR sense, GGTGACCGGACTGGCGGCC, and PTGIR antisense, GGCTCAGCGCCAGGCAGCGCTC.
Data Analysis
Statistical analysis of test (induced) and test + inhibitor or test + antagonist were subjected to a paired t test using GraphPad Prism (GraphPad, San Diego, CA). p values were scored as significant for 0.01 to 0.05 (*), 0.001 to 0.01 (**), and <0.001 (***).
RESULTS
Endothelin-1 Induces Arachidonic Acid Release, COX-2 Expression, COX-2-dependent PGI2, and PGE2 Secretion by Pulmonary Artery Smooth Muscle Cells
HPAMSC ETa Receptors Are Coupled to cAMP Synthesis
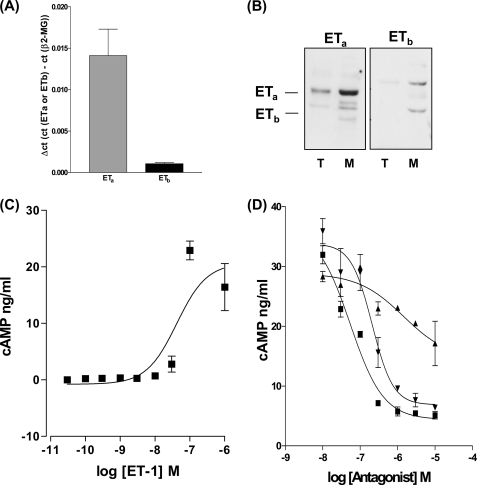
ETa and ETb receptor mRNA and proteins were analyzed by Q-PCR and Western blot. HPASMC express proportionally more ETa mRNA (Fig. 1A) and protein, in membrane preparations, than the ETb receptor (Fig. 1B). ET-1 (3 × 10⁻¹⁰ to 1 × 10⁻⁶ m) stimulated intracellular cAMP synthesis (Fig. 1C). Although the ETa receptor expressed in smooth muscle is generally observed to be Gαq coupled to changes in [Ca2+]i and intracellular diacylglycerol (15, 16), we found that pre-treatment of HPASMC with the ETa receptor antagonist BQ123 (17) or the dual specific ETa/ETb antagonist Bosentan (18) (Fig. 1D) was more effective at inhibiting ET-1-induced cAMP synthesis than the ETb selective antagonist BQ788 (19) implying that ET-1-stimulated cAMP synthesis is mainly via the ETa receptor.
FIGURE 1.
HPASMC expresses both ETa and ETb receptors. A, Q-PCR of 10 ng of 1st strand cDNA from HPASMC probed for the ETa receptor and ETb receptors with comparative Ct (ΔCt) to the β2-microglobulin gene. B, Western blot analysis of 20 μg of total cellular extracts (T) and membrane extracts (M) from HPASMC probed with rabbit anti-ETa and rabbit anti-ETb antibodies. ET-1 causes a concentration-dependent increase in the synthesis of cAMP that is more effectively antagonized by the ETa-specific antagonist BQ123 and the dual specific ETa/ETb antagonist bosentan. C, a concentration range of ET-1 induces cAMP synthesis in HPASMC. D, HPASMC were treated with a concentration curve of ETa antagonist (BQ123) (▾), ETb antagonist (BQ788) (▴), and dual specificity ETa/ETb antagonist (bosentan) (■) for 30 min prior to the 20-min stimulation of cAMP synthesis by ET-1 at 1 × 10⁻⁷ m. All measurements represent the mean ± standard error of three independent experiments.
COX-2-derived Prostanoids Are Responsible for ET-1-induced cAMP Synthesis
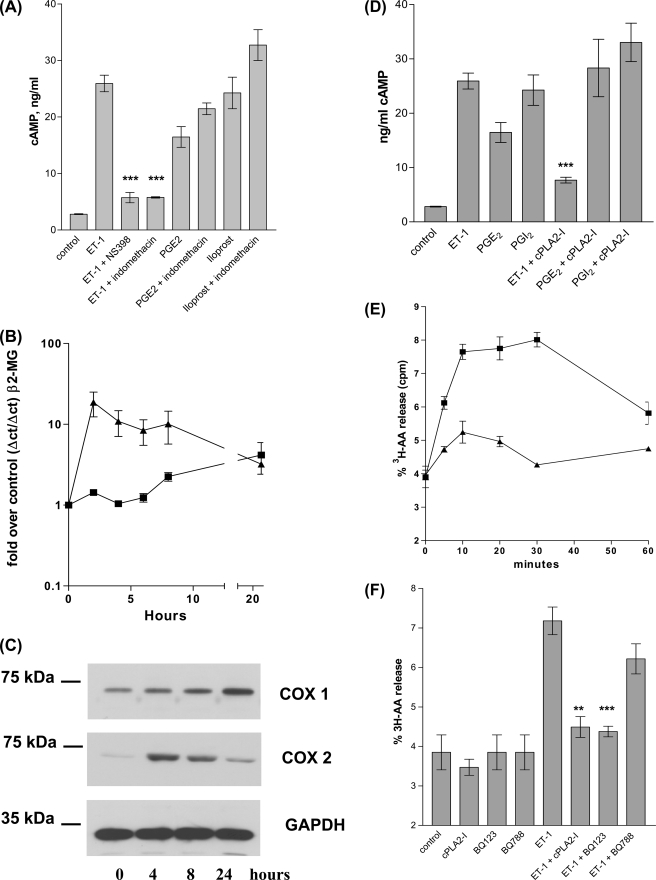
Pre-treatment of HPASMC with the COX-2 selective inhibitor NS398 (1 × 10⁻⁶ m) (20) or the non-selective COX1/2 inhibitor, indomethacin (1 × 10⁻⁶ m), eliminated ET-1 induction of cAMP synthesis, implying that autocrine COX-2-derived prostanoids were responsible for coupling ET-1/ETa to cAMP synthesis (Fig. 2A). Consistent with this, exogenously applied PGE2 (1 × 10⁻⁶ m) or PGI2 (1 × 10⁻⁶ m) stimulated cAMP synthesis. As would be expected indomethacin had no effect on PGI2/PGE2-induced cAMP synthesis (Fig. 2A).
FIGURE 2.
ET-1 stimulated cellular cAMP synthesis is inhibited by both COX-1/2 and COX-2 selective inhibitors. PGE2 or iloprost stimulation of cAMP synthesis is not inhibited by either COX-1/2 or COX-2 inhibitors. A, HPASMC cells were treated with indomethacin (1 × 10⁻⁶ m) or NS398 (1 × 10⁻⁶ m) for 30 min prior to induction with ET-1 (1 × 10⁻⁸ m) for 20 min, treated cells were then assayed for cAMP. ET-1 stimulates COX-2 mRNA synthesis and COX-2 protein synthesis with peak mRNA at 2 h and peak total protein at 4 h post ET-1 addition. B, HPASMC were treated with a time course of ET-1 (1 × 10⁻⁸ m) for up to 24 h, 1st strand cDNA from total RNA extracts were analyzed by quantitative real time PCR for COX-1 (■) and COX-2 (▴) with reference to the β2-microglobulin gene product. ET-1 stimulates COX-2 protein synthesis in HPASMC. C, HPASMC were treated with ET-1 at 1 × 10⁻⁸ m for up to 24 h, total protein extracts were resolved by SDS-PAGE and the resulting Western blot probed with mouse anti-human-COX-1 or mouse anti-human-COX-2 antibodies. Control blots with identical protein samples were probed with the mouse anti-glyceraldehyde-3-phosphate dehydrogenase antibody. ET-1-stimulated cAMP synthesis is dependent upon cPLA2 activity. PGE2- and iloprost-stimulated cAMP synthesis is not cPLA2 dependent. D, HPASMC was incubated with cPLA2 inhibitor (1 × 10⁻⁷ m) for 30 min prior to incubation with ET-1 (1 × 10⁻⁸ m), PGE2 (1 × 10⁻⁶ m), or iloprost (1 × 10⁻⁸ m) for 20 min. ET-1-stimulated HPASMC were assayed for cAMP. ET-1 stimulates arachidonic acid release from HPASMC. E, HPAMSC incubated with ET-1 (1 × 10⁻⁸ m) (■) or a vehicle control (▴) for a time course of 30 min were assayed for [3H]arachidonic acid release. ET-1 stimulated [3H]arachidonic acid release is inhibited by the Calbiochem cPLA2 inhibitor (cPLA2-I) and the ETa antagonist BQ123. F, HPASMC incubated with cPLA2-I (1 × 10⁻⁷ m), BQ123 (1 × 10⁻⁶ m), or BQ788 (1 × 10⁻⁶ m) for 30 min were then induced for 20 min with ET-1 (1 × 10⁻⁸ m), prior to a [3H]arachidonic acid release assay. All measurements represent the mean ± standard error of three independent experiments. Western blots are representative of three independent experiments.
ET-1 Increases COX-2 and COX-1 Expression
ET-1 (1 × 10⁻⁸ m) rapidly induced COX-2 mRNA and COX-2 protein accumulation in HPASMC, with peak mRNA at 2 h and peak protein accumulation at 4 h (Fig. 2C). ET-1 addition to HPASMC also causes a slower but more sustained increase in COX-1 mRNA and protein within the 24-h time course.
ET-1 Stimulates Arachidonic Acid Release, the Control Point for COX-2-dependent Induction of cAMP Synthesis
ET-1 (1 × 10⁻⁸ m) rapidly increased cellular arachidonic acid release (Fig. 2E). A selective cPLA2 inhibitor (N-{(2S,4R)-4-(biphenyl-2-yl-methylisobutyl-amino)-1-[2-(2,4-difluorobenzoyl)-benzoyl]-pyrrolidin-2-yl-methyl}-3-[4-(2,4-dioxothiazolidin-5-ylidenemethyl)-phenyl]acrylamide, HCl) (1 × 10⁻⁷ m) (21) prevented cAMP synthesis in response to ET-1 (Fig. 2D) and ET-1 increased HPASMC arachidonic acid release (Fig. 2F). Pre-treatment with the ETa antagonist BQ123 (1 × 10⁻⁶ m) blocked the ET-1-induced arachidonic acid release with the ETb antagonist BQ788 (1 × 10⁻⁶ m) having little effect, suggesting that ET-1-induced arachidonic acid release, like cAMP generation is ETa coupled in HPASMC.
PGI2 Is the Dominant COX-derived Prostanoid Produced by HPASMC
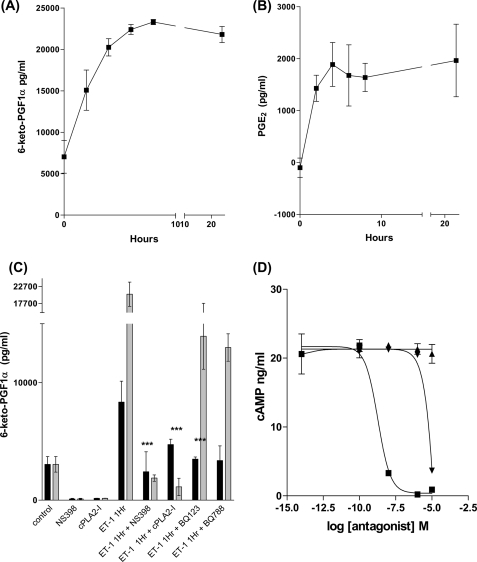
ET-1 increased release of PGI2 and PGE2 (Fig. 3, A and B) with up to 10-fold more PGI2 (a maximal 2 × 10⁻⁸ μg ml−1) released than PGE2 (a maximal 2 × 10− μg ml−1) (assays were conducted on the same samples). Furthermore, ET-1 induced PGI2 release was inhibited by NS398 confirming that PGI2 synthesis is COX-2 dependent (Fig. 3C). Inhibition of cPLA2 activity prior to ET-1 stimulation also completely inhibited PGI2 synthesis (Fig. 3C).
FIGURE 3.
ET-1 stimulates an increase in PGI2 and PGE2 secretion from HPASMC. HPAMSC were serum starved for 24 h then treated with ET-1 (1 × 10⁻⁸ m) for up to 24 h. Culture supernatants were analyzed for 6-keto-PGF1-α (A) and PGE2 (B) by ELISA. ET-1-stimulated PGI2 synthesis is COX-2 and cPLA2 dependent. HPASMC were serum starved for 24 h, then treated with NS398 (1 × 10⁻⁶ m) or cPLA2-I (1 × 10⁻⁷ m) for 30 min prior to stimulation with ET-1 (1 × 10⁻⁸ m) for either 1 (closed bars) or 8 h (open bars), cell culture supernatants were then assayed for 6-keto-PGF1-α by ELISA (C). ET-1-stimulated HPASMC cAMP synthesis is antagonized by the IP receptor antagonist RO3244794. HPASMC were incubated with a concentration range of RO3244794 (■), AH6809 (▴), or L161982 (▾) for 30 min prior to stimulation with ET-1 (1 × 10⁻⁸ m) for 20 min followed by an assay for cellular cAMP (D). All measurements represent the mean ± standard error of three independent experiments.
IP Receptor Antagonism Blocks ET-1-induced cAMP Synthesis
We next determined which prostanoid receptor was involved in coupling endogenous prostanoid released by ET-1 to cAMP using concentration ranges (1 × 10⁻¹⁴ to 1 × 10⁻⁵ m) of the IP receptor antagonist RO3244794 (22), the EP1/EP2/EP3 receptor antagonist AH6809 (23), or the EP4 antagonist L161982 (24). Antagonist-treated HPASMC were stimulated with ET-1 (1 × 10⁻⁸ m) for 20 min and assayed for cellular cAMP. RO3244794 was the most effective antagonist of ET-1-induced cAMP synthesis with an IC50 of 1.87 × 10⁻⁹ m (AH6809 has no antagonistic effect and L161982 has an IC50 of 3.81 × 10⁻⁵ m). This suggests that ET-1-derived PGI2 is acting at the IP receptor to increase cAMP levels (Fig. 3D).
ET-1-induced Changes in cAMP Cause CRE Activation
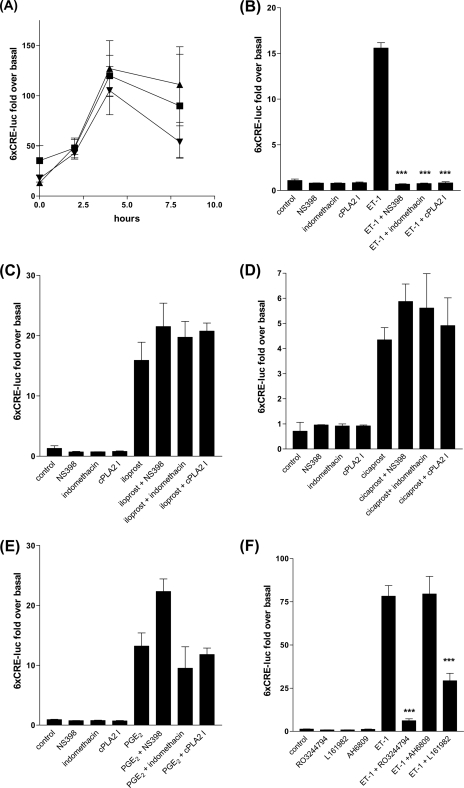
An increase in intracellular cAMP can stimulate transcription via PKA activation (25) or Raf/MEK/ERK/RSK-1 activation (26), phosphorylation of CREB, and binding of the CREs in numerous cellular promoters affecting many cellular processes (27). To determine whether ET-1-induced changes in cellular cAMP were sufficient to activate CRE-mediated transcription, we transiently transfected cells with a CRE reporter construct linked to firefly luciferase. We found that ET-1 increased 6xCRE-luciferase reporter activity and that exogenous PGE2 (EP receptor agonist, 1 × 10⁻⁶ m), iloprost (EP1 and IP receptor agonist, 1 × 10⁻⁶ m), and cicaprost (IP receptor agonist, 1 × 10⁻⁶ m) all increased CRE activation (Fig. 4A). ET-1-induced CRE activation was dependent upon both cPLA2 and COX-2 activity (Fig. 4B). However, COX-2 inhibition did not prevent PGE2 and the PGI2 analogues increasing CRE activity (Fig. 4, C–E). ET-1 induced CRE activation was blocked by the IP receptor antagonist RO3244794 (Fig. 4F) suggesting ET-1-induced CRE activation is via endogenous PGI2 secretion acting at the HPASMC IP receptor.
FIGURE 4.
ET-1, PGE2, and iloprost can stimulate the 6xCRE-luciferase reporter gene. A, HPASMC grown to 100% confluence and transfected with 0.8 μg of plasmid p6xCRE-LUC and 8 ng of pRL-SV40 after incubation with 2.4 μl of Lipofectamine 2000. Transfected HPASMC were stimulated with a time course of ET-1 (1 × 10⁻⁷ m) for up to 8 h. Firefly luciferase activities were normalized to Renilla luciferase activities from the same transfection replicate. COX1/2, COX-2, and cPLA2 inhibition will completely suppress all ET-1-induced 6xCRE-LUC activity in HPASMC (B), but COX1/2, COX-2, or cPLA2 inhibition will not suppress iloprost (C), cicaprost (D), or PGE2 (E) induced 6xCRE-LUC activity. HPASMC were transfected with 6xCRE-LUC as in A and treated with NS398 (1 × 10⁻⁶ m), indomethacin (1 × 10⁻⁶ m), and the cPLA2 inhibitor (1 × 10⁻⁷ m) for 30 min prior to stimulation with ET-1 (1 × 10⁻⁸ m), iloprost (1 × 10⁻⁸ m), cicaprost (1 × 10⁻⁶ m), or PGE2 (1 × 10⁻⁶ m) for 4 h. The IP receptor antagonist RO3244794 is a more effective inhibitor of ET-1-stimulated 6xCRE-luciferase activity in HPASMC than the EP4 selective antagonist L161982 and the EP1/EP2 antagonist AH6809. HPASMC were transfected with 6xCRE-LUC as for A and pre-treated with 1 × 10⁻⁶ m antagonist for 30 min prior to stimulation with ET-1 (1 × 10⁻⁸ m) for 4 h (F). All measurements represent the mean ± standard error of three experiments.
Endothelin-1 Induces CRE-dependent Remodeling Gene Expression via a Direct Calcium-dependent Mechanism or via a cPLA-2/COX-2/PGI2/IP Receptor, Autocrine Loop
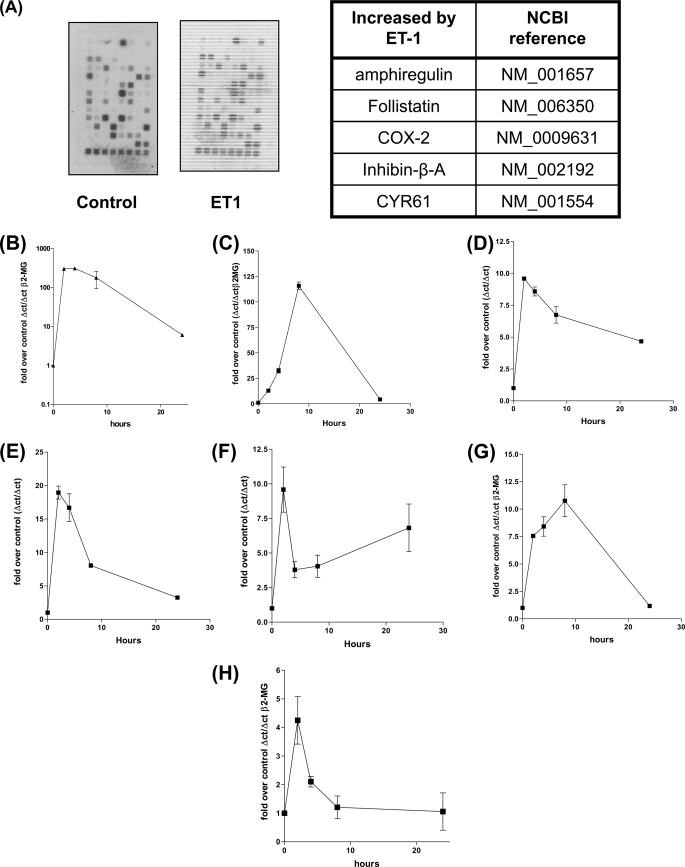
Endothelin-1 plays a key roles in inflammation, vascular homeostasis/remodeling angiogenesis, and cancer progression and many of these functions are regulated by changes in cAMP (28, 29) or intracellular calcium (30). As there are many genes whose promoters possess CRE control elements (31), we wished to characterize those genes that are CRE dependent and activated by ET-1. HPASMC were treated with ET-1 for 2 h and 1st strand cDNA synthesized, from the extracted RNA was used as a probe against the SuperArray “CRE array.” Control un-stimulated 1st strand was synthesized in the same manner from an equal number of cells. Screening of both probe sets against the CRE arrays revealed that at least five gene transcripts were up-regulated by ET-1 namely, amphiregulin, follistatin, COX-2, inhibin-β-A, and CYR61 (Fig. 5A), ET-1 induced increases in mRNA was confirmed by Q-PCR against cDNA synthesized from total RNA extracted from HPASMC treated with ET-1 for various times (Fig. 5, A–F). Amphiregulin is a member of the EGF family of growth factors (32) a potent smooth muscle mitogen (33) that can undergo transcriptional co-induction with other members of the EGF family (34). To determine whether other members of the EGF family were also induced by ET-1 we designed PCR primers for EGF, transforming growth factor α, betacellulin, epiregulin, and HB-EGF and performed Q-PCR. Two other EGF family members, epiregulin and HB-EGF, were both induced by ET-1 (Fig. 4, G and H). Collectively these studies show that the stimulation of vascular smooth muscle endothelin GPCRs causes a concerted increase in the transcription of genes whose proteins have roles in vascular homoeostasis (9, 35) and remodeling (36, 37), inflammation (38), and cancer (39, 40).
FIGURE 5.
COX-2, amphiregulin, CYR61, follistatin, inhibin-β-A, epiregulin, and HB-EGF transcription are induced by ET-1 addition to HPASMC. COX-2, amphiregulin, CYR61, inhibin-β-A, and follistatin genes were identified with a CRE gene array probed with biotin-UTP labeled 1st strand cDNA from HPASMC treated with ET-1 for 2 h (A). 5 μg of biotin-UTP labeled 1st strand cDNA was synthesized from total RNA derived from HPASMC serum starved for 24 h and either untreated or treated with ET-1 (1 × 10⁻⁸ m) for 2 h. 2 “CRE gene” cDNA arrays were probed with each probe population with 5 gene cDNAs demonstrating increased hybridization on the ET-1 probe set. Regulation of transcription of amphiregulin (B), follistatin (C), inhibin-β-A (D), COX-2 (E), and CYR61 (F), in response to ET-1, over a time course of 0, 2, 4, 8, and 24 h, was confirmed by Q-PCR against 1st strand cDNA derived from HPASMC treated with ET-1 (1 × 10⁻⁸ m). Primer sets for the EGF family of proteins (EGF, HB-EGF, epiregulin, betacellulin, and transforming growth factor α) were screened by Q-PCR against 1st strand cDNA derived from HPASMC treated with ET-1 (1 × 10⁻⁸ m) for a time course of 0, 2, 4, 8, and 24 h with reference to the β2-microglobulin gene cDNA, epiregulin (G) and HB-EGF (H) transcription is increased in response to ET-1. All measurements (apart from the original CRE array screen) represent the mean ± standard error of three independent experiments.
ET-1-stimulated Increases in Amphiregulin, Epiregulin, Follistatin, and Inhibin-β-A mRNA Are COX-dependent, Whereas COX-2, HB-EGF, and CYR61 Induction Are COX-independent
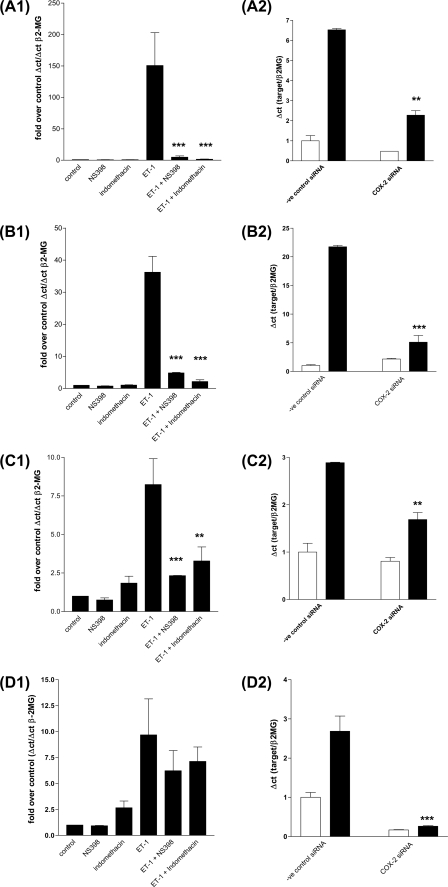
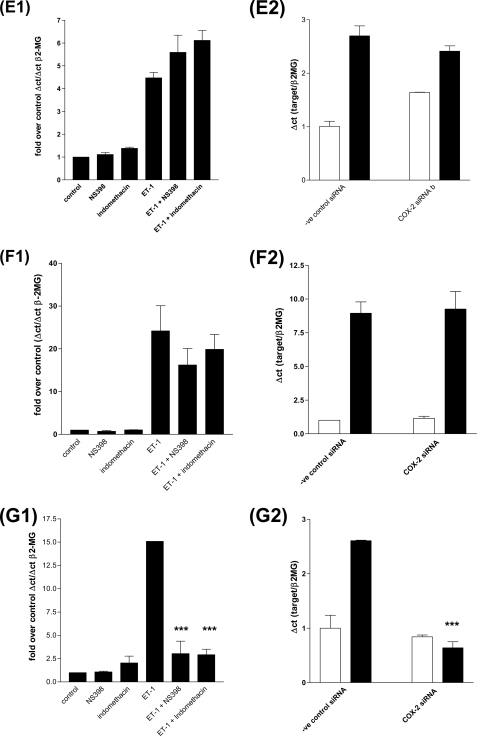
To determine whether the ET-1-stimulated autocrine COX-2/PGI2 loop was involved in the induction of all or alternatively mediated the induction of a distinct set of genes, we pre-treated cells with the COX-2 inhibitor NS398 or the combined COX1/2 inhibitor indomethacin. Both inhibitors prevented ET-1 induction of a group of genes including, amphiregulin (Fig. 6A1), follistatin (Fig. 6B1), inhibin-β-A (Fig. 6C1), and epiregulin (Fig. 6G1). In contrast, neither NS398 nor indomethacin blocked ET-1 induction of HB-EGF, COX-2, or CYR61 mRNA accumulation (Fig. 6, D1, E1, and F1). To further validate the role of COX-2 in ET-1-induced gene expression, we transfected HPASMC with COX-2 siRNA and a negative control siRNA. Knockdown of COX-2 expression (Fig. 6D2) resulted in the loss of amphiregulin (Fig. 6A2), follistatin (Fig. 6B2), inhibin-β-A (Fig. 6C2), and epiregulin (Fig. 6G2) but not the loss of CYR61 (Fig. 6F2) or HB-EGF (Fig. 6E2) in response to ET-1 after 2 h.
FIGURE 6.
ET-1 stimulates two classes of transcripts, COX1/2 dependent and COX1/2 independent. HPASMC were serum starved for 24 h. COX-2 inhibitor NS398 (1 × 10⁻⁶ m) or the COX-1/2 inhibitor indomethacin (1 × 10⁻⁶ m) were added for 30 min prior to ET-1 addition (1 × 10⁻⁸ m) for 2 h. Q-PCR was performed against 1st strand cDNA derived from treated cells with reference to the β2-microglobulin gene (β-2MG) cDNA. Q-PCR for amphiregulin (A1), Follistatin (B1), Inhibin-β-A (C1), COX-2 (D1), HB-EGF (E1), CYR61 (F1), and epiregulin (G1). A role for COX-2 in ET-1-induced gene expression was confirmed with COX-2 siRNA and a negative control siRNA, after a 72-h transfection HPASMC were treated with ET-1 (1 × 10⁻⁸ m) for 2 h. Q-PCR was performed against 1st strand cDNA derived from treated cells with reference to the β2-microglobulin gene (β-2MG) cDNA for amphiregulin (A2), Follistatin (B2), Inhibin-β-A (C2), COX-2 (D2), HB-EGF (E2), CYR61 (F2), and epiregulin (G2). All ET-1-induced, COX1/2-dependent genes, amphiregulin (H), epiregulin (I), follistatin (J), and inhibin-β-A (K) undergo increased transcription in response to the addition of PGE2 or PGI2 analogue iloprost to HPASMC. HPASMC were serum starved for 24 h, then treated with ET-1 (1 × 10⁻⁸ m) (■), PGE2 (1 × 10⁻⁶ m) (▴), or iloprost (1 × 10⁻⁸ m) (▾) in a time course of up to 24 h. Q-PCR was performed against 1st strand cDNA derived from treated cells with reference to the β2-microglobulin gene (β-2MG). All measurements represent the mean ± standard error of three independent experiments.
The COX-dependent, ET-1-induced Gene Group Are Induced by Exogenous PGI2 Analogues or PGE2 Whereas the COX-independent Group Are Not
Parallel cultures of HPASMC were stimulated with iloprost (a PGI2 analogue), at 1 × 10⁻⁶ m, PGE2 at 1 × 10⁻⁶ m, or ET-1 at 1 × 10⁻⁸ m for 24 h. Q-PCR showed that amphiregulin (Fig. 5H), epiregulin (Fig. 5I), follistatin (Fig. 5J), and inhibin-β-A (Fig. 5K) mRNAs were all increased in response to PGI2 and PGE2. In contrast COX-2, HB-EGF, and CYR61 mRNA were not increased by either iloprost or PGE2 (data not shown).
ET-1-stimulated Amphiregulin Protein Secretion Reflects mRNA Increases Induced by PGI2 and Stimulation of the IP Receptor
Because amphiregulin expression in vascular smooth muscle has not been characterized before we wished to confirm that ET-1 stimulated HPASMC PGI2 secretion was functionally coupled to amphiregulin protein secretion as well as amphiregulin transcription. To confirm the role of a COX-2-dependent autocrine loop.
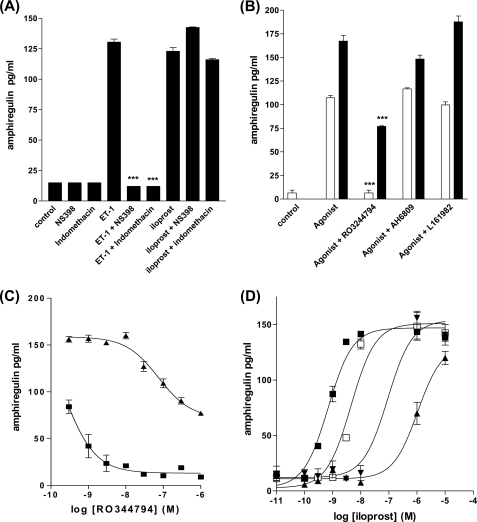
HPASMC were pretreated with NS398 (1 × 10⁻⁶ m) or indomethacin (1 × 10⁻⁶ m) for 30 min prior to ET-1 addition for 24 h. Both COX inhibitors completely blocked amphiregulin secretion, whereas the iloprost-induced secretion of amphiregulin protein was unaffected (Fig. 7A). HPASMC were pre-treated with the IP receptor antagonist RO3244794 (1 × 10⁻⁶ m), EP1/EP2/EP3 antagonists AH6809 (1 × 10⁻⁶ m), or the EP4 antagonist L161982 (1 × 10⁻⁶ m), stimulated with either ET-1 (1 × 10⁻⁸ m) or iloprost (1 × 10⁻⁶ m) for 24 h and the supernatants were assayed for amphiregulin. Neither EP receptor antagonists at high concentrations (1 × 10⁻⁶ m) inhibited ET-1- or iloprost-induced amphiregulin secretion, whereas the IP receptor antagonist inhibited all ET-1-induced amphiregulin secretion and close to 50% of the iloprost-induced AR secretion (possibly a reflection of R03244794 competitive antagonism reaching the effective limit with iloprost but not with a potentially much lower concentration of native secreted PGI2 induced by ET-1) (Fig. 7B). These observations were further confirmed with inhibition of amphiregulin secretion by a concentration range of R03244794 prior to 24 h stimulation with either a single concentration of iloprost or ET-1 (Fig. 7C) or by the concentration-dependent dextral shift of an iloprost-induced amphiregulin concentration-response curve, by RO3244794 (Fig. 7D).
FIGURE 7.
Amphiregulin protein secretion from HPASMC is COX-2 dependent. HPASMC were treated with NS398 (1 × 10⁻⁶ m) or indomethacin (1 × 10⁻⁶ m) for 30 min prior to 24 h with ET-1 (1 × 10⁻⁸ m) or iloprost (1 × 10⁻⁸ m) then the culture supernatants were analyzed by ELISA for amphiregulin (A). Endothelin-1 and iloprost induction of amphiregulin protein secretion from HPASMC are inhibited by the IP receptor antagonist RO3244794 but not the EP4 antagonist L161982 or the EP1, EP2, and EP3 antagonist AH6809. HPASMC were treated with RO3244794 (1 × 10⁻⁶ m), L161982 (1 × 10⁻⁶ m), or AH6809 (1 × 10⁻⁶ m) for 30 min prior to stimulation with ET-1 (1 × 10⁻⁸ m) (open bars) or iloprost (1 × 10⁻⁸ m) (closed bars) for 24 h prior to amphiregulin ELISA of the culture supernatants (B). Endothelin-1 and iloprost induction of amphiregulin protein secretion from HPASMC are concentration dependently inhibited by the IP receptor antagonists RO3244794. HPASMC were treated with a concentration range of RO3244794 for 30 min prior to addition of ET-1 (1 × 10⁻⁸ m) (■) or iloprost (1 × 10⁻⁸ m) (▴) for 24 h, culture supernatants were analyzed by ELISA for amphiregulin (C). R03244794 will cause a dextral shift in the iloprost-induced amphiregulin concentration-response curve from HPASMC. HPASMC were treated with a range of RO3244794 (1 × 10⁻⁹ m, □; 1 × 10⁻⁷ m, ▾; 1 × 10⁻⁶ m, ▴) or vehicle control (■) for 30 min prior to the addition of a concentration range of ET-1 (1 × 10⁻⁵ to 1 × 10⁻¹¹ m) at each RO3244794 concentration, the 24-h culture supernatants were analyzed by ELISA for amphiregulin (D). All measurements represent the mean ± standard error.
To confirm the role of the IP receptor in ET-1-induced gene expression, IP receptor siRNA and a negative control siRNA were transfected into HPASMC (supplemental Fig. S1A). IP receptor siRNA blocked ET-1-induced amphiregulin (supplemental Fig. S1B), Inhibin-β-A (supplemental Fig. S1C), epiregulin (supplemental Fig. S1D), follistatin (supplemental Fig. S1E) but not ET-1-induced COX-2 (supplemental Fig. S1F), HB-EGF (supplemental Fig. S1G), and CYR61 (supplemental Fig. S1H).
ET-1 Induces Remodeling Gene Expression via Interacting Calcium-dependent and cAMP-dependent Signaling Pathways
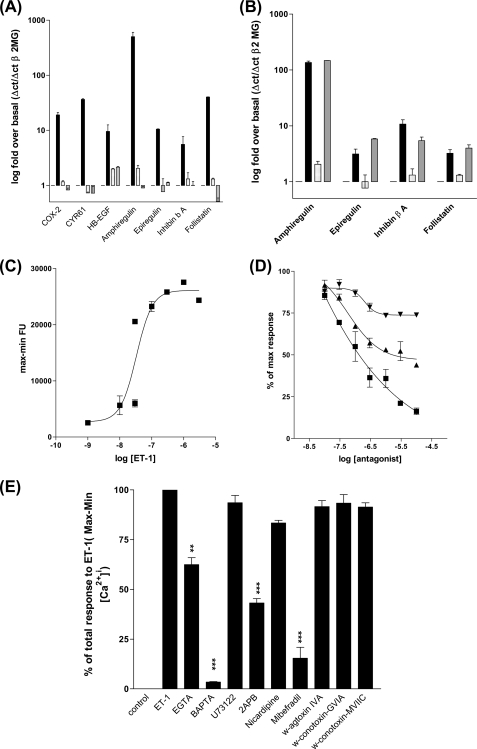
We have established that ETa receptor-induced cAMP synthesis is via a PGI2/IP receptor-dependent autocrine loop and the consequences for transcription regulation of a group of vascular remodeling genes is the PGI2/cAMP-dependent induction of amphiregulin, epiregulin, follistatin, and inhibin-β-A. Because the ETa receptor can couple to intracellular calcium store release via the Gαq/phospholipase C/DAG pathway we studied the interplay between calcium-dependent pathways and the COX-2/PGI2/IP receptor pathway. We found that the ETa-dependent regulation of all induced genes were dependent upon intracellular calcium release as pre-treatment of HPASMC with the cell permeant calcium chelator BAPTA-AM (41) blocked ET-1-induced COX-2, CYR61, HB-EGF, amphiregulin, epiregulin, inhibin-β-A, and follistatin expression (Fig. 8A). However PGI2-induced transcription of the COX-2-dependent genes amphiregulin, epiregulin, inhibin-β-A, and follistatin was insensitive to BAPTA-AM preincubation. We found that ET-1 can induce intracellular calcium release in HPASMC (Fig. 8C) and that the ETa-specific antagonist BQ123 had the greater ability to block ET-1-induced intracellular calcium accumulation (Fig. 8D). To further explore the calcium regulatory pathways we studied the effect of a number of inhibitors of different calcium regulatory processes on intracellular calcium and on expression of the calcium-regulated genes. ET-1-induced [Ca2+]i was not inhibited by selective L-type voltage-operated calcium channel (VOCC) blockade by nicardipine, N-type VOCC blockade by ω-conotoxin GVIA, combined N/P/Q VOCC blockade by ω-conotoxin MVIIC, or N/P-type VOCC blockade by ω-agatoxin IVA nor the phospholipase C inhibitor U73122 suggesting that L/N/P/Q channels were not involved nor was phospholipase C-regulated intracellular IP3 generation and release of calcium from internal stores.
FIGURE 8.
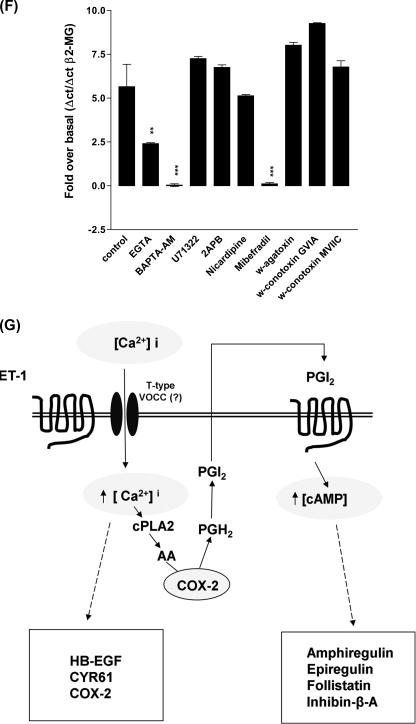
ET-1/ETa receptor-stimulated intracellular calcium release is required for COX-2 independent, ET-1-induced gene expression but not for PGE2- or iloprost-induced gene expression. HPASMC were treated with inhibitor and agonist combinations and Q-PCR were performed against 1st strand cDNA synthesized from total RNA with primer sets for each gene. A, COX-2, CYR61, HB-EGF, amphiregulin, epiregulin, inhibin-β-A, and follistatin gene expression are induced by ET-1 (1 × 10⁻⁸ m) (0 h, open bar; 2 h, black bar) and blocked by BAPTA-AM (5 × 10⁻⁵ m) preincubation for 30 min (spotted bar for 0 h and gray bar for 2 h post-ET-1 addition). B, amphiregulin, epiregulin, Inhibin-β-A, and follistatin gene expression were induced by iloprost (1 × 10⁻⁸ m) after 2 h (black bar) but not inhibited by preincubation with BAPTA-AM (gray bars) after 2 h. All measurements were performed with reference to the β2-microglobulin gene (β-2MG). All measurements represent the mean ± S.E. of three independent experiments. ET-1 induces intracellular calcium accumulation by stimulating the ETa receptor. HPASMC were incubated with Fluo-4-AM for 30 min with inhibitor or antagonist prior to ET-1 addition followed by measurement of Ca2+/Fluo-4 fluorescence. Data are the difference between minimum and maximum fluorescence response for each treatment. C, there is a concentration/response relationship between ET-1 and the calcium intracellular accumulation. D, the ETa-specific antagonist, BQ123, and the dual ETa/ETb antagonist, bosentan, block ET-1-induced calcium accumulation. ET-1-induced intracellular calcium accumulation and consequent COX-2 gene expression are dependent upon extracellular calcium and the activity of T-type voltage-operated calcium channels. E, the intracellular calcium chelator, BAPTA-AM (5 × 10⁻⁵ m), the N and T-type voltage-operated calcium channel inhibitor, Mibefradil (4 × 10⁻⁵ m) decrease ET-1-induced intracellular calcium accumulation in HPASMC. The phospholipase C inhibitor U73122 (1 × 10⁻⁵ m), L-type voltage-operated calcium channel inhibitor nicardipine (4 × 10⁻⁵ m), N- and P-type voltage-operated calcium channel inhibitor ω-agatoxin-IVA (1 × 10⁻⁸ m), N-type voltage operated calcium channel inhibitor, ω-conotoxin-GVIA (1 × 10⁻⁶ m), and N/P/Q-type voltage-operated calcium channel inhibitor, ω-conotoxin-MVIIC (1 × 10⁻⁶ m) had no effect on ET-1-induced HPASMC intracellular calcium release. HPASMC were loaded with Fluo-4-AM and the relevant inhibitor for 30 min prior to stimulation with ET-1 (1 × 10⁻⁸ m). Measurements are a % of the maximum ET-1-induced response over basal fluorescence. ET-1-induced COX-2 (F) mRNA accumulation is inhibited by calcium chelation, BAPTA-AM, and blockade of T-type voltage-operated calcium channels (no nicardipine block, effective mibefradil block). HPASMC were pretreated with identical concentrations of calcium metabolism inhibitors as in E, for 30 min, prior to stimulation with ET-1 (1 × 10⁻⁸ m) for 2 h. Gene expression was assessed by Q-PCR of the 1st strand cDNA with comparison to the β2-microglobulin gene. All measurements represent the mean ± standard error of three independent experiments. Schematic representation of the interdependent calcium and cAMP second-messenger pathways, linking ET-1 and CRE activity in HPASMC (G).
In contrast the dual blocker of L-type and T-type VOCC Mibefradil at micromolar concentrations (42), markedly reduced ET-1-induced [Ca2+]i (Fig. 8E). As the L-type blocker nicardipine was without effect this suggests that calcium entry through T-type channels is the main source of the increase in intracellular calcium. Consistent with this mibefradil was the only inhibitor that completely blocked COX-2 expression (supplemental Fig. S1F). Other calcium-regulated genes such as HB-EGF and CYR61 expression showed a similar inhibitory pattern (data not shown).
DISCUSSION
There are a number of important novel findings in our study. We found that ET-1 induces expression of vascular remodeling and angiogenic genes via two interlinked pathways. One pathway involves cPLA2 and COX-2 generation of prostacyclin and IP receptor-mediated elevation of cAMP. Epiregulin, amphiregulin, follistatin, and inhibin-β-A are regulated in this manner. The other pathway is a COX-2 activity independent, calcium-dependent pathway. COX-2 itself, CYR61 and HB-EGF are regulated by this latter pathway. Furthermore, ours is the first report of ET-1 causing induction of amphiregulin, a member of the EGF family of growth factors, in any biological system. Collectively these studies give important insights into the upstream signaling mechanisms used by GPCR-linked mediators such as ET-1, to activate CRE response genes involved in angiogenesis, vascular remodeling, inflammation, and carcinogenesis.
We found that the ETa receptor was the main ET-1 receptor mediating the effects in our experiments. Previous investigators have shown that ETa receptors predominate on vascular smooth muscle cells (43, 44) and that the ETa receptor couples to increased intracellular calcium via elevated phospholipase C activation by Gαq (45). There are observations of ETa coupling to cAMP production or cAMP-dependent mechanisms in vascular smooth muscle (28, 29) although in the second study the elevation of PKA activity was measured and not the production of cellular cAMP. Eguchi and co-workers (28) have demonstrated that there is a predominance of ETa receptor and that the production of cAMP in the rat vascular smooth muscle was direct and not dependent upon cyclooxygenase activity. Our studies showed that the ratio of ETa to ETb receptor is indeed high in human pulmonary artery smooth muscle cells and that the addition of ET-1 results in rapidly elevated cAMP, blocked more effectively by the ETa-specific antagonist BQ123 than the ETb-specific antagonist BQ788.
Previous studies in airway smooth muscle cells involving bradykinin and the BK1 receptor, have demonstrated a link between a Gαq-linked receptor, regulation of COX-2 expression, and the production of PGE2 leading to stimulation of GαS-linked EP receptor increasing cAMP synthesis (46). The parallel observation of ET-1 and ETa coupling to cAMP synthesis prompted us to look for a COX-2-dependent autocrine loop, we therefore went on to study the role of endogenous prostanoids in cAMP generation produced by ET-1. We found that ETa-dependent increases in cAMP production were almost completely blocked by the COX-2 selective inhibitor NS398. These observations imply that there is COX-2-dependent mechanism for ET-1-induced cAMP synthesis. We hypothesized that an eicosanoid-dependent autocrine loop exists in vascular smooth muscle dependent upon ETa and COX-2 activity. Evidence to support this hypothesis is 3-fold. We found that COX-2 gene transcription and protein production were rapidly up-regulated in response to ET-1, HPASMC had the elevated arachidonic acid release in response to ET-1, and PGI2 was secreted in response to ET-1. In a final observation to establish that the ET-1 to PGI2 autocrine loop is functionally coupled in HPASMC, we demonstrated that ET-1-increased cAMP synthesis was blocked by the IP receptor antagonist RO3244794 (22) but not by the EP1/EP2 antagonist AH6809 (47) or EP4 selective antagonist L161982 (48). This suggests that ET-1 acts on ETa receptors to mobilize arachidonic acid, which is subsequently converted to PGI2 via COX-2 and that this then acts in an autocrine manner on IP prostanoid receptors to increase cAMP. Although there was an increase in both COX-1 transcription and protein accumulation in response to ET-1 (Fig. 2, B and C) the selective COX-2 inhibitor NS398 (20) blocks all ET-1 induced PGI2 synthesis, all cAMP accumulation, and the ET-1-induced activation of the 6xCRE-luciferase reporter, indicating that in this system the slight increase COX-1 expression does not have a role in the rapid coupling of the ET-1-induced PGI2 production (Fig. 3C at 2 h) or the continued synthesis of PGI2 at later time points (Fig. 3C at 8 h). The potential long term role of COX-1 induced by ET-1 beyond the 8-h period remains to be studied.
Previous studies have shown that ET-1 can increase PGI2 release and have studied the receptor involved but have not linked this to cAMP generation and activation of CRE-dependent genes. These studies show that ETa and ETb mediate PGI2 generation differently in different tissues. For example, in endothelial cells Matsuda et al. (49) demonstrated that COX-dependent PGI2 release from vascular endothelial cells is via the ET-1-stimulated ETb receptor. ET-1 has been shown to increase PGI2 in several organ systems. For example, ET-1 increased PGI2 in the whole lung or kidney was blocked by the ETa agonist BQ123, implying that PGI2 is increased by ETa stimulation (50). Similar findings were reported in perfused rabbit kidney with BQ132 blocking ET-1-induced PGI2 release (51). In contrast ETb receptor stimulation mediated PGI2 synthesis and NO release in guinea pig aorta (49), rat cerebral basilar artery (52), or rat carotid artery (53).
We then studied the role of the ETa-mediated changes in cAMP on the induction of remodeling genes. A number of important genes have CRE response elements in their promoters (27). Increases in intracellular calcium and cAMP can lead to elevated phosphorylation and activation of CREB and as a consequence binding to and activation of CRE elements (54, 55). We first showed that ET-1 could increase the activity of a transiently transfected CRE luciferase reporter, suggesting that the changes in cAMP induced by ET-1 were sufficient to stimulate CRE response elements on native genes. As with iloprost-stimulated increases in cAMP, CRE activation was also increased by iloprost. Few previous studies have looked at the CRE or CREB activation by ET-1. Egan and Nixon (56) showed that CREB activation by ET-1 is calcium dependent in rat neonatal vascular smooth muscle cells but did not study the role of cAMP or the possible linking of calcium and cAMP signaling by an autocrine loop dependent upon COX-1/2 activity.
We then used an array method to identify genes that were up-regulated by ET-1. Because we had established that endothelin-1 can increase CRE activity in HPASM cells we chose a “functional” array whose cDNAs were derived from genes with known CRE elements in their promoters or the recorded ability to respond to increases in intracellular calcium. Screening of an array of 96 genes in response to ET-1 yielded 5 genes that were up-regulated by at least 2-fold over basal or control, namely amphiregulin, follistatin, COX-2, inhibin-β-A, and CYR61. Amphiregulin is a member of the EGF-related family of growth factors and because members of the EGF family are often co-expressed (34, 57) we also measured the expression of other EGF family members (32) and found that ET-1 increased the mRNA expression of epiregulin and HB-EGF. Although there have not been previous studies to establish the role of a functional CRE in the epiregulin promoter, epiregulin transcription responds to elevated cAMP in human ovarian follicular cells (58) and PGE2-induced amphiregulin and epiregulin mRNA expression in human granulosa cells are blocked by PKA inhibitors (59). Both studies imply a role for a cAMP responsive mechanism in the epiregulin promoter. Again for HB-EGF there is no characterized CRE promoter element and the mechanism by which ET-1 increases HB-EGF transcription remains to be explored. We then confirmed that the genes identified in the array were up-regulated with Q-PCR and in the case of amphiregulin both Q-PCR and ELISA. We then determined whether or not the COX-2/PGI2 autocrine loop was involved in their mRNA expression by inhibiting cyclooxygenase activity during an ET-1 time course or by stimulating expression directly with iloprost. We found that ET-1 induction of amphiregulin, epiregulin, follistatin, and inhibin-β-A mRNA were COX dependent and iloprost induced, whereas ET-1-induced expression of HB-EGF, COX-2, and CYR61 induction were COX independent as they were not inhibited by COX inhibitors nor stimulated by iloprost, these observations were confirmed by siRNA depletion of COX-2 and the IP receptor.
In addition to being activated by the cAMP/PKA/CREB, the CREs can be directly activated via Gαq/Ca2+-dependent signal transduction pathways (60). We therefore used the calcium chelator BAPTA-AM to determine whether the up-regulated genes were calcium dependent. We found that COX/PGI2-independent genes HB-EGF, COX-2, and CYR61 were all calcium dependent. ET-1 induction of COX/PGI2-dependent genes amphiregulin, epiregulin, follistatin, and inhibin-β-A were also blocked by BAPTA-AM, however, their iloprost-induced expression was not. PGI2 release is dependent upon COX-2 synthesis of PGH2 from arachidonic acid released by ET-1-induced, calcium-dependent cPLA2 activity (61). Chelation of intracellular calcium by BAPTA-AM can prevent cPLA2 activation and the subsequent accumulation of PGI2 leading to decreased IP receptor-dependent gene expression. Because ET-1-induced [Ca2+]i plays such a central role in linking ETa and IP receptor signal transduction in HPASMC we examined the mechanism of calcium release. Our results suggested that calcium entry through a T-type calcium entry channel was responsible for ET-induced rises in intracellular calcium and this was mirrored by studies of gene expression. This is consistent with the work of Rodman et al. (62) who demonstrate that T-type VOCC are expressed both in cultured HPASMC and in the smooth muscle of intact pulmonary artery and are involved in ET-induced functional cell responses. From our own observations, the ET-1-induced increase in [Ca2+]i is dependent upon T-type VOCC activity leading to calcium-dependent gene expression and cPLA2/COX-2-dependent synthesis and release of PGI2 leading to IP receptor activity with consequent gene expression. We have summarized these observations in Fig. 8G.
In conclusion we have characterized the mechanisms leading to activation of CRE-dependent genes in pulmonary vascular smooth muscle and found that this occurs through interaction of calcium-dependent pathways and an autocrine COX-2/PGI2/IP receptor loop. We are the first to observe ET-1-dependent HB-EGF transcriptional regulation and the IP receptor co-regulation of epiregulin, amphiregulin, follistatin, and inhibin-β-A. These observations provide important information on how CRE-dependent remodeling genes are activated in vascular smooth muscle cells.
Supplementary Material
This work was supported by the British Heart Foundation and the Wellcome Trust.

The on-line version of this article (available at http://www.jbc.org) contains supplemental Fig. S1 and Table S1.
- CRE
- cAMP response elements
- Q-PCR
- quantitative PCR
- ELISA
- enzyme-linked immunosorbent assay
- VOCC
- voltage-operated calcium channel
- CREB
- cyclic AMP responsive element-binding protein
- PKA
- protein kinase A
- COS-2
- cyclooxygenase 2
- GPCR
- G protein-coupled receptor
- EGF
- epidermal growth factor
- siRNA
- small interfering RNA
- PGI
- prostaglandin I
- HPASMC
- human proximal pulmonary artery smooth muscle cells
- BAPTA-AM
- 1,2-bis(2-aminophenoxy)ethane-N,N,N′,N′-tetraacetic acid-acetoxymethyl
- ET
- endothelin.
REFERENCES
- 1.Yanagisawa M., Kurihara H., Kimura S., Tomobe Y., Kobayashi M., Mitsui Y., Yazaki Y., Goto K., Masaki T. (1988) Nature 332, 411–415 [DOI] [PubMed] [Google Scholar]
- 2.Woods M., Mitchell J. A., Wood E. G., Barker S., Walcot N. R., Rees G. M., Warner T. D. (1999) Mol. Pharmacol. 55, 902–909 [PubMed] [Google Scholar]
- 3.Ehrenreich H., Anderson R. W., Fox C. H., Rieckmann P., Hoffman G. S., Travis W. D., Coligan J. E., Kehrl J. H., Fauci A. S. (1990) J. Exp. Med. 172, 1741–1748 [DOI] [PMC free article] [PubMed] [Google Scholar]
- 4.Suzuki T., Kumazaki T., Mitsui Y. (1993) Biochem. Biophys. Res. Commun. 191, 823–830 [DOI] [PubMed] [Google Scholar]
- 5.Markewitz B. A., Kohan D. E., Michael J. R. (1995) Am. J. Physiol. Lung Cell. Mol. Physiol. 268, L192–L200 [DOI] [PubMed] [Google Scholar]
- 6.Brunner F., Stessel H., Graier W. F. (1995) Agents Actions Suppl. 45, 269–273 [DOI] [PubMed] [Google Scholar]
- 7.Sharefkin J. B., Diamond S. L., Eskin S. G., McIntire L. V., Dieffenbach C. W. (1991) J. Vasc. Surg. 14, 1–9 [PubMed] [Google Scholar]
- 8.Sugiura M., Inagami T., Kon V. (1989) Biochem. Biophys. Res. Commun. 161, 1220–1227 [DOI] [PubMed] [Google Scholar]
- 9.Castañares C., Redondo-Horcajo M., Magán-Marchal N., ten Dijke P., Lamas S., Rodríguez-Pascual F. (2007) J. Cell Sci. 120, 1256–1266 [DOI] [PubMed] [Google Scholar]
- 10.Schinelli S., Zanassi P., Paolillo M., Wang H., Feliciello A., Gallo V. (2001) J. Neurosci. 21, 8842–8853 [DOI] [PMC free article] [PubMed] [Google Scholar]
- 11.Scott M. G., Swan C., Jobson T. M., Rees S., Hall I. P. (1999) Br. J. Pharmacol. 128, 721–729 [DOI] [PMC free article] [PubMed] [Google Scholar]
- 12.Pang L., Holland E., Knox A. J. (1998) Am. J. Physiol. Lung Cell. Mol. Physiol. 275, L322–L329 [DOI] [PubMed] [Google Scholar]
- 13.Kumari R., Robertson J. F., Watson S. A. (2006) Int. J. Cancer 119, 49–59 [DOI] [PubMed] [Google Scholar]
- 14.Deacon K., Blank J. L. (1997) J. Biol. Chem. 272, 14489–14496 [DOI] [PubMed] [Google Scholar]
- 15.Nishimura J., Chen X., Jahan H., Shikasho T., Kobayashi S., Kanaide H. (1992) Biochem. Biophys. Res. Commun. 188, 719–726 [DOI] [PubMed] [Google Scholar]
- 16.Luscher T. F., Yang Z., Kiowski W., Linder L., Dohi Y., Diederich D. (1992) J. Hum. Hypertens. 6, Suppl. 2, S3–8 [PubMed] [Google Scholar]
- 17.Ohlstein E. H., Arleth A., Bryan H., Elliott J. D., Sung C. P. (1992) Eur. J. Pharmacol. 225, 347–350 [DOI] [PubMed] [Google Scholar]
- 18.Russell F. D., Davenport A. P. (1995) J. Cardiovasc. Pharmacol. 26, Suppl. 3, S346–347 [PubMed] [Google Scholar]
- 19.Hamroun D., Mathieu M. N., Clain E., Germani E., Laliberté M. F., Laliberté F., Chevillard C. (1995) J. Cardiovasc. Pharmacol. 26, Suppl. 3, S156–158 [PubMed] [Google Scholar]
- 20.Futaki N., Takahashi S., Yokoyama M., Arai I., Higuchi S., Otomo S. (1994) Prostaglandins 47, 55–59 [DOI] [PubMed] [Google Scholar]
- 21.Seno K., Okuno T., Nishi K., Murakami Y., Watanabe F., Matsuura T., Wada M., Fujii Y., Yamada M., Ogawa T., Okada T., Hashizume H., Kii M., Hara S., Hagishita S., Nakamoto S., Yamada K., Chikazawa Y., Ueno M., Teshirogi I., Ono T., Ohtani M. (2000) J. Med. Chem. 43, 1041–1044 [DOI] [PubMed] [Google Scholar]
- 22.Bley K. R., Bhattacharya A., Daniels D. V., Gever J., Jahangir A., O'Yang C., Smith S., Srinivasan D., Ford A. P., Jett M. F. (2006) Br. J. Pharmacol. 147, 335–345 [DOI] [PMC free article] [PubMed] [Google Scholar]
- 23.Kiriyama M., Ushikubi F., Kobayashi T., Hirata M., Sugimoto Y., Narumiya S. (1997) Br. J. Pharmacol. 122, 217–224 [DOI] [PMC free article] [PubMed] [Google Scholar]
- 24.Weinreb M., Shamir D., Machwate M., Rodan G. A., Harada S., Keila S. (2006) Prostaglandins Leukot. Essent. Fatty Acids 75, 81–90 [DOI] [PubMed] [Google Scholar]
- 25.Shaywitz A. J., Greenberg M. E. (1999) Annu. Rev. Biochem. 68, 821–861 [DOI] [PubMed] [Google Scholar]
- 26.Stork P. J., Schmitt J. M. (2002) Trends Cell Biol. 12, 258–266 [DOI] [PubMed] [Google Scholar]
- 27.Mayr B., Montminy M. (2001) Nat. Rev. Mol. Cell Biol. 2, 599–609 [DOI] [PubMed] [Google Scholar]
- 28.Eguchi S., Hirata Y., Imai T., Marumo F. (1993) Endocrinology 132, 524–529 [DOI] [PubMed] [Google Scholar]
- 29.Davis A., Hogarth K., Fernandes D., Solway J., Niu J., Kolenko V., Browning D., Miano J. M., Orlov S. N., Dulin N. O. (2003) Cell. Signal. 15, 597–604 [DOI] [PubMed] [Google Scholar]
- 30.Endoh M., Fujita S., Yang H. T., Talukder M. A., Maruya J., Norota I. (1998) Life Sci. 62, 1485–1489 [DOI] [PubMed] [Google Scholar]
- 31.Kitagawa K. (2007) FEBS J. 274, 3210–3217 [DOI] [PubMed] [Google Scholar]
- 32.Harris R. C., Chung E., Coffey R. J. (2003) Exp. Cell Res. 284, 2–13 [DOI] [PubMed] [Google Scholar]
- 33.Kato M., Inazu T., Kawai Y., Masamura K., Yoshida M., Tanaka N., Miyamoto K., Miyamori I. (2003) Biochem. Biophys. Res. Commun. 301, 1109–1115 [DOI] [PubMed] [Google Scholar]
- 34.Ornskov D., Nexo E., Sorensen B. S. (2007) Biochem. Biophys. Res. Commun. 354, 885–891 [DOI] [PubMed] [Google Scholar]
- 35.Chansel D., Ciroldi M., Vandermeersch S., Jackson L. F., Gomez A. M., Henrion D., Lee D. C., Coffman T. M., Richard S., Dussaule J. C., Tharaux P. L. (2006) FASEB J. 20, 1936–1938 [DOI] [PubMed] [Google Scholar]
- 36.Matsumae H., Yoshida Y., Ono K., Togi K., Inoue K., Furukawa Y., Nakashima Y., Kojima Y., Nobuyoshi M., Kita T., Tanaka M. (2008) Arterioscler. Thromb. Vasc. Biol. 28, 1077–1083 [DOI] [PubMed] [Google Scholar]
- 37.Higashiyama S., Abraham J. A., Klagsbrun M. (1993) J. Cell Biol. 122, 933–940 [DOI] [PMC free article] [PubMed] [Google Scholar]
- 38.Wang S. W., Oh C. K., Cho S. H., Hu G., Martin R., Demissie-Sanders S., Li K., Moyle M., Yao Z. (2005) J. Allergy Clin. Immunol. 115, 287–294 [DOI] [PubMed] [Google Scholar]
- 39.Sun Z. J., Wang Y., Cai Z., Chen P. P., Tong X. J., Xie D. (2008) Br. J. Cancer 99, 1656–1667 [DOI] [PMC free article] [PubMed] [Google Scholar]
- 40.Baba I., Shirasawa S., Iwamoto R., Okumura K., Tsunoda T., Nishioka M., Fukuyama K., Yamamoto K., Mekada E., Sasazuki T. (2000) Cancer Res. 60, 6886–6889 [PubMed] [Google Scholar]
- 41.Greenwald J. E., Apkon M., Hruska K. A., Needleman P. (1989) J. Clin. Invest. 83, 1061–1065 [DOI] [PMC free article] [PubMed] [Google Scholar]
- 42.Mehrke G., Zong X. G., Flockerzi V., Hofmann F. (1994) J. Pharmacol. Exp. Ther. 271, 1483–1488 [PubMed] [Google Scholar]
- 43.Yu J. C., Davenport A. P. (1995) J. Cardiovasc. Pharmacol. 26, Suppl. 3, S348–350 [PubMed] [Google Scholar]
- 44.Hislop A. A., Zhao Y. D., Springall D. R., Polak J. M., Haworth S. G. (1995) Am. J. Respir. Cell Mol. Biol. 12, 557–566 [DOI] [PubMed] [Google Scholar]
- 45.Zhang W. M., Yip K. P., Lin M. J., Shimoda L. A., Li W. H., Sham J. S. (2003) Am. J. Physiol. Lung Cell. Mol. Physiol. 285, L680–690 [DOI] [PubMed] [Google Scholar]
- 46.Pang L., Knox A. J. (1997) Am. J. Physiol. Lung Cell. Mol. Physiol. 273, L1132–1140 [Google Scholar]
- 47.Coleman R. A., Kennedy I., Sheldrick R. L. (1987) Adv. Prostaglandin Thromboxane Leukotriene Res. 17A, 467–470 [PubMed] [Google Scholar]
- 48.Ma W., Quirion R. (2005) J. Neurochem. 93, 664–673 [DOI] [PubMed] [Google Scholar]
- 49.Matsuda H., Beppu S., Ohmori F., Yamada M., Miyatake K. (1993) Heart Vessels 8, 121–127 [DOI] [PubMed] [Google Scholar]
- 50.D'Orléans-Juste P., Yano M., Télémaque S. (1993) J. Cardiovasc. Pharmacol. 22, Suppl. 8, S235–238 [DOI] [PubMed] [Google Scholar]
- 51.Télémaque S., Gratton J. P., Claing A., D'Orléans-Juste P. (1993) Eur. J. Pharmacol. 237, 275–281 [DOI] [PubMed] [Google Scholar]
- 52.Feger G. I., Schilling L., Ehrenreich H., Wahl M. (1997) Res. Exp. Med. 196, 327–337 [DOI] [PubMed] [Google Scholar]
- 53.Tirapelli C. R., Casolari D. A., Yogi A., Montezano A. C., Tostes R. C., Legros E., D'Orléans-Juste P., de Oliveira A. M. (2005) Br. J. Pharmacol. 146, 903–912 [DOI] [PMC free article] [PubMed] [Google Scholar]
- 54.Johannessen M., Moens U. (2007) Front. Biosci. 12, 1814–1832 [DOI] [PubMed] [Google Scholar]
- 55.Della Fazia M. A., Servillo G., Sassone-Corsi P. (1997) FEBS Lett. 410, 22–24 [DOI] [PubMed] [Google Scholar]
- 56.Egan C. G., Nixon G. F. (2004) Cell. Signal. 16, 1387–1396 [DOI] [PubMed] [Google Scholar]
- 57.Ornskov D., Nexo E., Sorensen B. S. (2006) FEBS J. 273, 5479–5489 [DOI] [PubMed] [Google Scholar]
- 58.Freimann S., Ben-Ami I., Dantes A., Ron-El R., Amsterdam A. (2004) Biochem. Biophys. Res. Commun. 324, 829–834 [DOI] [PubMed] [Google Scholar]
- 59.Ben-Ami I., Freimann S., Armon L., Dantes A., Strassburger D., Friedler S., Raziel A., Seger R., Ron-El R., Amsterdam A. (2006) Mol. Hum. Reprod. 12, 593–599 [DOI] [PubMed] [Google Scholar]
- 60.Rosethorne E. M., Nahorski S. R., Challiss R. A. (2008) Biochem. Pharmacol. 75, 942–955 [DOI] [PMC free article] [PubMed] [Google Scholar]
- 61.Trevisi L., Bova S., Cargnelli G., Ceolotto G., Luciani S. (2002) Biochem. Pharmacol. 64, 425–431 [DOI] [PubMed] [Google Scholar]
- 62.Rodman D. M., Reese K., Harral J., Fouty B., Wu S., West J., Hoedt-Miller M., Tada Y., Li K. X., Cool C., Fagan K., Cribbs L. (2005) Circ. Res. 96, 864–872 [DOI] [PubMed] [Google Scholar]
Associated Data
This section collects any data citations, data availability statements, or supplementary materials included in this article.


