

Abstract
Calmodulin (CaM) activates the nitric-oxide synthases (NOS) by a mechanism that is not completely understood. A recent crystal structure showed that bound CaM engages in a bridging interaction with the NOS FMN subdomain. We investigated its importance in neuronal NOS (nNOS) by mutating the two residues that primarily create the bridging interaction (Arg752 in the FMN subdomain and Glu47 in CaM). Mutations designed to completely destroy the bridging interaction prevented bound CaM from increasing electron flux through the FMN subdomain and diminished the FMN-to-heme electron transfer by 90%, whereas mutations that partly preserve the interaction had intermediate effects. The bridging interaction appeared to control FMN subdomain interactions with both its electron donor (NADPH-FAD subdomain) and electron acceptor (heme domain) partner subdomains in nNOS. We conclude that the Arg752–Glu47 bridging interaction is the main feature that enables CaM to activate nNOS. The mechanism is bi-modal and links a single structural aspect of CaM binding to specific changes in nNOS protein conformational and electron transfer properties that are essential for catalysis.
Keywords: Crystal Structure, Enzyme Mechanisms, Nitric-oxide Synthase, Pre-steady-state Kinetics, Protein Structure, Protein-Protein Interactions, Calmodulin, Electron Transfer, Flavoprotein, Hemeprotein
Introduction
Nitric oxide (NO)4 is an essential signal and effector molecule in biology (1). NO is produced in animals from l-Arg by the NO synthases (NOS, EC 1.14.13.39) (2). Three types of NOS are expressed in mammals: inducible NOS (iNOS), endothelial NOS (eNOS), and neuronal NOS (nNOS) (3–5). The three NOS are structurally homologous and are active as homodimers (6, 7). Each NOS monomer is comprised of two domains: an N-terminal oxygenase domain (NOSoxy) that contains cofactors protoporphyrin IX (heme) and (6R)-5,6,7,8-tetrahydro-l-biopterin (H4B) and binds the substrate l-Arg, and a C-terminal reductase domain that contains FAD, FMN, and binds NADPH. The NOS reductase domain is homologous to cytochrome P-450 reductase and related dual-flavin enzymes (5, 8), but also contains up to three regulatory inserts that are unique to the NOS enzymes (3, 5). Significantly, a calmodulin (CaM) binding site is located in the connecting sequence between the NOSoxy and reductase domains (3–5). CaM binding to this site activates NO synthesis by triggering electron transfer to the heme in NOS enzymes (9). The ability of CaM to activate a redox enzyme like NOS is novel and the mechanism is a topic of current interest.
Much of the actions of CaM impinge on the NOS FMN subdomain, which is thought to undergo large conformational motions to transfer electrons during catalysis (10–17). This may be a common feature in the dual-flavin reductase enzyme family (18–20). Fig. 1 illustrates a model for FMN conformational switching during electron transfer between the FMN and heme within a NOS homodimer. The FMN subdomain must first interact with the NADPH-FAD subdomain (FNR) in a “FMN-shielded” conformation to receive electrons, according to equilibrium A. Once the FMN hydroquinone forms (FMNH2), it must swing away to a “FMN-deshielded” conformation, and then must interact with the NOSoxy domain in the partner subunit of a NOS dimer, according to equilibrium B. Its interaction with the NOSoxy domain allows the FMN-to-heme electron transfer (10–17). Current data suggest that conformational equilibria A and B have their own intrinsic set points (Keq) and individual control (10, 12, 21), and that the FMN-to-heme electron transfer step is fast (12, 13, 22, 23), which implies the conformational kinetic parameters may be rate-limiting for the entire process.
FIGURE 1.
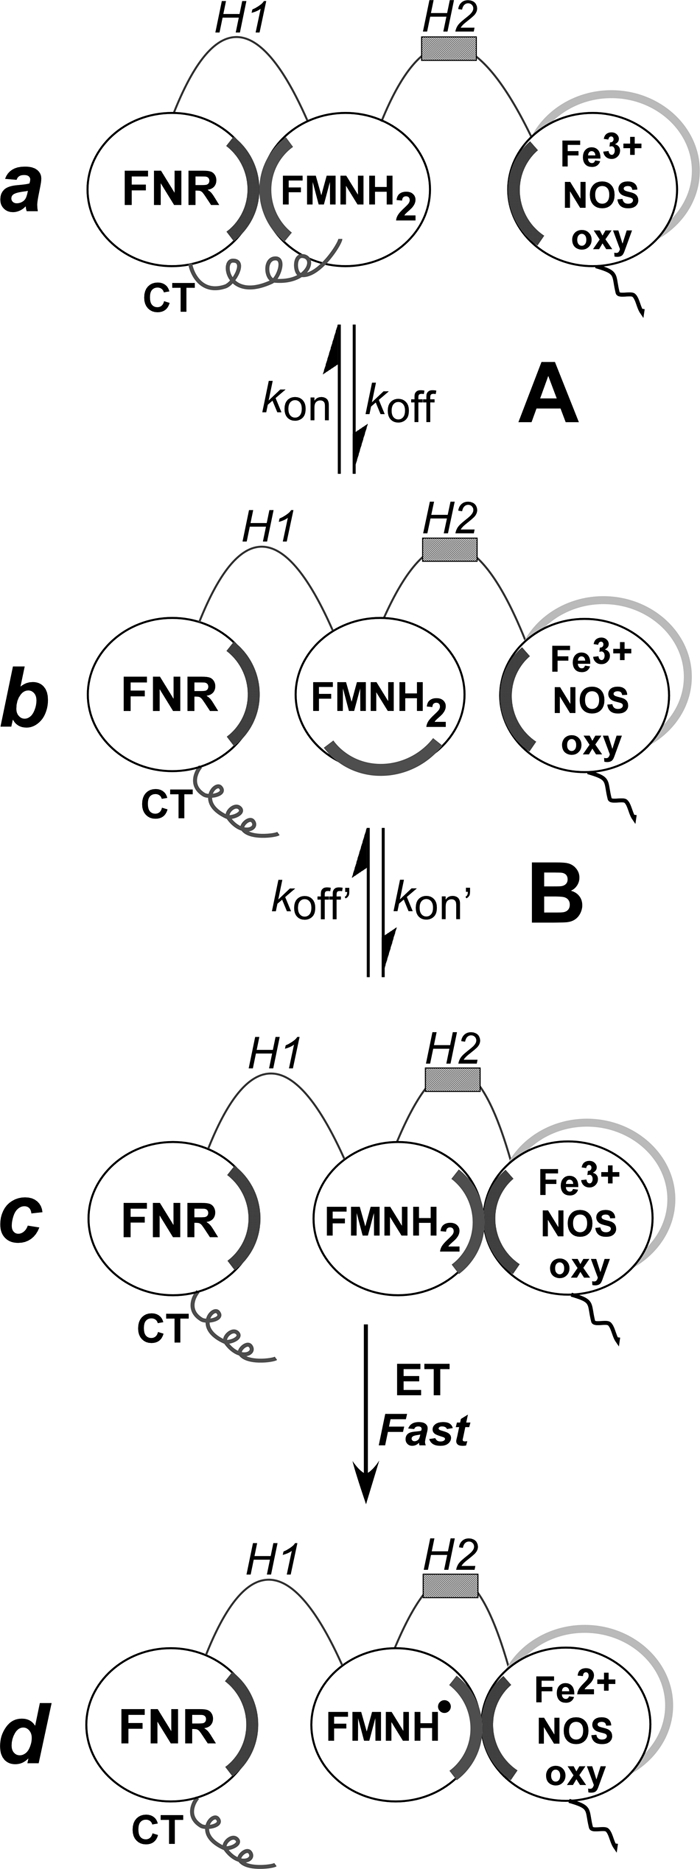
Model of NOS FMN subdomain function in electron transfer and heme reduction. Electron transfer in NOS is mainly regulated by two conformational equilibria (A and B). Equilibrium A indicates the change between a conformation in which FNR and FMN subdomains are interacting (a) and a conformation where the FMN subdomain is deshielded and available for interaction with electron acceptors such as cytochrome c (b). Note that the CT stabilizes the conformation a. Equilibrium B indicates the transition from the FMN deshielded conformation (b) to a FMN-NOSoxy domain interacting state (c). Once the FMN and the oxy domains are close, electron transfer to the heme is fast (d).
In CaM-free NOS, the FMN-shielded conformation of equilibrium A is relatively stable and a crystal structure of the nNOS reductase domain (nNOSr) in this conformation is available (17). CaM binding destabilizes the FMN-shielded conformation and shifts equilibrium A toward the FMN-deshielded form (10, 11). Mutagenesis studies have shown or implied that equilibrium A is controlled by up to four structural features in NOSr. These are a C-terminal tail extension (CT) and an autoinhibitory insert in the FMN subdomain (AI), both are unique to NOS enzymes, a β-finger structural element, and some of the charge-pairing interactions that occur within the FNR-FMN subdomain interface (15, 24–30). The CT, AI, and charge pairing interactions all stabilize the FMN-shielded state of equilibrium A in the CaM-free NOS. CaM binding changes equilibrium A by disabling the influence of the CT and perhaps also the AI control element (27), but the molecular details of the various actions of CaM remain a matter of conjecture (10, 25).
Even less is known about the FMN-NOSoxy interaction described by equilibrium B in Fig. 1 with regard to the structural details or how it is regulated by CaM. CaM binding triggers heme reduction in NOS enzymes (9) and so must control the FMN-NOSoxy interaction of equilibrium B. The interaction has been probed by studying electron transfer within partial protein constructs of NOS that contain the linked FMN-CaM-NOSoxy domains (12, 13, 22, 23). Although an FMN-NOSoxy interaction was apparent from these studies, the extent of the interaction could not be determined. Our recent investigation of equilibrium B using a similar FMN-CaM-NOSoxy construct of nNOS indicated that the open (non-interacting) conformation is highly populated (>90%) under all conditions tested (12). Curiously, we found that CaM binding caused no measurable increase in the extent of the FMN-NOSoxy interaction (12). This led us to suggest that CaM may trigger heme reduction by enabling a subset of FMN-NOSoxy interactions to occur that are productive for FMN-to-heme electron transfer (10). This effect could be achieved if CaM restricted or directed the motion of the FMN subdomain, without causing a large shift in the Keq of equilibrium B. Whether this occurs is unclear.
A recent crystal structure of a FMN-CaM protein construct of iNOS (31) shows how CaM might influence FMN subdomain motion in NOS enzymes. In the structure an Arg residue forms both salt bridge and hydrogen bonding interactions that structurally connect or “bridge” the FMN subdomain with the bound CaM. A homology model of nNOS based on the iNOS FMN-CaM structure is shown in Fig. 2. Although the importance of this bridging function in NOS catalysis was not tested in their report (31), the authors note that the Arg residue is strictly conserved among NOS enzymes, and they discuss various evidence that a similar CaM-FMN bridging interaction is likely to exist in the nNOS and eNOS enzymes. We therefore examined the importance of the putative bridging interaction in nNOS, which unlike iNOS, has facile CaM binding that can be easily reversed or substituted with mutant CaM proteins, which greatly aids the investigation. We performed site-directed mutagenesis on the analogous residue in rat nNOS (Arg752) and the analogous main interacting residue in rat CaM (Glu47) to neutralize or reverse their side chain charges, and then studied how the changes impact CaM binding and its control of nNOS electron flux, conformational motions, heme reduction, and catalytic activities. We also compared how the mutations influence the same aspects in a CT-deleted nNOS protein, to assess the importance of the CT in any CaM functions that we might find are dependent on the Arg752–Glu47 bridging interaction. Our results show that the bridging interaction (i) is the primary means by which bound CaM influences nNOS electron transfer and catalytic activity, and (ii) acts by a bi-modal mechanism that affects both equilibrium A and B. Thus, our work helps uncover a molecular basis for CaM control of the conformational, electron transfer, and catalytic properties of NOS enzymes.
FIGURE 2.

FMN-CaM nNOS model built by homology methods from the reported iNOS FMN-CaM complex (see “Materials and Methods” for details). Top, general view of the complex, the nNOS FMN subdomain is shown in light gray (right side, with the helical CaM-binding region extending to the left side), CaM is shown in dark gray (left side, calcium atoms are shown as spheres). The autoinhibitory helix (AH or AI) is not present in iNOS and therefore its arrangement is tentative (bottom right). Bottom, detail of the nNOS Arg752 and CaM Glu47 region. Arg752 makes interactions (dashed lines) with CaM Glu47 and several backbone oxygens of the FMN subdomain. Different rotamers of the CaM Asn42 residue may interact with the backbone oxygen of Lys778 (interaction shown) or with Arg752.
MATERIALS AND METHODS
Reagents
H4B was purchased from Schircks Laboratories (Jona, Switzerland). CO gas was obtained from Praxair, Inc. (Danbury, CT). EPPS was purchased from Fisher Scientific (Pittsburgh, PA). DTT was purchased from RPI Corp. (Mount Prospect, IL). All other reagents were purchased from Sigma.
Site-directed Mutagenesis
Rat nNOS mutants were prepared by site-directed mutagenesis on a pCWori vector containing the cDNA of wild-type rat nNOS (32). Oligonucleotides for site-directed mutagenesis were obtained from Integrated DNA Technologies (Coralville, IA) and are listed in supplemental Table S1. Site-directed mutagenesis was performed using the QuikChange XL mutagenesis kit (Agilent Technologies-Stratagene, La Jolla, CA). Mutations were confirmed by DNA sequencing at the Cleveland Clinic Genomics Core Facility. Mutated plasmids were transformed into E. coli BL21(DE3) cells using the TransformAid bacterial transformation kit (Fermentas, Hanover, MD). Rat CaM plasmid was a gift from Dr. Anthony Persechini. Mutants E47A, E47Q, and E47R were prepared by site-directed mutagenesis on pT7 vector containing the cDNA of rat wild-type CaM. Oligonucleotides for site-directed mutagenesis were obtained from Integrated DNA Technologies (Coralville, IA) and are listed in supplemental Table S1.
Protein Expression and Purification
Wild-type and mutant nNOS proteins containing a His6 tag attached to their N termini were overexpressed in E. coli strain BL21(DE3) using a modified pCWori vector. Proteins were purified in the presence of H4B and l-Arg as previously described (32) but after the Ni2+-nitrilotriacetic acid-Sepharose CL-4B column, 2 mm CaCl2 was added to the sample and the 2′,5′-ADP-Sepharose column step replaced by a CaM-Sepharose column as reported for the purification of the reductase domain (33). Protein concentration was determined from the absorbance at 444 nm of the ferrous heme-CO complex, using an extinction coefficient of 76 mm−1 cm−1 (ΔAbs444–500 nm) (34).
The wild-type and mutant CaM proteins were expressed in E. coli. The transformed bacteria were grown at 37 °C in terrific broth supplemented with 125 mg/liter of ampicillin. Protein expression was induced when the cultures reached an A600 of 0.8 to 1 by adding 1 mm isopropyl β-d-thiogalactoside. After further growth at room temperature for 48 h, the cells were harvested and resuspended in buffer (50 mm Tris, pH 7.5) containing 100 mm NaCl, 2 mm EDTA, 1 mm phenylmethylsulfonyl fluoride, 1 mm DTT, and 1 mg/ml of lysozyme. Cells were lysed by freeze-thawing three times in liquid nitrogen followed by sonication for three 35-s pulses with a 1-min rest on ice between pulses. The cell lysate was centrifuged at 17,000 × g at 4 °C for 60 min in Beckman JA-17 rotor. The cell-free supernatant was put in a hot water bath at 65 °C for 5 to 10 min. Precipitated solution was centrifuged at 11,000 × g for 30 min and the supernatant was collected and 2 mm CaCl2 added. The supernatant was applied to a phenyl-Sepharose column pre-equilibrated with buffer (50 mm Tris, pH 7.5, 100 mm NaCl, 2 mm CaCl2, 1 mm DTT). The bound protein was washed extensively with wash buffer (50 mm Tris, pH 7.5, 500 mm NaCl, 2 mm CaCl2, 1 mm DTT) and then eluted with elution buffer (50 mm Tris, pH 7.5, 100 mm NaCl, 5 mm EDTA, 1 mm DTT). Eluted protein was concentrated to the desired concentration using a Centriprep-YM10 centrifugal filter (Millipore, Billerica, MA), dialyzed against 50 mm Tris, pH 7.5, 100 mm NaCl, 2 mm CaCl2, 1 mm DTT, and stored in aliquots at −80 °C.
Homology Modeling of the nNOS FMN Domain-CaM Complex
The reported structure of the FMN-CaM complex (Protein Data Bank code 3HR4) corresponds to the iNOS isoform (31), which shares a high sequence homology with the other NOS isoforms. We took advantage of this homology to assess the possible structure of the nNOS FMN domain-CaM complex by homology modeling. The model was built using the Swiss-Model server (35) from the sequence of the wild-type rat nNOS (GenBankTM CAA42574.1) and human calmodulin (GenBank AAD45181.1) and the available iNOS-CaM structure (PDB 3HR4, chains A and B) as template. The coordinates of the FMN molecule (not modeled by the server) were copied from the 3HR4 structure (chain A) and added to the modeled PDB file. The autoinhibitory helix is present in the nNOS sequence but not in iNOS and therefore its structure is highly tentative; it is included in the figure as it gives an idea of the location and size of this element. The CaM structure is unchanged from the original (PDB 3HR4, chain B) as the target and query sequences are identical.
Steady-state Assays
NO synthesis and NADPH oxidation rates were determined using the oxyhemoglobin assay (26). The NO synthesis activity was determined by the conversion of oxyhemoglobin to methemoglobin using an extinction coefficient of 38 mm−1 cm−1 at 401 nm. The NADPH oxidation rates were determined following the absorbance at 340 nm, using an extinction coefficient of 6.2 mm−1 cm−1. Reaction mixtures (total volume 400 μl) contained ≤0.2 μm nNOS, 0.3 mm dithiothreitol, 4 μm FAD, 4 μm FMN, 4 μm H4B, 10 mm l-Arg, 0.1 mg/ml of bovine serum albumin, 0.8 mm CaCl2, 0.2 mm EDTA, 2 μm CaM (WT or mutant depending on the experiment), 100 units/ml of catalase, 60 units/ml of superoxide dismutase, 5 μm oxyhemoglobin, and 150 mm NaCl in 40 mm EPPS buffer, pH 7.6. The reaction was initiated by adding NADPH to a final concentration of 250 μm. In the assays without CaM, CaCl2 was omitted and EDTA concentration was increased to 0.45 mm. Cytochrome c reductase activity was determined as previously reported (26) by following the absorbance change for the reduction of cytochrome c by nNOS at 550 nm using an extinction coefficient of 21 mm−1 cm−1. Reaction mixtures (total volume 400 μl) contained ≤0.01 μm nNOS, 25 μm FAD, 25 μm FMN, 0.1 mg/ml of bovine serum albumin, 1 mm CaCl2, 0.2 mm EDTA, 1.0 μm CaM (WT or mutant depending on the experiment), 100 units/ml of catalase, 40 units/ml of superoxide dismutase, 65 μm cytochrome c, and 150 mm NaCl in 40 mm EPPS buffer, pH 7.6. The reaction was initiated by adding NADPH to a final concentration of 250 μm. In the assays without CaM, neither CaM nor CaCl2 were added and the EDTA concentration was 0.45 mm. All steady-state assays were carried out at 25 °C. Reported values are mean ± S.E. of three or more determinations.
Fluorescence Spectroscopy
Flavin fluorescence measurements were done using a Hitachi model F-2500 spectrofluorometer as described previously (32, 36) with modifications. A 1-ml quartz cuvette with a path length of 1 cm was used for the experiments. Dilution effects were less than 0.5%, and the samples were maintained at 25 °C during measurement. The nNOS wild-type protein was diluted to 2 μm in 40 mm EPPS, pH 7.6, containing 0.6 mm EDTA, 1 mm DTT, and 12 μm CaM. Proteins were irradiated with 457 nm light, and flavin fluorescence emission at 520 nm was monitored versus time before and after consecutive addition of 2 mm Ca2+ and 4 mm EDTA. In some experiments proteins were irradiated with 457 nm light, and their emission spectra were recorded between 460 and 700 nm.
Anaerobic Heme Reduction Measurements
The electron transfer from the reductase domain of FMN to the heme was studied at 10 °C as described previously (26, 37) using a Hi-Tech SF-61 stopped-flow instrument with diode array detector (Hi-Tech Scientific, Salisbury, UK) equipped for anaerobic work. A protein solution containing 10 μm nNOS, 100 mm EPPS, pH 7.6, 100 mm NaCl, 10 μm H4B, 2 mm l-Arg, 0.5 mm DTT, 100 μm CaM (WT or mutant depending on the experiment), 5 mm CaCl2, and 1 mm EDTA, at least half CO saturated, was mixed with an anaerobic, CO-saturated solution containing 100 mm EPPS, pH 7.6, 100 mm NaCl, and 100 μm NADPH. Heme reduction was followed by the formation of the ferrous-CO complex with maximum around 444 nm. The time course of the absorbance changes was fitted to a bi-exponential equation, where the first phase (absorbance decrease) was assigned to the flavin reduction and the subsequent absorbance increase was assigned to heme reduction. Signal-to-noise ratio was improved by averaging data from six or more individual mixing experiments. The extent of heme reduction was measured from the stopped-flow spectral data by calculating the percent of enzyme ferric heme present at the start and end of the reaction, as indicated by the change in heme absorbance at 650 nm (28).
RESULTS
Protein Expression and General Properties
The full-length nNOS R752E, R752Q mutants, and the CaM E47A, E47Q, and E47R mutants were overexpressed in E. coli with yields similar to those obtained for the WT enzymes. The nNOS proteins had normal spectral features (supplemental Fig. S1) indicating normal flavin and heme contents.
Arg752 Interactions and CaM Binding Affinity
The R752E and R752Q nNOS enzymes exhibited normal CaM binding affinity as judged by titrating WT CaM into the NO synthesis assay for each mutant and WT nNOS (apparent Kd values for CaM were below 100 nm; supplemental Table S2). This is consistent with our purifying the nNOS Arg752 mutants using a CaM-agarose affinity column, and with Arg752 not providing significant binding energy for the CaM-NOS interaction (31). The E47A, E47R, and E47Q CaM mutants also displayed normal binding affinity toward nNOS relative to WT CaM (apparent Kd values at or below 100 nm, supplemental Table S2). In our experiments, the concentration of each CaM protein was kept at micromolar levels and in molar excess of nNOS to ensure saturation of the CaM binding site in all cases.
Role for the Arg752-Glu47 Interaction in CaM Control of nNOS Cytochrome c Reductase Activity and Conformational Equilibrium of the Reductase Domain
The steady-state cytochrome c reductase activity is a useful way to measure the electron flux passing through the NOS FMN subdomain. This activity is suppressed in nNOS relative to related dual-flavin enzymes (38), but the suppression is relieved upon CaM binding. Under the experimental conditions, the two-electron reduced FMN subdomain (FMNH2) reacts instantly with cytochrome c once nNOSr achieves an FMN-deshielded conformation (12, 15) (see Fig. 1). The cytochrome c reductase activities of the WT nNOS and R752Q and R752E mutants in response to CaM and to each of the three Glu47 CaM mutants are compared in Fig. 3 and supplemental Table S3. Binding WT CaM to WT nNOS induced a typical 10-fold increase in the cytochrome c activity (9, 24, 26). Substituting nNOS Arg752 with Glu or Gln did not alter the reductase activity of the CaM-free enzyme, but almost completely prevented any increase in reductase activity upon CaM binding. Likewise, the increase in the cytochrome c reductase activity of WT nNOS was abolished when the CaM Glu47 was substituted with Arg, Gln, or Ala. A double mutation designed to reverse the charge pairing involved in the bridging interaction (R752E nNOS + E47R CaM) did not achieve reductase activities that approached WT nNOS with WT CaM (Fig. 3 and supplemental Table S3). This is consistent with the bridging function of Arg752 that is apparent in the crystal structure (Fig. 2). Specifically, the side chain of Arg752 makes H-bonding interactions with both CaM residues (Glu47 and probably Asn42) and three backbone carbonyl groups within the FMN subdomain. A complementary charge reversal could partly maintain the CaM-FMN subdomain interaction, but it would not maintain the backbone H-bonding interactions (supplemental Fig. S2) that are needed to create the bridging interaction.
FIGURE 3.

Rates of steady-state cytochrome c reduction by full-length and truncated nNOS proteins either in the presence of wild-type or mutant CaM proteins or absence of CaM. Reactions were run at 25 °C. Bars indicate the mean ± S.D. (n = 5). Student's t test found that the difference in activities are statistically significant (p < 0.05) as compared with the reductase activity of WT-nNOS with WT-CaM, except for the activity of tr1401 nNOS with WT-CaM.
The CT-deleted nNOS (tr1401) had a 5 times greater reductase activity in the CaM-free state compared with WT nNOS (Fig. 3 and supplemental Table S3). Its activity was not diminished by incorporating the R752E mutation and was diminished only slightly by binding any of the three CaM Glu47 mutants. This indicates that the R752E mutation and CaM Glu47 mutants were not inhibitory in the absence of the CT suppressor element. We conclude that the bridging interaction at Arg752-Glu47 is essential for CaM to relieve the suppression of electron flux through the nNOS reductase domain.
The steady-state cytochrome c reductase activity of nNOS is related to conformational equilibrium A (Fig. 1), and CaM is thought to increase the reductase activity by shifting the equilibrium toward the FMN-deshielded conformation (10, 16). We therefore examined whether the Arg752-Glu47 interaction enables CaM to shift conformational equilibrium A by measuring the change in flavin fluorescence, which increases in proportion to FMN deshielding (12, 16, 32, 36, 39). The nNOS flavin fluorescence was monitored prior to and following its binding of CaM for each of the three Glu47 CaM mutants. Fig. 4 shows that the Glu47 mutants all induced significantly smaller increases in flavin fluorescence compared with WT CaM. This is consistent with their inducing smaller increases in cytochrome c reductase activity (Fig. 3), and suggests the Arg752-Glu47 bridging interaction is required for CaM to shift conformational equilibrium A.
FIGURE 4.

CaM-induced change in flavin fluorescence at 25 °C. CaM binding to wild-type nNOS was induced by adding excess Ca2+ at the times indicated by the arrow. After several minutes CaM was dissociated from the nNOS proteins by adding excess EDTA, as indicated by the arrow. Buffer composition and enzyme concentrations are as described under “Materials and Methods.” The traces shown are representative of at least two separate experiments.
Role for the Arg752-Glu47 Interaction in CaM Control of nNOS Heme Reduction
Heme reduction is required for NO synthesis and is the essential outcome of the FMN-NOSoxy interaction described by equilibrium B (Fig. 1). We examined if the Arg752-Glu47 bridging interaction helps CaM to control the rate and extent of nNOS heme reduction. The data obtained with the various nNOS and CaM proteins is compared in Fig. 5 and listed in supplemental Table S4. All of the substitutions at Arg752 in nNOS or at Glu47 in CaM inhibited the rate and extent of heme reduction. For both the mutations at Arg752 (charge reversal or neutralization) and for the charge reversal at Glu47, the inhibition of heme reduction kinetics was greatest and approached 90%. In comparison, nNOS heme reduction was inhibited to a lesser extent (∼65%) by the charge neutralizing mutations at CaM Glu47. This difference may be related to the neutralizing mutations allowing nNOS to maintain some of the hydrogen bonding interactions that enable the bridging function of Arg752 (supplemental Fig. S2). Complementary charge reversal (R752E/E47R) recovered heme reduction only to a small extent. Together, the results show that the bridging interaction at Arg752-Glu47 is the major means by which CaM triggers heme reduction in nNOS.
FIGURE 5.

Rates of ferric heme reduction by full-length and truncated nNOS proteins in the presence of wild-type or mutant CaM proteins. Reactions were run at 10 °C in a stopped-flow spectrophotometer under anaerobic conditions and in the presence of CO. Bars indicate the mean ± S.D. (n = 7). Student's t test found that the difference in rates are statistically significant (p < 0.05) as compared with the rate of WT-nNOS with WT-CaM, except for the rate of tr1401 nNOS with WT-CaM.
Results from companion experiments run with the CT-truncated nNOS are reported in supplemental Table S4 and illustrated in Fig. 5. All three of the CaM Glu47 mutants supported significantly greater rate and extent of heme reduction in the CT-deleted nNOS. This is demonstrated by a mean heme reduction rate supported by the three CaM mutants in WT nNOS of 1.9 ± 1.1 s−1 (a 73% decrease versus WT CaM) versus 4.3 ± 0.5 s−1 in the CT-deleted nNOS (a 36% decrease versus WT CaM). The various CaM Glu47 mutants also supported a greater extent of heme reduction in the CT-deleted nNOS (supplemental Table S4). In contrast, incorporating the R752E mutation had stronger effects and lowered the rate and extent of heme reduction in the CT-deleted nNOS to levels that were comparable with the analogous full-length nNOS mutant (Fig. 5 and supplemental Table S4). The results with CT-deleted nNOS confirm that the Arg752-Glu47 bridging interaction enables CaM to trigger heme reduction, and also reveals that the CT, when present, can partly inhibit heme reduction in certain cases.
NO Synthesis Activity of nNOS
Because CaM activates NO synthesis we measured the steady-state NO synthesis activities for each combination of our WT and mutant proteins (nNOS and CaM). The activities are reported in supplemental Table S5 and Fig. 6). The coincident rates of NADPH oxidation during the assays are reported in supplemental Table S6. Concurrent NADPH consumption rates were similar to wild-type (supplemental Table S6) indicating that mutations of Arg752-Glu47 interactions do not increase uncoupled NADPH consumption. The mutations caused significant changes in the NO synthesis activity. The mutations at Arg752 were particularly inhibitory and lowered by 75% the NO synthesis activity of the WT full-length and the CT-deleted nNOS. Charge reversal at CaM Glu47 inhibited the WT nNOS activity to a similar extent. In contrast, the charge-neutralized Glu47 mutants of CaM supported a WT nNOS activity almost as high as with WT CaM, and all three CaM Glu47 mutants supported supernormal NO synthesis activities by the CT-deleted nNOS. The basis for this behavior will be discussed below.
FIGURE 6.

Rates of steady-state NO synthesis by full-length and truncated nNOS proteins in the presence of wild-type or mutant CaM proteins. Reactions were run at 25 °C. Bars indicate the mean ± S.D. (n = 5).
DISCUSSION
CaM activation of NOS enzymes is central to their function in biology. Recently, an Arg residue in the FMN subdomain of iNOS was observed to participate in a bridging function that connects (through H-bonding) the FMN subdomain to bound CaM (31). Because few other CaM-NOS interactions were apparent in the crystal structure, the authors suggested that this bridging interaction could help to transduce the effects of bound CaM. Here, we utilized site-directed mutagenesis to test this hypothesis and probed the importance of the analogous Arg752 and Glu47 bridging residues of rat nNOS and rat CaM, respectively. Mutations predicted to fully disrupt the Arg752-Glu47 bridging interaction completely prevented CaM from increasing electron flux through the nNOSr, and significantly diminished CaM activation of heme reduction. These findings reveal that the bridging interaction is the primary way that CaM controls electron transfer and catalysis in nNOS. Thus, the Arg752-Glu47 bridging interaction provides a more precise molecular explanation for previous studies that utilized chimeric forms of CaM and found that its N-terminal domain (which contains Glu47) is important for activating NOS (40–42). The bridging interaction appears to activate nNOS through a bi-modal mechanism, as discussed below.
CaM Influence on nNOS Reductase Activities
We found the Arg752-Glu47 bridging interaction enables CaM to increase electron flux through the nNOSr as measured by an increase in the cytochrome c reductase activity. Previous work showed that the CT plays a predominant role in suppressing the reductase activity of CaM-free nNOS and eNOS (24, 25, 43–46). In the nNOSr structure the CT clasps the FMN subdomain and is thought to stabilize the NOSr in the FMN-shielded conformation (17) (also see Fig. 1). Indeed, deletion of the CT shifts nNOS conformational equilibrium A toward the FMN-deshielded state (from 50% to about 90% FMN-deshielded in the fully reduced nNOS enzyme) and relieves most of the suppression on electron flux through the FMN subdomain (Fig. 3, supplemental Table S3) (24). Because CaM binding causes a similar shift in conformational equilibrium A and a similar increase in the reductase activity of nNOS as does CT deletion (9, 24), CaM is likely to act by diminishing CT suppressor function. Thus, CaM binding to nNOS destabilizes the FMN-shielded form of the reductase domain, which shifts conformational equilibrium A and allows greater electron flux through the FMN subdomain and an increased steady-state reductase activity (10).
How might the Arg752-Glu47 bridging interaction diminish CT suppression of the reductase activity? CaM binds to the H2 hinge of nNOS (Fig. 1), which connects the FMN subdomain to the NOSoxy domain. The various NOS protein crystal structures and models (12, 17, 31) show that the CT and CaM interact with different sites of the FMN subdomain. This implies that the influence of CaM on CT function most probably involves a long-range conformational effect. The interactions that the FMN subdomain makes with the CT (clasp) or CaM (bridging interaction) are likely to be transient and thus could be easily influenced. Our flavin fluorescence data indicate that the Arg752-Glu47 bridging interaction is required for CaM to shift nNOSr to an FMN-deshielded conformation. We speculate that this occurs because the bridging interaction holds the FMN subdomain in a conformation that cannot interact well with the CT. Such conformational stabilization would appear to antagonize or disable CT function, shift equilibrium A, and thus weaken or eliminate suppression of the nNOS reductase activity. It is important to note that the mechanism could also involve participation by other regulatory elements that are present in the nNOS reductase domain (specifically, the AI and the β-finger insertions) (25, 31). Their possible involvement was not tested in our present study. In any case, we can conclude that stabilization of the FMN-deshielded conformation and a resultant lessening of CT suppressor function is one mode by which the Arg752-Glu47 bridging interaction enables CaM to activate nNOS.
CaM Activating nNOS Heme Reduction
Remarkably, the Arg752-Glu47 bridging interaction is also the primary structural feature that enables CaM to trigger heme reduction in nNOS. We saw that the bridging interaction is responsible for up to 90% of the total CaM effect on the rate and extent of heme reduction. The analogous data obtained with the CT-deleted nNOS (Fig. 5) is valuable because it allows us to further dissect what controls heme reduction in nNOS. Specifically, the difference in heme reduction rates observed between nNOS and the CT-deleted nNOS in response to the three CaM Glu47 mutants (Fig. 5) indicate that: (i) approximately half of the heme reduction that is attributed to the bridging interaction is dependent on its disabling CT suppressor function in nNOS (specifically its effect on equilibrium A), and (ii) the remaining half of the heme reduction is due to another distinct effect of the Arg752-Glu47 bridging interaction in nNOS. These two facets represent the two modes of CaM activation.
That the bridging interaction partly activates heme reduction by shifting equilibrium A is unexpected, because previous studies had focused only on how equilibrium A influences nNOS reductase activity (11, 24). Also, deleting the CT does not trigger significant heme reduction in NOS enzymes (24, 25). How might shifting equilibrium A cause faster heme reduction in nNOS? Our related study (11) suggests it could do so by altering the kinetics of the FMN subdomain motion, specifically, the dissociation rate of the reduced FNR-FMN subdomain complex (koff of the FMN subdomain in Fig. 1). The koff we measured at 10 °C for the FMN subdomain of nNOS was 8 s−1 in the CaM-free state, and ≥18 s−1 when CaM was bound (11). This CaM-induced rate increase insures that the koff of the reduced FMN subdomain will not limit the rate of heme reduction in nNOS, which occurred at a maximal rate of 7 s−1 in our current study (Fig. 5 and supplemental Table S4). Thus, CaM stabilizes the FMN-deshielded conformation of nNOSr and causes the koff of the FMN subdomain to increase. However, CaM can no longer do so in the absence of the Arg752-Glu47 bridging interaction. These concepts explain how CaM activates the portion of nNOS heme reduction that is dependent on equilibrium A. When CaM binds to nNOS it forms the Arg742-Glu47 bridging interaction that is required to shift equilibrium A and disable the CT function. This in turn increases the koff of the reduced FMN subdomain. The faster conformational motion of the FMN subdomain insures that it will not limit the rate of electron delivery to the nNOS heme. The same cascade of events cannot occur if CaM binding is not accompanied by the Arg752-Glu47 bridging interaction, because in this circumstance equilibrium A remains unaltered, CT suppressor function is preserved, and nNOS maintains the slower basal koff value for its FMN subdomain, which allows the koff to become partly rate-limiting for nNOS heme reduction. This model explains how one mode of CaM activation (shifting equilibrium A via the Arg752-Glu47 bridging interaction) can help control a key “downstream” step in catalysis (heme reduction) through an effect on the FMN subdomain dissociation rate.
What about the portion of heme reduction that depends on the Arg742-Glu47 bridging interaction but is independent of the effect on equilibrium A? This portion represents the second mode of CaM activation, and likely involves a distinct effect of CaM on the FMN-NOSoxy interaction that is described by equilibrium B (Fig. 1). We know from the crystal structure that the Arg752-Glu47 bridging interaction helps the FMN subdomain and CaM adopt a specific conformation in relation to the H2 hinge (31) (Fig. 2). In nNOS, this could restrain the FMN subdomain from populating many other alternative conformations that it otherwise could achieve when it dissociates from the FNR subdomain in the absence of CaM. Thus, the Arg752-Glu47 bridging interaction should help restrict the degrees of freedom of the FMN subdomain and fix its position relative to the H2 hinge, and these effects may allow a more efficient sampling in unit time of the FMN-NOSoxy conformations that are capable of electron transfer. This could occur without causing a large change in the Keq of equilibrium B, which appears to be the case (12). Previous reports have discussed conformational sampling as it relates to electron transfer in multidomain redox enzymes (47, 48) and in the context of the FMN-NOSoxy domain interaction (12, 31, 39, 49). It is also possible that the Arg752-Glu47 bridging interaction helps eliminate steric barriers in nNOS that might otherwise be present to block the productive FMN-NOSoxy sampling interactions that allow electron transfer, as recently discussed (31). Whether one or both of these mechanisms are involved is a topic for future studies.
Our data indicate that CaM must engage both modes of activation (shift equilibrium A to increase the koff of the FMN subdomain, and increase productive FMN-NOSoxy complex formation) to achieve maximal heme reduction in nNOS. In contrast, only the second mode of CaM activation is required to support heme reduction in the CT-deleted nNOS, because the CT deletion already insures that there is a sufficiently fast koff for the FMN subdomain (and therefore a significant population of the FMN-deshielded conformation) under all circumstances. Thus, the heme reduction rates that we observed in the CT-deleted nNOS provide the best window on how the various mutations at nNOS Arg752 and CaM Glu47 affect the formation of FMN-NOSoxy complexes that are productive for electron transfer. Indeed, because the FMN-to-heme electron transfer in a productive complex is very fast (13, 22) (Fig. 1), the rates of heme reduction that we measured in the CT-deleted nNOS actually reflect the rates of productive complex formation that occur under each circumstance. With this in mind, it is clear from Fig. 5 that the CaM Glu47 mutations that still allow some partial bridging interactions can still support a significant degree of productive FMN-NOSoxy complex formation in nNOS. This contrasts with the uniformly greater inhibition that we observed for the same CaM Glu47 mutants on the nNOS reductase activity in Fig. 3. This implies that the first mode of CaM activation (shifting equilibrium A) is significantly more sensitive to a weakening of the Arg752-Glu47 bridging interaction than is the second mode of CaM activation (formation of productive FMN-NOSoxy complexes). However, if the bridging interaction is completely destroyed as presumably occurs in the nNOS R752E mutation (supplemental Fig. S2), then the effect on both modes of CaM activation become more drastic and highly similar.
CaM Activating NO Synthesis Activity
The changes in NO synthesis activity related to the Arg752-Glu47 bridging interaction did not correlate well with the analogous effects on heme reduction. Although puzzling at first, this discrepancy may be explained by an established global kinetic model for NO synthesis by NOS enzymes (Fig. 7), as previously described in detail (2, 50, 51). The model takes into account that newly generated NO binds to the NOS heme before it leaves the enzyme. This creates an immediate ferric heme-NO product complex that can either release NO or be reduced to a ferrous heme-NO species, depending on the relative rates NO dissociation versus heme reduction (kd and kr‴ in Fig. 7). These two kinetic parameters, along with a third parameter that describes the oxidation rate of the ferrous heme-NO complex (kox in Fig. 7), are intrinsic to all NOS enzymes, and within the context of the global model explains many facets of NOS catalytic behavior (2, 28, 50, 52). In particular, the model predicts that each NOS has an optimal heme reduction rate (kr) with regard to its steady-state NO synthesis activity. We know that the three kinetic parameters of rat nNOS are set such that its peak NO synthesis activity (measured at 25 °C) occurs when the heme reduction rate is about 4 s−1 at 10 °C (2, 37). This relationship can explain the results of our current study. Fig. 8 (panel A) plots the steady-state NO synthesis activities (measured at 25 °C) from supplemental Table S5 against the corresponding heme reduction rates (measured at 10 °C) from supplemental Table S4. In general, the data points distribute according to the relationship that is predicted by a simulation of the global kinetic model using kinetic data (listed in supplemental Table S7) collected at 10 °C (Fig. 8, panel B)5 (2). A similar relationship between the NO synthesis activity of nNOS and heme reduction rate was observed previously (37, 53). Thus, in nNOS the WT CaM supports a rate of heme reduction above the optimal value for steady-state NO synthesis activity, whereas all of the CaM mutants (and the Arg752 mutations in nNOS) lowered the heme reduction rate to suboptimal values. For the CT-deleted nNOS, the WT CaM again supported a rate that was above the optimum. However, the three CaM Glu47 mutants, which are more effective in activating the CT-deleted nNOS as discussed above, supported intermediate rates of heme reduction that appear to be close to the optimal value for steady-state NO synthesis. In these cases, the CT-deleted nNOS is actually releasing more NO in unit time than does WT nNOS despite its having a slower rate of heme reduction. The analysis underscores the inherent complexity in interpreting steady-state NO synthesis activities and illustrates why it is better to compare heme reduction rates when studying factors that may control equilibrium B in nNOS.
FIGURE 7.

Global kinetic model for NOS catalysis. FMN-to-heme electron transfer (kr) is rate-limiting for the NO synthesis reactions. This electron transfer is needed to reduce the ferric heme before each catalytic step (kr, kr″) and also to reduce the H4B radical between cycles (kr′). kcat1 and kcat2 are the conversion rates of the enzyme FeIIO2 species to products in the l-Arg and Nω-hydroxy-l-arginine (NOHA) reactions, respectively. Not all the produced NO is released as the ferric heme-NO product complex (FeIIINO) can either release NO (kd) or become reduced (kr‴) to a ferrous heme-NO complex (FeIINO), which reacts with O2 (kox) to regenerate ferric enzyme through a futile cycle without net NO synthesis. The observed NO synthesis rates are determined by the relative rates of kr, kox, and kd.
FIGURE 8.

Relationship between steady-state NO synthesis activities and ferric heme reduction rates. Panel A, each point indicates the mean value for the measured NO synthesis activity recorded at 25 °C and the heme reduction rate recorded at 10 °C as listed in supplemental Tables S4 and 5. Shaded or marked symbols correspond to the same nNOS form, similarly shaped symbols denote the same CaM form. Panel B, the computer simulated relationship between the heme reduction rate and NO synthesis activity in nNOS at 10 °C, as calculated by simulation of the global kinetic model, using published values (50, 51, 53). Values used for simulation are listed in supplemental Table S7.
Supplementary Material
Acknowledgments
We thank Dr. Jung-Ja Kim for helpful advice and encouragement to perform this study, and Dr. Anthony Persechini for the gift of the rat CaM expression plasmid.
This work was supported, in whole or in part, by National Institutes of Health Grants CA53914, GM51491, and HL76491 (to D. J. S.) and American Heart Association Postdoctoral Fellowship 0625632B (to J. T.).

The on-line version of this article (available at http://www.jbc.org) contains supplemental Tables S1–S7 and Figs. S1–S2.
The basis for the apparent differences in the curve shapes and optimum heme reduction rates in the simulation (Fig. 8, panel B) versus measured values (panel A) is unclear, and may be due to temperature effects, inaccurate measurements, or small deficiencies in the current kinetic model.
- NO
- nitric oxide
- CaM
- calmodulin
- DTT
- dithiothreitol
- EPPS
- 4-(2-hydroxyethyl)-1-piperazinepropanesulfonic acid
- FAD
- flavin adenine dinucleotide
- FMN
- flavin mononucleotide
- H4B
- (6R)-5,6,7,8-tetrahydro-l-biopterin
- NADPH
- nicotinamide adenine dinucleotide phosphate, reduced form
- NOS
- nitric-oxide synthase
- eNOS
- endothelial nitric-oxide synthase
- iNOS
- inducible nitric-oxide synthase
- nNOS
- neuronal nitric-oxide synthase
- NOSr
- reductase domain of NOS
- NOSoxy
- oxygenase domain of NOS
- WT
- wild-type
- CT
- C-terminal tail
- AI
- autoinhibitory insert.
REFERENCES
- 1.Pfeiffer S., Mayer B., Hemmens B. (1999) Angew. Chem. Int. Ed. Engl. 38, 1714–1731 [DOI] [PubMed] [Google Scholar]
- 2.Stuehr D. J., Santolini J., Wang Z. Q., Wei C. C., Adak S. (2004) J. Biol. Chem. 279, 36167–36170 [DOI] [PubMed] [Google Scholar]
- 3.Alderton W. K., Cooper C. E., Knowles R. G. (2001) Biochem. J. 357, 593–615 [DOI] [PMC free article] [PubMed] [Google Scholar]
- 4.Stuehr D. J. (1999) Biochim. Biophys. Acta 1411, 217–230 [DOI] [PubMed] [Google Scholar]
- 5.Gorren A. C., Mayer B. (2007) Biochim. Biophys. Acta 1770, 432–445 [DOI] [PubMed] [Google Scholar]
- 6.Crane B. R., Arvai A. S., Ghosh D. K., Wu C., Getzoff E. D., Stuehr D. J., Tainer J. A. (1998) Science 279, 2121–2126 [DOI] [PubMed] [Google Scholar]
- 7.Fischmann T. O., Hruza A., Niu X. D., Fossetta J. D., Lunn C. A., Dolphin E., Prongay A. J., Reichert P., Lundell D. J., Narula S. K., Weber P. C. (1999) Nat. Struct. Biol. 6, 233–242 [DOI] [PubMed] [Google Scholar]
- 8.Bredt D. S., Hwang P. M., Glatt C. E., Lowenstein C., Reed R. R., Snyder S. H. (1991) Nature 351, 714–718 [DOI] [PubMed] [Google Scholar]
- 9.Abu-Soud H. M., Yoho L. L., Stuehr D. J. (1994) J. Biol. Chem. 269, 32047–32050 [PubMed] [Google Scholar]
- 10.Stuehr D. J., Tejero J., Haque M. M. (2009) FEBS J. 276, 3959–3974 [DOI] [PMC free article] [PubMed] [Google Scholar]
- 11.Ilagan R. P., Tiso M., Konas D. W., Hemann C., Durra D., Hille R., Stuehr D. J. (2008) J. Biol. Chem. 283, 19603–19615 [DOI] [PMC free article] [PubMed] [Google Scholar]
- 12.Ilagan R. P., Tejero J., Aulak K. S., Ray S. S., Hemann C., Wang Z. Q., Gangoda M., Zweier J. L., Stuehr D. J. (2009) Biochemistry 48, 3864–3876 [DOI] [PMC free article] [PubMed] [Google Scholar]
- 13.Feng C., Thomas C., Holliday M. A., Tollin G., Salerno J. C., Ghosh D. K., Enemark J. H. (2006) J. Am. Chem. Soc. 128, 3808–3811 [DOI] [PubMed] [Google Scholar]
- 14.Feng C., Tollin G., Hazzard J. T., Nahm N. J., Guillemette J. G., Salerno J. C., Ghosh D. K. (2007) J. Am. Chem. Soc. 129, 5621–5629 [DOI] [PubMed] [Google Scholar]
- 15.Welland A., Garnaud P. E., Kitamura M., Miles C. S., Daff S. (2008) Biochemistry 47, 9771–9780 [DOI] [PubMed] [Google Scholar]
- 16.Craig D. H., Chapman S. K., Daff S. (2002) J. Biol. Chem. 277, 33987–33994 [DOI] [PubMed] [Google Scholar]
- 17.Garcin E. D., Bruns C. M., Lloyd S. J., Hosfield D. J., Tiso M., Gachhui R., Stuehr D. J., Tainer J. A., Getzoff E. D. (2004) J. Biol. Chem. 279, 37918–37927 [DOI] [PubMed] [Google Scholar]
- 18.Gruez A., Pignol D., Zeghouf M., Covès J., Fontecave M., Ferrer J. L., Fontecilla-Camps J. C. (2000) J. Mol. Biol. 299, 199–212 [DOI] [PubMed] [Google Scholar]
- 19.Hall D. A., Vander Kooi C. W., Stasik C. N., Stevens S. Y., Zuiderweg E. R., Matthews R. G. (2001) Proc. Natl. Acad. Sci. U.S.A. 98, 9521–9526 [DOI] [PMC free article] [PubMed] [Google Scholar]
- 20.Wolthers K. R., Scrutton N. S. (2007) Biochemistry 46, 6696–6709 [DOI] [PubMed] [Google Scholar]
- 21.Spratt D. E., Taiakina V., Palmer M., Guillemette J. G. (2007) Biochemistry 46, 8288–8300 [DOI] [PubMed] [Google Scholar]
- 22.Feng C., Tollin G., Holliday M. A., Thomas C., Salerno J. C., Enemark J. H., Ghosh D. K. (2006) Biochemistry 45, 6354–6362 [DOI] [PubMed] [Google Scholar]
- 23.Feng C., Dupont A. L., Nahm N. J., Spratt D. E., Hazzard J. T., Weinberg J. B., Guillemette J. G., Tollin G., Ghosh D. K. (2009) J. Biol. Inorg. Chem. 14, 133–142 [DOI] [PMC free article] [PubMed] [Google Scholar]
- 24.Tiso M., Tejero J., Panda K., Aulak K. S., Stuehr D. J. (2007) Biochemistry 46, 14418–14428 [DOI] [PubMed] [Google Scholar]
- 25.Roman L. J., Masters B. S. (2006) J. Biol. Chem. 281, 23111–23118 [DOI] [PubMed] [Google Scholar]
- 26.Panda K., Haque M. M., Garcin-Hosfield E. D., Durra D., Getzoff E. D., Stuehr D. J. (2006) J. Biol. Chem. 281, 36819–36827 [DOI] [PubMed] [Google Scholar]
- 27.Guan Z. W., Haque M. M., Wei C. C., Garcin E. D., Getzoff E. D., Stuehr D. J. (2010) J. Biol. Chem. 285, 3064–3075 [DOI] [PMC free article] [PubMed] [Google Scholar]
- 28.Haque M. M., Fadlalla M., Wang Z. Q., Ray S. S., Panda K., Stuehr D. J. (2009) J. Biol. Chem. 284, 19237–19247 [DOI] [PMC free article] [PubMed] [Google Scholar]
- 29.Knudsen G. M., Nishida C. R., Mooney S. D., Ortiz de Montellano P. R. (2003) J. Biol. Chem. 278, 31814–31824 [DOI] [PubMed] [Google Scholar]
- 30.Jones R. J., Smith S. M., Gao Y. T., DeMay B. S., Mann K. J., Salerno K. M., Salerno J. C. (2004) J. Biol. Chem. 279, 36876–36883 [DOI] [PubMed] [Google Scholar]
- 31.Xia C., Misra I., Iyanagi T., Kim J. J. (2009) J. Biol. Chem. 284, 30708–30717 [DOI] [PMC free article] [PubMed] [Google Scholar]
- 32.Adak S., Ghosh S., Abu-Soud H. M., Stuehr D. J. (1999) J. Biol. Chem. 274, 22313–22320 [DOI] [PubMed] [Google Scholar]
- 33.Konas D. W., Zhu K., Sharma M., Aulak K. S., Brudvig G. W., Stuehr D. J. (2004) J. Biol. Chem. 279, 35412–35425 [DOI] [PubMed] [Google Scholar]
- 34.Stuehr D. J., Ikeda-Saito M. (1992) J. Biol. Chem. 267, 20547–20550 [PubMed] [Google Scholar]
- 35.Schwede T., Kopp J., Guex N., Peitsch M. C. (2003) Nucleic Acids Res. 31, 3381–3385 [DOI] [PMC free article] [PubMed] [Google Scholar]
- 36.Gachhui R., Presta A., Bentley D. F., Abu-Soud H. M., McArthur R., Brudvig G., Ghosh D. K., Stuehr D. J. (1996) J. Biol. Chem. 271, 20594–20602 [DOI] [PubMed] [Google Scholar]
- 37.Adak S., Santolini J., Tikunova S., Wang Q., Johnson J. D., Stuehr D. J. (2001) J. Biol. Chem. 276, 1244–1252 [DOI] [PubMed] [Google Scholar]
- 38.Stuehr D. J., Ghosh S. (2000) in Handbook of Experimental Pharmacology (Mayer B. ed) pp. 33–70, Springer-Verlag, Berlin [Google Scholar]
- 39.Dunford A. J., Rigby S. E., Hay S., Munro A. W., Scrutton N. S. (2007) Biochemistry 46, 5018–5029 [DOI] [PubMed] [Google Scholar]
- 40.Gachhui R., Abu-Soud H. M., Ghosha D. K., Presta A., Blazing M. A., Mayer B., George S. E., Stuehr D. J. (1998) J. Biol. Chem. 273, 5451–5454 [DOI] [PubMed] [Google Scholar]
- 41.Newman E., Spratt D. E., Mosher J., Cheyne B., Montgomery H. J., Wilson D. L., Weinberg J. B., Smith S. M., Salerno J. C., Ghosh D. K., Guillemette J. G. (2004) J. Biol. Chem. 279, 33547–33557 [DOI] [PubMed] [Google Scholar]
- 42.Spratt D. E., Newman E., Mosher J., Ghosh D. K., Salerno J. C., Guillemette J. G. (2006) FEBS J. 273, 1759–1771 [DOI] [PubMed] [Google Scholar]
- 43.Roman L. J., Martásek P., Miller R. T., Harris D. E., de La Garza M. A., Shea T. M., Kim J. J., Masters B. S. (2000) J. Biol. Chem. 275, 29225–29232 [DOI] [PubMed] [Google Scholar]
- 44.Roman L. J., Miller R. T., de La Garza M. A., Kim J. J., Siler Masters B. S. (2000) J. Biol. Chem. 275, 21914–21919 [DOI] [PubMed] [Google Scholar]
- 45.Chen P. F., Wu K. K. (2003) J. Biol. Chem. 278, 52392–52400 [DOI] [PubMed] [Google Scholar]
- 46.Lane P., Gross S. S. (2002) J. Biol. Chem. 277, 19087–19094 [DOI] [PubMed] [Google Scholar]
- 47.Leys D., Basran J., Talfournier F., Sutcliffe M. J., Scrutton N. S. (2003) Nat. Struct. Biol. 10, 219–225 [DOI] [PubMed] [Google Scholar]
- 48.Toogood H. S., Leys D., Scrutton N. S. (2007) FEBS J. 274, 5481–5504 [DOI] [PubMed] [Google Scholar]
- 49.Feng C., Tollin G. (2009) Dalton Trans. 6692–6700 [DOI] [PMC free article] [PubMed] [Google Scholar]
- 50.Santolini J., Meade A. L., Stuehr D. J. (2001) J. Biol. Chem. 276, 48887–48898 [DOI] [PubMed] [Google Scholar]
- 51.Santolini J., Adak S., Curran C. M., Stuehr D. J. (2001) J. Biol. Chem. 276, 1233–1243 [DOI] [PubMed] [Google Scholar]
- 52.Salerno J. C., Ghosh D. K. (2009) FEBS J. 276, 6677–6688 [DOI] [PubMed] [Google Scholar]
- 53.Tiso M., Konas D. W., Panda K., Garcin E. D., Sharma M., Getzoff E. D., Stuehr D. J. (2005) J. Biol. Chem. 280, 39208–39219 [DOI] [PubMed] [Google Scholar]
Associated Data
This section collects any data citations, data availability statements, or supplementary materials included in this article.