Abstract
Phenethyl isothiocyanate (PEITC), a constituent of edible cruciferous vegetables such as watercress, not only affords significant protection against chemically induced cancer in experimental rodents but also inhibits growth of human cancer cells by causing apoptotic and autophagic cell death. However, the underlying mechanism of PEITC-induced cell death is not fully understood. Using LNCaP and PC-3 human prostate cancer cells as a model, we demonstrate that the PEITC-induced cell death is initiated by production of reactive oxygen species (ROS) resulting from inhibition of oxidative phosphorylation (OXPHOS). Exposure of LNCaP and PC-3 cells to pharmacologic concentrations of PEITC resulted in ROS production, which correlated with inhibition of complex III activity, suppression of OXPHOS, and ATP depletion. These effects were not observed in a representative normal human prostate epithelial cell line (PrEC). The ROS production by PEITC treatment was not influenced by cyclosporin A. The Rho-0 variants of LNCaP and PC-3 cells were more resistant to PEITC-mediated ROS generation, apoptotic DNA fragmentation, and collapse of mitochondrial membrane potential compared with respective wild-type cells. The PEITC treatment resulted in activation of Bax in wild-type LNCaP and PC-3 cells, but not in their respective Rho-0 variants. Furthermore, RNA interference of Bax and Bak conferred significant protection against PEITC-induced apoptosis. The Rho-0 variants of LNCaP and PC-3 cells also resisted PEITC-mediated autophagy. In conclusion, the present study provides novel insight into the molecular circuitry of PEITC-induced cell death involving ROS production due to inhibition of complex III and OXPHOS.
Keywords: Apoptosis, Cancer, Oxygen/Reactive, Signal Transduction, Autophagy, Chemoprevention, Phenethyl Isothiocyanate
Introduction
Novel strategies for prevention of prostate cancer are highly desirable because of the high mortality associated with this malignancy in American men (1). Epidemiological studies suggest that dietary intake of cruciferous vegetables may offer protection against different malignancies, including prostate cancer (2–4). The anticarcinogenic effect of cruciferous vegetables is attributed to organic isothiocyanates, which are released upon processing (cutting or chewing) of these vegetables (5). Phenethyl isothiocyanate (PEITC)3 is one such compound that has received increasing attention due to its anticancer effects (6–9). For example, PEITC is a potent inhibitor of pulmonary tumorigenesis in rats induced by a tobacco-derived carcinogen (6). Studies from our laboratory have shown that PEITC administration retards growth of PC-3 human prostate cancer cells subcutaneously implanted in male athymic mice without causing any side effects (10).
In addition to prevention of chemically-induced cancer in experimental rodents, PEITC has been shown to reduce viability of cancer cells in culture by causing apoptotic and autophagic cell death (11–19). The mechanism by which PEITC causes cell death is not fully understood, but known cellular responses to this promising cancer chemopreventive agent include G2/M phase cell cycle arrest (14), repression of androgen receptor expression (18), and selective degradation of cellular tubulins (20). Furthermore, PEITC treatment suppresses angiogenesis in vitro and ex vivo by inhibiting Akt (21).
We showed previously that the PEITC-induced apoptosis in PC-3 cells correlates with generation of reactive oxygen species (ROS) (10). However, the mechanism underlying ROS generation remains elusive. Likewise, it is unclear whether normal prostate epithelial cells are susceptible to PEITC-induced oxidative stress. The present study addresses these mechanistically intriguing questions using PC-3 and LNCaP human prostate cancer cells and a representative normal human prostate epithelial cell line (PrEC) as a model.
EXPERIMENTAL PROCEDURES
Reagents
Reagents including PEITC, N-acetyl-l-cysteine (NAC), cyclosporin A (CsA), and antimycin A were purchased from Sigma-Aldrich. Electron paramagnetic resonance (EPR) spin probe 1-hydroxy-3-methoxy-carbonyl-2,2,5,5-tetramethylpyrrolidine (CMH) was obtained from Noxygen Science Transfer and Diagnostics (Elzach, Germany). Reagents for cell culture were purchased from Invitrogen. MitoSOX Red was from Molecular Probes (Eugene, OR) and JC-1 (5,5′,6,6′-tetrachloro-1,1′,3,3′-tetraethylbenzimidazolylcarbocyanine iodide) was from Cell Technology (Mountain View, CA). The 4′,6-diamidino-2-phenylindole (DAPI), oligomycin, carbonyl cyanide 4-trifluoromethoxy-phenylhydrazone (FCCP), 2-deoxyglucose (2-DG), rotenone, unbuffered DMEM, glucose, and phenol red were obtained from Sigma-Aldrich. A kit for quantitation of cytosolic release of histone-associated DNA fragments was obtained from Roche Diagnostics (Mannheim, Germany). Antibodies against catalase, Cu,Zn-superoxide dismutase (SOD), and Mn-SOD were from Calbiochem (now part of EMD Group); anti-cytochrome c and anti-Bax 6A7 antibodies were from BD Pharmingen (Palo Alto, CA); anti-Bak and anti-Bax (polyclonal anti-Bax) antibodies were from Santa Cruz Biotechnology (Santa Cruz, CA); and an antibody against microtubule-associated protein 1 light chain 3 (LC3) was from Cell Signaling Technology (Danvers, MA). The Bax-targeted small interfering RNA (siRNA) was obtained from Cell Signaling Technology, whereas Bak-specific siRNA was procured from Santa Cruz Biotechnology. A nonspecific control siRNA was purchased from Qiagen (Valencia, CA).
Cell Lines and Cell Culture
The PC-3 and LNCaP (ATCC, Manassas, VA) and PrEC (Clonetics, San Diego, CA) cells were maintained as described by us previously (12, 14, 19).
Measurement of ROS Production
Stock solution of PEITC was prepared in dimethyl sulfoxide (Me2SO) and diluted with complete medium immediately before use. An equal volume of Me2SO (final concentration <0.1%) was added to the controls. The ROS generation was assessed by confocal microscopy or flow cytometry after staining with MitoSOX Red and EPR spectroscopy. For confocal microscopy, cells were plated on coverslips, allowed to attach, and treated with Me2SO or PEITC for 4 h. The cells were then exposed to 1.5 μm MitoSOX Red for 15 min and 100 nm MitoTracker Green for 20 min at 37 °C, fixed in 2% paraformaldehyde for 1 h at room temperature and washed, and the coverslips were mounted onto slides. The cells were examined using a Leica TSC spectral laser upright confocal microscope with a 63× oil objective. All the settings were kept identical between different experimental groups. In some experiments, MitoSOX Red fluorescence was determined by flow cytometry. Briefly, control and treated cells were rinsed with Hank's balanced salt solution supplemented with magnesium and calcium and treated with 5 μm MitoSOX Red for 30 min at 37 °C. The cells were collected by trypsinization, washed with phosphate-buffered saline (PBS), resuspended in Hank's solution containing 1% bovine serum albumin (BSA), and used for flow cytometric analysis. The EPR was performed using a cell permeable spin probe (CMH) (22) and a Bruker eScan Table-Top EPR spectrometer. The EPR samples (in Krebs HEPES buffer (pH 7.4)) were placed in 50-μl glass capillaries, and scans were obtained at 37 °C (21% O2). The EPR instrument settings were as follows: field sweep, 50G; microwave frequency, 9.78 GHz; microwave power, 20 milliwatt; modulation amplitude, 2G; conversion time, 327 ms; time constant, 655 ms; and receiver gain, 1 × 10⁵. To minimize the deleterious affects of adventitious metals, all buffers were treated with Chelex resin and contained 25 μm defroxamine. Absence of transition metals was confirmed by the inability to detect the ascorbyl radical upon exposure of buffer to 100 μm ascorbic acid. Spectra shown are representative of five additive scans over 2 min from the 8- to 10-min time of incubation in the EPR cavity at 37 °C.
Determination of Apoptosis
Apoptosis was assessed by determination of cytoplasmic histone-associated DNA fragmentation using a kit from Roche Diagnostics and caspase-3 activation using a kit from Cell Signaling Technology as instructed by the supplier.
Ectopic Expression of SOD
The PC-3 and LNCaP cells were transiently transfected at ∼50% confluency with empty pcDNA3.1 vector or vector encoding for Mn-SOD or Cu,Zn-SOD (generously provided by Dr Larry W. Oberley, University of Iowa). Twenty-four hours after transfection, the cells were treated with Me2SO (control) or PEITC for specified time periods. The cells were collected and used for immunoblotting of SOD, determination of MitoSOX Red fluorescence, and detection of apoptosis. Immunoblotting was performed as described previously (12, 14).
Determination of Mitochondrial Respiratory Chain Enzyme Activities
Complex I, II, and III activities were determined as described previously (23). Cytochrome c oxidase activity was measured according to the method described by Galati et al. (24) with some modifications. Briefly, 20 μg of lysate protein was added to a buffer containing 20 mm potassium phosphate (pH 7.0) and 0.45 mm n-dodecyl-β-d-maltoside. The reaction was initiated by the addition of 15 μm cytochrome c, and decrease in absorbance was measured at 550 nm for 10 min at 30 °C.
Measurements of Oxidative Phosphorylation (OXPHOS) and Glycolysis Rates
Oxygen consumption rate (OCR) and extracellular acidification rate (ECAR) were measured in real-time using a Seahorse Bioscience XF24 extracellular flux analyzer (Billerica) (25). After optimization of cell number, desired cells were seeded in XF 24-well microplates (1 × 10⁴ cells/well for LNCaP and PrEC and 4 × 10⁴ cells/well for PC-3), incubated at 37 °C for 20–24 h, and then exposed to Me2SO (control) or 5 μm PEITC for 6 h. The cells were washed with unbuffered DMEM and incubated for 1 h at 37 °C without CO2 in 750 μl of unbuffered DMEM (pH 7.4) supplemented with GlutaMax-1 (200 mm), glucose (25 mm), sodium chloride (32 mm) and phenol red. The basal oxygen consumption and lactate production were measured. Additional measurements were performed after injection of four compounds that affect mitochondrial bioenergetics, including oligomycin (final concentration 1 μm) at injection A, FCCP (final concentration 300 nm) at injection B, 2-DG (final concentration 100 mm) at injection C, and rotenone (final concentration 1 μm) at injection D. After completion of the experiment, cells were trypsinized and counted for normalization. Results were analyzed using algorithm described by Gerencser et al. (26).
Determination of ATP Levels
ATP measurements were done using the ATPlite kit from Perkin Elmer (Waltham, MA). Briefly cells were grown overnight in 96-well black microplates and treated separately with the indicated test compounds for 45 min. The cells were lysed by adding 50 μl of mammalian cell lysis solution followed by addition of 50 μl of substrate solution. The light produced was measured using a Biotek Synergy 2 plate reader (Winooski, VT) and compared with a series of ATP standards.
Generation of Rho-0 Variants of LNCaP and PC-3 Cells and Determination of Mitochondrial Membrane Potential
Generation and characterization of Rho-0 variants of LNCaP and PC-3 cells have been described by us previously (23). Mitochondrial membrane potential was measured using a potential-sensitive dye JC-1 as described previously (27).
Analysis of Bax Activation
Activation of Bax was studied by immunocytochemistry and determination of conformational change of Bax. Immunocytochemical analysis of Bax in control and PEITC treated wild-type LNCaP and PC-3 cells and their corresponding Rho-0 variants was determined essentially as described previously for LC3 (19). The cells were examined under a Leica fluorescence microscope at ×100 objective magnification. Conformational change of Bax was studied by immunoprecipitation using anti-Bax 6A7 monoclonal antibody followed by immunoblotting using polyclonal anti-Bax antibody (28).
RNA Interference of Bax and Bak
The RNA interference of Bax and Bak was performed essentially as described previously (29).
Detection of Autophagy
Autophagy induction was assessed by (a) immunoblotting for cleavage of LC3; (b) analysis of acidic vesicular organelles; and (c) microscopic analysis of LC3 localization as described previously (19).
Statistical Analysis
Each experiment was performed at least twice in triplicate (except for the EPR experiments, where n = 2). To maximize statistical power while accounting for both between- and within-experiment variation, all statistical comparisons were performed by means of mixed effects ANOVA (30) using SAS (version 9.2) PROC MIXED (SAS Institute, Cary, NC), including fixed effects (μi) for experimental variables (e.g. PEITC versus control), and random effects for experiment (zj) and replicate within experiment (eijk): yijk = μi + zj + eijk, zj ∼ N(0,τ2), eijk ∼ N(0,σ2). The S.E. of the estimated means therefore have contributions from both variance between experiments (τ2) and between replicates within experiments (σ2). The statistical significance of treatment effects was evaluated using linear contrasts of the μi, normalized by appropriate functions of τ2 + σ2. Bonferroni's or Dunnett's adjustments, as appropriate, were applied to p values for between-treatment comparisons following the primary ANOVA significance tests. Statistical significance for OCR and ECAR measurements were performed by one-way ANOVA, and error bars for those experiments represent the ANOVA standard error of the mean.
RESULTS
ROS Production by PEITC Treatment Was Selective for Cancer Cells
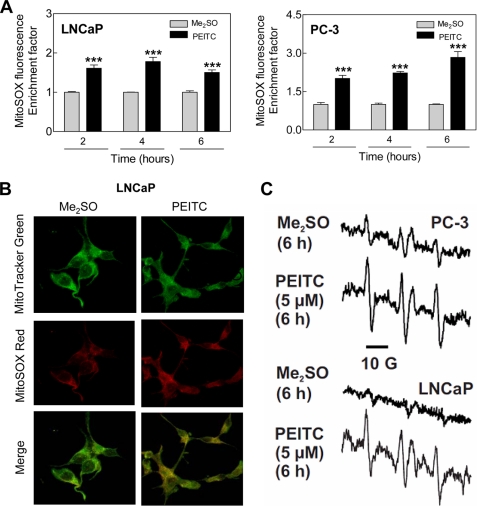
Initially, we used a cell-permeable and mitochondria-targeting chemical probe (MitoSOX Red) to determine ROS production by PEITC treatment in LNCaP and PC-3 cells. Flow cytometry revealed statistically significant enrichment of MitoSOX Red fluorescence over Me2SO-treated control in LNCaP as well as PC-3 cells following treatment with 5 μm PEITC (Fig. 1A). The PEITC-mediated increase in MitoSOX Red fluorescence was evident as early as 2-h post-treatment and persisted for the duration of the experiment in both LNCaP and PC-3 cells (Fig. 1A). Consistent with these results, confocal microscopy showed weak and diffuse red fluorescence in LNCaP cells treated for 4 h with Me2SO (Fig. 1B). The MitoSOX Red fluorescence was markedly increased on a 4-h treatment of LNCaP cells with 2.5 μm PEITC. Furthermore, MitoSOX Red signal co-localized with the MitoTracker Green fluorescence as evidenced by appearance of yellow-orange color, which was very weak in vehicle-treated control cells (Fig. 1B). These results indicated that PEITC treatment caused mitochondrial superoxide generation. The PEITC-mediated increase in MitoSOX Red fluorescence was also observed in the PC-3 cells (supplemental Fig. S1). MitoSOX Red signal was not observed in a normal PrEC treated for 4 h with either 5 μm or 10 μm PEITC (results not shown).
FIGURE 1.
PEITC treatment caused ROS production in LNCaP and PC-3 human prostate cancer cells. A, flow cytometric measurement of MitoSOX Red fluorescence in LNCaP and PC-3 cells treated with Me2SO or 5 μm PEITC for the indicated times. Results shown are mean ± S.E. Total sample size is n = 6 per group. As described under “Statistical Methods,” S.E. bars are estimated from the mixed effects ANOVA. Significantly different (***, p < 0.001) compared with corresponding control by mixed effects ANOVA. B, confocal microscopy for MitoSOX Red and MitoTracker Green fluorescence in LNCaP cells treated with Me2SO or 2.5 μm PEITC for 4 h. C, representative EPR spectra depicting CM· signal in PC-3 and LNCaP cells following 6 h treatment with Me2SO or PEITC. Spectra represent five additive scans during the last 2 min (8–10 min). EPR experiments were repeated twice in duplicate in each cell line, and the results were consistent.
Because of nonspecific reactions inherent to chemical probes (31), we performed EPR using a cell permeable spin probe (CMH) to confirm ROS production by PEITC in our model. This spin probe has been shown to be two to five times more sensitive for detection of superoxide compared with spin traps 5-(ethoxycarbonyl)-5-methyl-1-pyrroline N-oxide and 5-diethoxyphosphoryl-5-methyl-1-pyrroline N-oxide in immortalized lymphocytes stimulated with phorbol 12-myristate 13-acetate (22). Fast reaction of superoxide with CMH produces a stable 3-methoxycarbonyl-proxyl radical (CM·) that can be detected by EPR (22). Fig. 1C depicts typical EPR spectra of CM· in PC-3 and LNCaP cells following a 6-h treatment with Me2SO (control) or 5 μm PEITC. The CM· signal was very weak in Me2SO-treated control PC-3 and LNCaP cells but increased markedly upon treatment with PEITC in both cell lines (Fig. 1C). Collectively, these results indicated that the PEITC-induced ROS production was not a cell-line specific response, but selective for prostate cancer cells.
PEITC-mediated ROS Production and Apoptosis Were Attenuated by Antioxidants
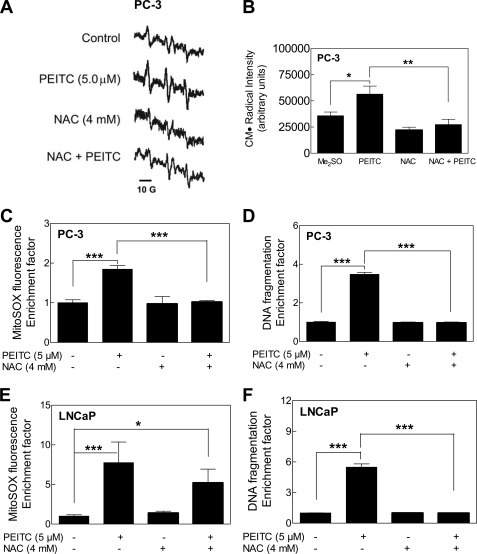
Next, we designed experiments to test the contribution of ROS in PEITC-induced apoptosis. As shown in Fig. 2 (A and B) the PEITC-mediated increase in CM· signal intensity in PC-3 cells was markedly suppressed in the presence of NAC (2 h pretreatment with NAC and then a 6-h treatment with PEITC in the presence of NAC). The NAC also conferred protection against PEITC-mediated increase in MitoSOX Red fluorescence (compare Fig. 2C for PC-3 cells and Fig. 2E for LNCaP cells) as well as cytoplasmic histone-associated apoptotic DNA fragmentation in both PC-3 (Fig. 2D) and LNCaP cells (Fig. 2F).
FIGURE 2.
Effect of NAC on PEITC-mediated ROS generation and apoptosis. A, EPR spectra for CM· in PC-3 cells treated for 6 h with Me2SO or 5 μm PEITC without or with a 2-h pretreatment with 4 mm NAC. (NAC was present during the PEITC treatment.) B, quantification of spectral intensity, peak to trough, of the up-field signal (first peak on the left) of the CM· spectrum. Effect of pretreatment with NAC (2-h pretreatment) on PEITC-mediated MitoSOX Red fluorescence relative to control in PC-3 (C) and LNCaP cells (E), and on cytoplasmic histone-associated DNA fragmentation in PC-3 (D) and LNCaP cells (F). The cells were pretreated with 4 mm NAC for 2 h and then exposed to 5 μm PEITC for 6 h (C and E) or for 24 h (D and F) in the presence of NAC. Results shown are mean ± S.E. Total sample size is n = 4 for data in B and n = 6 for other panels. Significantly different (*, p < 0.05, **, p < 0.01, and ***, p < 0.001) between the indicated groups by mixed effects ANOVA.
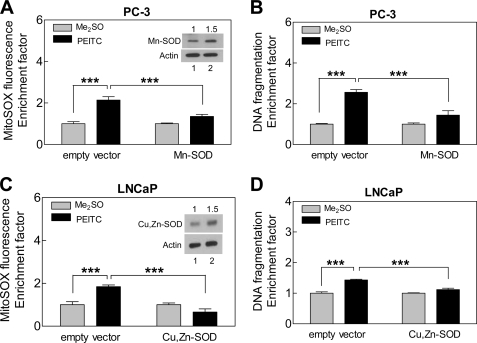
Contribution of ROS in proapoptotic response to PEITC was confirmed by ectopic expression of SOD. Protein level of Mn-SOD was ∼1.5-fold higher in PC-3 cells transiently transfected with Mn-SOD compared with empty vector-transfected control cells (Fig. 3A, inset). Even a modest 1.5-fold overexpression of Mn-SOD conferred statistically significant protection against PEITC-mediated ROS production (Fig. 3A) and cytoplasmic histone-associated DNA fragmentation (Fig. 3B) in PC-3 cells. Because overexpression of Mn-SOD could not be achieved in LNCaP cells, we attempted to transfect these cells with Cu,Zn-SOD. Ectopic expression of Cu,Zn-SOD (∼1.5-fold overexpression compared with empty vector-transfected control cells) in LNCaP cells significantly inhibited PEITC-induced ROS generation (Fig. 3C) and DNA fragmentation (Fig. 3D). Taken together, these results indicated that proapoptotic response to PEITC is intimately linked to ROS production in both PC-3 and LNCaP cells.
FIGURE 3.
SOD overexpression inhibited PEITC-mediated ROS generation and apoptosis. MitoSOX Red fluorescence (A and C) and cytoplasmic histone-associated DNA fragmentation (B and D) in cells transfected with empty vector or vector encoding for Mn-SOD or Cu,Zn-SOD. The cells were treated with Me2SO or 5 micromolar PEITC for 6 h for MitoSOX Red fluorescence assay and for 24 h for DNA fragmentation assay. Insets, immunoblotting for Mn-SOD in PC-3 cells (A) or Cu,Zn-SOD in LNCaP cells (C) in cells transfected with empty vector (lane 1) or vector encoding for the specified SOD (lane 2). Results shown are mean ± S.E. Total sample size is n = 6 per group. S.E. bars are estimated from the mixed effects ANOVA. Significantly different (***, p < 0.001) between the indicated groups by mixed effects ANOVA.
PEITC Treatment Inhibited Complex III Activity in Prostate Cancer Cells
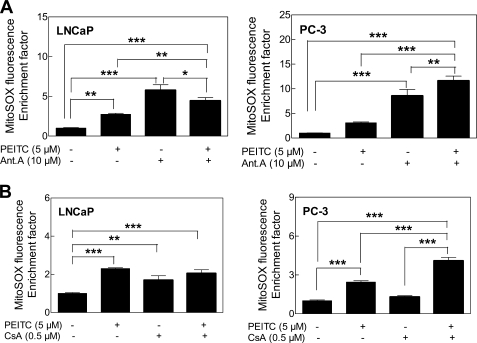
Increased MitoSOX fluorescence resulting from treatment with antimycin A, a known pharmacological inhibitor of complex III, was marginally affected in the presence of PEITC (Fig. 4A). Evidence exists for permeabilization of mitochondrial membrane by a compound with some structural similarity to PEITC, 4,4′-diisothiocyanatostilbene-2,2′-dilsulfonic acid (32). We raised the question of whether ROS production in our model was preceded by opening of the mitochondrial permeability transition pore. We addressed this question using CsA, an inhibitor of mitochondrial permeability transition. Co-treatment with CsA failed to attenuate PEITC-mediated increase in MitoSOX Red fluorescence in either LNCaP or the PC-3 cells (Fig. 4B). The PEITC-mediated increase in MitoSOX Red fluorescence was not attenuated even after a 1-h pretreatment with 1 μm CsA (supplemental Fig. S2) or 10 μm CsA (results not shown). These results led us to conclude that the PEITC-induced ROS generation was not secondary to the mitochondrial permeability transition opening.
FIGURE 4.
Effects of antimycin A (Ant. A) and cyclosporin A (CsA) on PEITC-mediated ROS generation. Effect of 1-h pretreatment with 10 μm antimycin A (A) or co-treatment with CsA (B) and PEITC on MitoSOX Red fluorescence in LNCaP and PC-3 cells. Results shown are mean ± S.E. Total sample size is n = 6–9 per group. As described under “Statistical Methods,” S.E. bars are estimated from the mixed effects ANOVA. Significantly different (*, p < 0.05, **, p < 0.01, and ***, p < 0.001) between the indicated groups by mixed effects ANOVA.
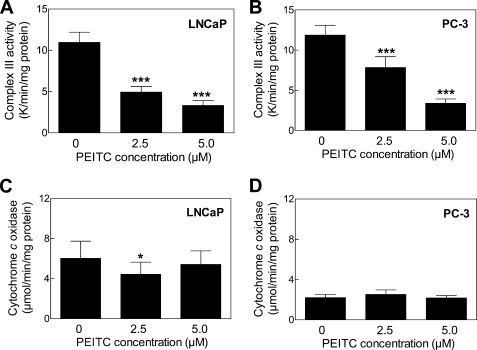
Next, we proceeded to test whether PEITC treatment affected mitochondrial respiratory chain activities. Treatment of LNCaP (Fig. 5A) and PC-3 cells (Fig. 5B) with PEITC resulted in a dose-dependent and statistically significant decrease in the activity of complex III. Inhibition of complex I or complex II activity on treatment with PEITC was not observed in either cell line (results not shown). Because a recent study showed that mitochondria from cells with knockdown of Vb subunit of cytochrome c oxidase, the terminal enzyme of the mitochondrial respiratory chain, were susceptible not only to loss of cytochrome c oxidase activity but also increased ROS production (24), determination of the effect of PEITC on cytochrome c oxidase activity seemed prudent. The PEITC treatment did not alter cytochrome c oxidase activity in LNCaP (Fig. 5C) or PC-3 cells (Fig. 5D) except for a modest decrease at 2.5 μm concentration in LNCaP cells.
FIGURE 5.
PEITC treatment inhibited complex III activity in LNCaP and PC-3 cells. Complex III activity in LNCaP (A) and PC-3 cells (B), and cytochrome c oxidase activity in LNCaP (C) and PC-3 cells (D) following 24 h of treatment with Me2SO or the indicated concentrations of PEITC. Results shown are mean ± S.E. Total sample size is n = 9 per group. As described under “Statistical Methods,” S.E. bars are estimated from the mixed effects ANOVA. Significantly different (*, p < 0.05 and ***, p < 0.001) compared with control by mixed effects ANOVA.
PEITC Treatment Inhibited OXPHOS in Prostate Cancer Cells
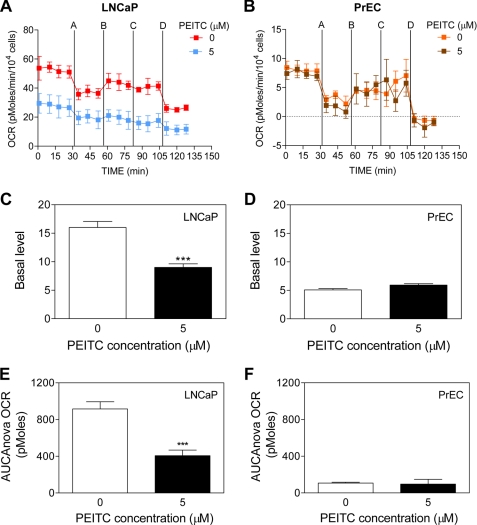
We proceeded to determine the effect of PEITC treatment on mitochondrial bioenergetics (oxygen consumption and extracellular acidification) using LNCaP, PC-3, and PrEC cells. Prior to examining the effect of PEITC treatment on mitochondrial function, we measured the basal OCR, a measure of OXPHOS. The LNCaP cell line exhibited a considerably higher basal oxygen consumption rate compared with PrEC (Fig. 6, A and B) or PC-3 cells (supplemental Fig. S3, A and C). To examine both the spare and total reserve capacity for OXPHOS, LNCaP and PrEC cells were sequentially exposed to four metabolic inhibitors: oligomycin, FCCP, 2-DG, and rotenone. Addition of oligomycin, which is an inhibitor of F1F0-ATPase complex V, blocked ATP synthesis and caused an inhibition of electron flow. As a consequence, oligomycin addition decreased the OCR in both normal and cancerous prostate cells. FCCP injection uncouples mitochondrial respiration from ATP synthesis, giving a measure of spare respiratory capacity in both cell lines. After injection of 2-DG, a glucose analog that inhibits hexokinase, cells showed an increase in OCR as a result of an activation of the reserve respiratory capacity (33, 34). Finally, addition of the complex I inhibitor rotenone led to a block in electron flow through the mitochondrial respiratory complexes and a dramatic decrease in oxygen consumption, as evidenced by the drop in the OCR observed in both LNCaP and PrEC cells (Fig. 6, A and B). Despite the lower OCR in PrEC cells, both cell lines had a similar response to the metabolic inhibitors, in the absence of PEITC (Fig. 6, A and B). The PEITC showed remarkable differential effects on the two cell lines. The LNCaP cells exposed to PEITC (6-h treatment) revealed a significant decrease in OCR (Fig. 6C), in contrast to the PrEC cells in which PEITC treatment had no effect (Fig. 6D). After 6 h of treatment with 5 μm PEITC, the rate of basal oxygen consumption (basal OCR minus oligomycin-sensitive OCR) in LNCaP cells decreased 1.8-fold compared with control cells (Fig. 6C). We also estimated changes in the reserve respiratory capacity of LNCaP and PrEC cells in response to PEITC treatment. Area under the curve was used as a measure of total reserve capacity at the time point 7, just prior to FCCP injection, through the time point 13 immediately preceding the rotenone injection. The PEITC treatment caused a 2.3-fold reduction in the reserve respiratory capacity in LNCaP (Fig. 6E), and no significant change in PrEC cells (Fig. 6F). The PEITC treatment (5 μm, 6 h) also resulted in a 1.4-fold reduction of basal OCR in PC-3 cells, but a modest increase in reserve OCR capacity (supplemental Fig. S3, A, C, and E). These results indicated that PEITC treatment significantly impacted LNCaP and PC-3 cells by decreasing their basal OCR and/or reserve respiratory capacity, whereas PEITC exhibited little effect on the respiration of the PrEC cells.
FIGURE 6.
PEITC treatment inhibited OXPHOS in LNCaP cells. Pharmacologic profiling of OCR, indicative of OXPHOS in LNCaP (A) and PrEC cells (B) treated for 6 h with Me2SO or 5 μm PEITC through real-time measurements using the Seahorse Bioscience XF24 extracellular flux analyzer. After measurement of basal oxygen consumption (C and D), the cells were treated with a series of metabolic inhibitors, including oligomycin (injection A); FCCP (injection B); 2-DG (injection C); and rotenone (injection D) at the indicated times. Basal oxygen consumption was calculated using the difference between the mean of time points prior to injection A (squares 1–4) and prior to injection B (squares 5 to 7; oligomycin-sensitive) (X̄1–4 − X̄5–7). Reserve respiration capacity area under the curve (AUC) for LNCaP (E) and PrEC cell lines (F) calculated using the time point (square 7) prior to injection B through the time point (square 13) just prior to injection D. Results are expressed as mean ± S.E. of five and four biological experiments performed in triplicate for LNCaP and PrEC, respectively. Significantly different (***, p < 0.001) compared with control by one-way ANOVA followed by Dunnett's test.
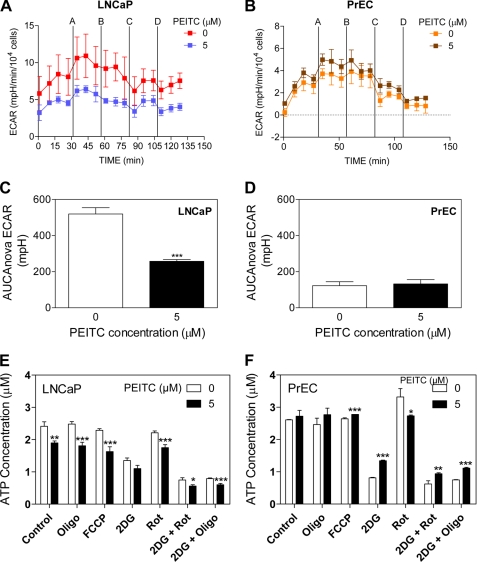
The ECAR, which is indicative of lactate production and consequently glycolysis, was measured simultaneously with OCR. It is important to consider and analyze both rates to fully appreciate the effect of PEITC on cellular bioenergetics. A real-time analysis of ECAR in LNCaP and PrEC cells are shown in Fig. 7, A and B, respectively. The ECAR profile showed a higher level (4.2-fold) of lactate production in LNCaP cells (Fig. 7A) compared with PrEC cells (Fig. 7B). Total glycolysis after inhibition of OXPHOS was calculated using area under the curve between the time points, just prior to the injection of oligomycin (time point 4), until the second to last point (time point 15). The LNCaP cells treated with 5 μm PEITC demonstrated a decline in the glycolytic activity by ∼2-fold compared with control (Fig. 7C). The PEITC treatment did not affect ECAR in PrEC cells (Fig. 7D). We also determined the effect of PEITC treatment (5 μm, 6 h) on ECAR in PC-3 cells (supplemental Fig. S3, B and D), which was unaffected by PEITC treatment.
FIGURE 7.
PEITC treatment decreased glycolysis and ATP levels in LNCaP cells. Pharmacologic profiling of ECAR in LNCaP (A) and PrEC cells (B) through real-time measurements using a Seahorse Bioscience XF24 extracellular flux analyzer following 6 h of treatment with Me2SO or 5 μm PEITC. After measurement of basal lactate production, the cells were treated with metabolic inhibitors as described in the legend to Fig. 6. Area under the curve (AUC) for total glycolysis activity in LNCaP cells (C) and PrEC cells (D) after inhibition of oxidative phosphorylation calculated using the time point just prior to injection A (square 4) until the second to last point (square 15). Results are expressed as mean ± S.E. of five and four biological experiments performed in triplicate for LNCaP and PrEC, respectively. Steady-state levels of ATP in LNCaP (E) and PrEC cells (F) treated with Me2SO or PEITC in the absence or presence of the metabolic inhibitors. Results shown are mean ± S.E. of four or two biological repeats performed in quadruplicate for LNCaP and PrEC cells, respectively. Significantly different (*, p < 0.05, **, p < 0.01, and ***, p < 0.001) compared with control by one-way ANOVA followed by Dunnett's test. Oligo, oligomycin; Rot, rotenone.
PEITC Treatment Lowered ATP Levels in LNCaP Cells
Because PEITC lowered both OXPHOS and glycolysis in LNCaP cells, this decrease in bioenergetics should result in a decrease in the steady state levels of ATP. To this end, the PEITC-treated LNCaP cells exhibited a 1.3-fold decrease in ATP concentration (Fig. 7E). This was not evident in PC-3 cells (supplemental Fig. S3F). Interestingly, whereas PrEC cells show a lower rate of OCR and ECAR than LNCaP cells, the ATP levels were similar on per cell basis (Fig. 7, E and F). However, PEITC treatment caused a slight but insignificant increase in steady-state levels of ATP in the PrEC cell line (Fig. 7F). Nonetheless, both LNCaP and PrEC cells showed flexibility in switching from OXPHOS to glycolysis in the production of ATP. Taken together, these data indicated that LNCaP cells have increased energy demands as compared with the normal cell counterpart PrEC. We also can conclude that the increase in dependence on ATP production supported by both OXPHOS and glycolysis in LNCaP cells apparently makes these cancer cells much more vulnerable to the inhibitory effects of PEITC compared with PrEC.
Rho-0 Variants of LNCaP and PC-3 Cells Were Resistant to PEITC-induced Apoptosis
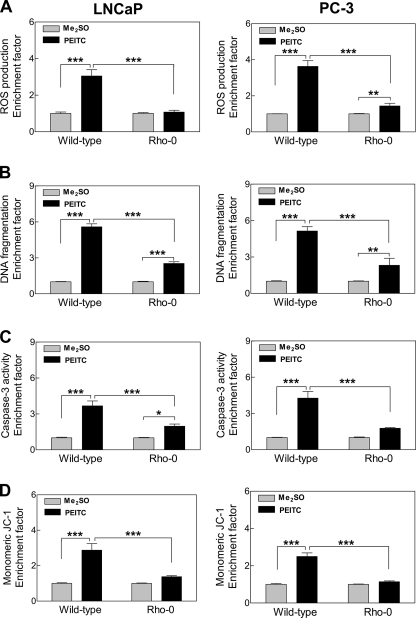
To firmly establish the contribution of mitochondrial ROS in proapoptotic response to PEITC, we generated Rho-0 variants of LNCaP and PC-3 cells. Of the 13 polypeptides encoded by the mitochondrial DNA, many are integral components of the mitochondrial respiratory chain complexes including complexes I and III (35). The Rho-0 cells lack OXPHOS, and their survival is dependent on ATP derived from anaerobic glycolysis, but these cells have functional F1F0-ATPase (36, 37). For example, the F1F0 complex from Rho-0 cells has low ATP synthase activity but robust ATPase activity (38). Finally, it has been shown that Rho-0 cells maintain their mitochondrial membrane potential by running the complex in reverse hydrolyzing ATP from glycolysis to generate the mitochondrial membrane potential (39). Exposure of wild-type LNCaP and PC-3 cells to 5 μm PEITC for 4 h resulted in ROS generation over Me2SO-treated control (Fig. 8A). The ROS production by PEITC treatment was either not observed at all or very low in Rho-0 cells (Fig. 8A). The PEITC treatment (5 μm, 24 h) caused significant increase in cytoplasmic histone-associated DNA fragmentation in the wild-type LNCaP and PC-3 cells compared with corresponding Me2SO-treated controls (Fig. 8B). The PEITC-mediated increase in cytoplasmic histone-associated DNA fragmentation was significantly inhibited in the Rho-0 variants of LNCaP and PC-3 cells (Fig. 8B). Consistent with these results, the Rho-0 variants of both cell lines were significantly more resistant to PEITC-mediated activation of caspase-3 (Fig. 8C), as well as collapse of mitochondrial membrane potential (Fig. 8D) compared with respective wild-type cells. Collectively, these results indicated that ROS acted upstream of disruption of the mitochondrial membrane potential in execution of PEITC-induced apoptosis cascade.
FIGURE 8.
Rho-0 variants of LNCaP and PC-3 cells were resistant to apoptosis induction by PEITC. A, ROS production; B, DNA fragmentation; C, caspase-3 activation; and D, monomeric JC-1 associated green fluorescence (a measure of mitochondrial membrane potential collapse) in wild-type LNCaP and PC-3 cells and their respective Rho-0 variants following a 4-h treatment (A and D) or 24-h treatment (B and C) with Me2SO or 5 μm PEITC. Results shown are mean ± S.E. Total sample size is n = 6 per group. As described under “Statistical Methods,” S.E. bars are estimated from the mixed effects ANOVA (*, p < 0.05, **, p < 0.01, and ***, p < 0.001).
PEITC Treatment Caused Mitochondrial Translocation of Bax
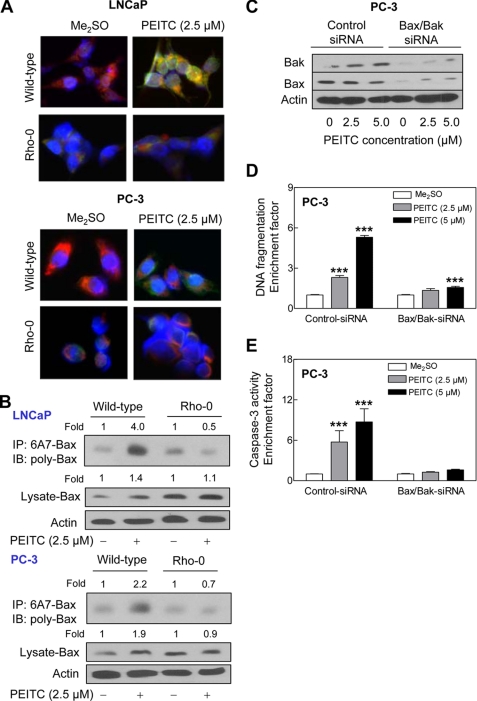
The results presented thus far confirmed a critical role of ROS in initiation of proapoptotic signal transduction by PEITC but did not shed light on mechanisms downstream of ROS production in PEITC-induced cell death. In the normal state, proapoptotic protein Bax resides in the cytosol but translocates to the mitochondria upon apoptotic stimuli including oxidative stress (40, 41). We initially tested the possibility whether PEITC treatment caused mitochondrial translocation of Bax by immunofluorescence microscopy. As shown in Fig. 9A, the Me2SO-treated wild-type LNCaP and PC-3 cells exhibited very weak Bax-associated green fluorescence. Treatment of wild-type LNCaP and PC-3 cells with 2.5 μm PEITC for 8 h resulted in enrichment of the Bax protein in both cytosolic (green fluorescence around DAPI-stained nuclei) and the mitochondrial fraction evidenced by yellow-orange staining due to the merging of Bax-associated green fluorescence and MitoTracker Red-associated red fluorescence (Fig. 9A). The mitochondrial translocation of Bax upon treatment with PEITC was not readily apparent in the Rho-0 variants of LNCaP or PC-3 cells (Fig. 9A). Next, we determined conformational change (activation) of Bax by immunoprecipitation of activated Bax from the lysates of control and PEITC-treated wild-type and Rho-0 LNCaP and PC-3 cells using a monoclonal antibody (anti-Bax 6A7) that recognizes an epitope at the N terminus of the activated Bax followed by immunoblotting using polyclonal anti-Bax antibody. The PEITC treatment (2.5 μm for 8 h) caused conformational change of Bax in wild-type LNCaP and PC-3 cells but not in their Rho-0 variants (Fig. 9B). A modest increase (∼1.4- to 1.9-fold) in level of total Bax protein was also observed in the PEITC-treated cells (Fig. 9B). Moreover, the PEITC treatment caused release of cytochrome c in wild-type cells but not in Rho-0 variants (data not shown). These results indicated that PEITC-mediated ROS production resulted in conformational change and mitochondrial translocation of Bax.
FIGURE 9.
ROS-dependent Bax activation in PEITC-induced apoptosis. A, immunocytochemical staining for Bax (green fluorescence), mitochondria (MitoTracker Red-associated red fluorescence), and nuclei (blue fluorescence) in wild-type and Rho-0 LNCaP and PC-3 cells following an 8-h treatment with Me2SO (control) or 2.5 μm PEITC. B, analysis of conformational change of Bax using lysates from wild-type LNCaP and PC-3 cells and their Rho-0 variants following an 8-h treatment with Me2SO or 2.5 μm PEITC. Active Bax with conformational change was immunoprecipitated (IP) from equal amounts of lysate proteins using anti-Bax 6A7 monoclonal antibody and immunoprecipitates were subjected to immunoblotting (IB) using polyclonal anti-Bax antibody. Immunoblotting for total Bax protein also was performed using cell lysate. Immunoblotting for Bax and Bak (C), cytoplasmic histone-associated DNA fragmentation (D), and caspase-3 activation (E) in PC-3 cells transiently transfected with a control nonspecific siRNA or combined Bax and Bak-targeted siRNA and treated for 24 h with Me2SO or the indicated concentrations of PEITC. Results shown are mean ± S.E. Total sample size is n = 6 per group. As described under “Statistical Methods,” S.E. bars are estimated from the mixed effects ANOVA. Significantly different (***, p < 0.001) compared with corresponding Me2SO-treated control by mixed effects ANOVA.
We utilized siRNA to further probe into the role of Bax and Bak (Bak protein resides in the mitochondria) in regulation of PEITC-induced apoptosis using PC-3 cell line. As shown in Fig. 9C, the levels of Bax and Bak proteins were reduced by >80% in PC-3 cells transfected with Bax and Bak-targeted siRNA (Fig. 9C). The PEITC treatment (24 h) caused a dose-dependent and statistically significant increase in DNA fragmentation (Fig. 9D) and caspase-3 activation (Fig. 9E) in PC-3 cells transfected with the control nonspecific siRNA. On the other hand, combined knockdown of Bax and Bak proteins conferred significant protection against PEITC-induced apoptosis (Fig. 9, D and E). Collectively, these results pointed toward an important role of Bax and Bak in regulation of PEITC-induced apoptosis.
PEITC-induced Autophagy Was Inhibited in Rho-0 Cells
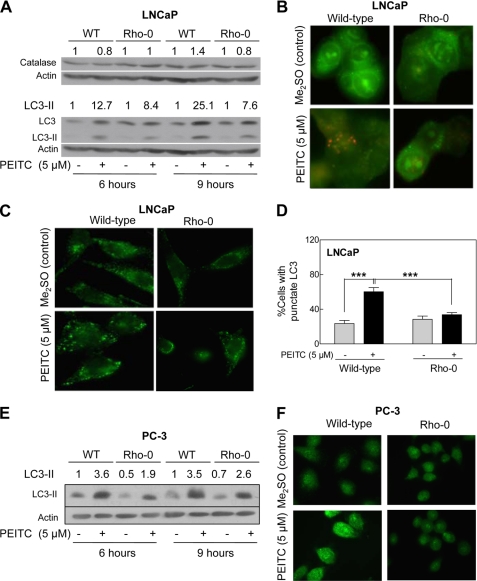
A recent study has implicated ROS production and catalase degradation in induction of autophagy (42). We therefore raised the question of whether autophagic response to PEITC in prostate cancer cells (19) also was linked to the ROS. As shown in Fig. 10A, the PEITC treatment had minimal effect on catalase protein level in wild-type LNCaP cells as well as in its Rho-0 variant. We did not observe degradation of catalase in either Me2SO-treated control LNCaP cells or in the PEITC-treated cells. We determined autophagic response to PEITC by analysis of processing and recruitment of LC3 and formation of acidic vesicular organelles, which are hallmarks of autophagy (43). The LC3 protein (18 kDa) is cleaved by autophagic stimuli to a 16-kDa intermediate (LC3-II) that localizes to the autophagosomes (43). The PEITC treatment resulted in cleavage of LC3 in wild-type LNCaP cells (Fig. 10A). The PEITC-mediated cleavage of LC3 was suppressed partially in the Rho-0 variant of LNCaP (Fig. 10A). In agreement with these results, the PEITC-induced (5 μm, 9 h) formation of acidic vesicular organelles relatively was more pronounced in the wild-type LNCaP cells than in its Rho-0 variant (Fig. 10B). Recruitment of LC3-II to the autophagosomes is characterized by punctate pattern of its localization. The Me2SO-treated (9-h treatment) wild-type LNCaP cells exhibited diffuse and weak LC3-associated green fluorescence (Fig. 10C). On the other hand, the wild-type LNCaP cells treated for 9 h with 5 μm PEITC exhibited punctate pattern of LC3 immunostaining (Fig. 10C). The PEITC-induced recruitment of LC3 to autophagosomes was significantly inhibited in Rho-0 LNCaP cells (Fig. 10D). Experiments in PC-3 cells also indicated that the PEITC-mediated autophagic response was partially suppressed in Rho-0 cells compared with wild-type counterpart (Fig. 10, E and F). These results indicated that the PEITC-induced autophagy was partially dependent on ROS generation.
FIGURE 10.
Role of ROS in PEITC-induced autophagy. A, immunoblotting for catalase and LC3 using lysates from wild-type LNCaP cells and its Rho-0 variant following a 6- or 9-h treatment with Me2SO or 5 μm PEITC. B, analysis of acidic vesicular organelles (yellow-orange) in wild-type LNCaP cells and its Rho-0 variant following a 9-h treatment with Me2SO or 5 μm PEITC (×100 objective magnification). C, immunofluorescence microscopic analysis for punctate pattern of LC3 localization in wild-type LNCaP cells and its Rho-0 variant following 9 h of treatment with Me2SO or 5 μm PEITC (×100 objective magnification). D, percentage of cells with punctate pattern of LC3 localization in wild-type LNCaP and its Rho-0 variant following a 9-h treatment with Me2SO or 5 μm PEITC. Results shown are mean ± S.E. Total sample size is n = 4–5 per group. S.E. bars are estimated from the mixed effects ANOVA. Significantly different (***, p < 0.001) between the indicated groups by mixed effects ANOVA. E, immunoblotting for cleaved LC3-II using lysates from wild-type (WT) PC-3 cells and its Rho-0 variant following a 6- or 9-h treatment with Me2SO or 5 μm PEITC. F, immunofluorescence microscopic analysis for LC3 localization in wild-type PC-3 cells and its Rho-0 variant following 9 h of treatment with Me2SO or 5 μm PEITC (×100 objective magnification).
DISCUSSION
Previous work pointed toward involvement of ROS in cellular responses to PEITC (10, 44, 45), but the mechanism underlying ROS production was unclear. The present study indicates that ROS generation by PEITC in human prostate cancer cells is mitochondria-derived. This conclusion is supported by the following experimental data: (a) the PEITC treatment causes dose-dependent and significant inhibition of complex III activity in LNCaP and PC-3 cells; (b) the PEITC-treated LNCaP and PC-3 cells exhibit a decrease in basal OXPHOS; (c) PEITC-treatment also lowered glycolysis in LNCaP cells; (d) this PEITC-mediated decrease in OXPHOS and glycolysis in LNCaP cells caused a decrease in steady-state levels of ATP; and (e) the Rho-0 variants of both LNCaP and PC-3 cells significantly are more resistant to ROS generation and apoptosis induction by PEITC compared with their respective wild-type counterparts. Even though further studies are needed to determine the precise mechanism by which PEITC inhibits complex III activity, it is possible that PEITC being an electrophilic molecule covalently modifies critical sulfhydryl groups on subunit(s) of complex III. In this regard, direct covalent modification of cellular proteins has been suggested to be an important early event in the induction of apoptosis by PEITC (20).
Because ROS production is linked to the pathogenesis of many chronic diseases including cancer, the potential adverse effects of PEITC-mediated ROS production cannot be ignored. However, the results of the present study and previous observations by us and others support the view that ROS generation by PEITC is harmful only to the cancer cells. First, PEITC is abundant in cruciferous vegetables (e.g. watercress) consumed by humans on a daily basis, yet epidemiological data indicate an inverse association between dietary intake of cruciferous vegetables and the risk of prostate cancer (3). Second, PEITC administration is well tolerated by experimental animals (5, 10, 19). Third, the PEITC-mediated ROS generation, inhibition of OXPHOS, and depletion of ATP are selective for prostate cancer cells because these effects are not observed in a representative normal prostate epithelial cell line (present study).
Another critical goal of the present study was to gain insight into the signal transduction downstream of ROS generation in execution of PEITC-mediated cell death. ROS have been shown to function upstream of cytochrome c release and caspase activation by certain apoptotic stimuli such as hyperoxia (41). At the same time, generation of ROS downstream of the release of cytochrome c has also been described in some cellular models of mitochondria-mediated apoptosis (46). In our model, the ROS function upstream of mitochondrial changes in cell death cascade. The PEITC-mediated cytosolic release of cytochrome c is observed in wild-type prostate cancer cells but not in their Rho-0 variants (results not shown). The Rho-0 variants of LNCaP and PC-3 cells also are resistant to the PEITC-mediated activation of caspase-3. In addition, the PEITC-mediated collapse of mitochondrial membrane potential is quite obvious in wild-type LNCaP and PC-3 cells but not in their Rho-0 variants. The present study also demonstrates that PEITC treatment causes ROS-dependent activation and mitochondrial translocation of Bax. The PEITC-mediated activation and mitochondrial translocation of Bax are observed in wild-type LNCaP and PC-3 cells but not in their Rho-0 variants.
Previous studies have shown involvement of ROS in autophagic response to some stimuli including chemical inhibitors of mitochondrial respiratory chain and caspase inhibitor zVAD (42, 47). For example, autophagic cell death resulting from treatment of murine L929 cell line with caspase inhibitor zVAD was shown to be associated with ROS generation and degradation of catalase (42). Interestingly, the ROS generation and catalase degradation occurred downstream of zVAD-mediated autophagy in L929 cells (42). In our system, the PEITC-mediated autophagy is partially dependent upon ROS production, but independent of catalase degradation. The following observations provide support to this conclusion: (a) the PEITC-mediated cleavage and recruitment to autophagosomes of LC3 is much more pronounced in wild-type cells than in the Rho-0 variants (present study); (b) the Rho-0 variant also is significantly more resistant to PEITC-mediated formation of acidic vesicular organelles compared with wild-type cells (present study); and (c) the PEITC-mediated autophagy is not observed in the PrEC cell line (19), which also is resistant to ROS production by PEITC. It is likely that the PEITC-mediated autophagy represents a clearing mechanism for ROS producing mitochondria.
Among various sites of mitochondrial ROS production, complex I (site IQ) and complex III (site IIIQo) have the greatest capacities to produce ROS (48). Whereas complex I produces superoxide in the mitochondrial matrix, ROS production by the complex III is now believed to be directed toward both matrix and intermembrane space at about equal rates under de-energized conditions (48). Because PEITC treatment inhibits complex III activity, it is logical to speculate that ROS may be directed toward both matrix and intermembrane in our model. Further studies are needed to determine exact topology of the PEITC-mediated ROS production.
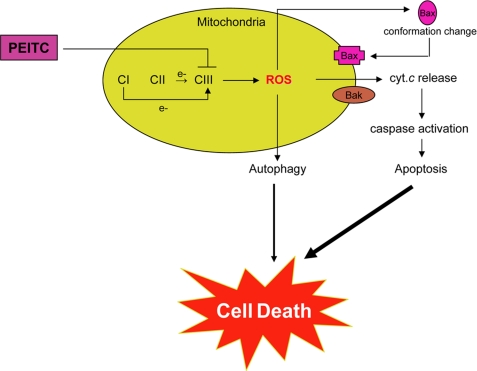
In conclusion, the present study advances a mechanistic model, schematically presented in Fig. 11, explaining the molecular circuitry of selective demise of prostate cancer cells by PEITC treatment. Translational implication of these findings is that cancer chemopreventive efficacy of PEITC may be compromised in the presence of antioxidants.
FIGURE 11.
Schematic presentation of a mechanistic model explaining PEITC-induced cell death in human prostate cancer cells, involving inhibition of complex III activity leading to ROS production, Bax activation, collapse of mitochondrial membrane potential, caspase-3 activation and eventual cell death. The PEITC-induced autophagic death is also partly dependent on ROS production, but the precise mechanism by which ROS regulate autophagy induction remains to be elucidated. CI, complex I; cyt. c, cytochrome c.
Supplementary Material
This work was supported in part by National Institutes of Health, USPHS Grants CA101753, CA115498, and CA129347 awarded by the National Cancer Institute.

The on-line version of this article (available at http://www.jbc.org) contains supplemental Figs. S1–S3.
- PEITC
- phenethyl isothiocyanate
- ROS
- reactive oxygen species
- NAC
- N-acetyl-L-cysteine
- CsA
- cyclosporin A
- CMH
- 1-hydroxy-3-methoxy-carbonyl-2,2,5,5-tetramethylpyrrolidine
- JC-1
- 5,5′,6,6′-tetrachloro-1,1′,3,3′-tetraethylbenzimidazolylcarbocyanine iodide
- FCCP
- carbonyl cyanide 4-trifluoromethoxy-phenylhydrazone
- 2-DG
- 2-deoxyglucose
- SOD
- superoxide dismutase
- Me2SO
- dimethyl sulfoxide
- LC3
- microtubule-associated protein 1 light chain 3
- OXPHOS
- oxidative phosphorylation
- OCR
- oxygen consumption rate
- ECAR
- extracellular acidification rate
- ANOVA
- analysis of variance.
REFERENCES
- 1.Jemal A., Siegel R., Ward E., Murray T., Xu J., Thun M. J. (2007) CA Cancer J. Clin. 57, 43–66 [DOI] [PubMed] [Google Scholar]
- 2.Verhoeven D. T., Goldbohm R. A., van Poppel G., Verhagen H., van den Brandt P. A. (1996) Cancer Epidemiol. Biomarkers Prev. 5, 733–748 [PubMed] [Google Scholar]
- 3.Kolonel L. N., Hankin J. H., Whittemore A. S., Wu A. H., Gallagher R. P., Wilkens L. R., John E. M., Howe G. R., Dreon D. M., West D. W., Paffenbarger R. S., Jr. (2000) Cancer Epidemiol. Biomarkers Prev. 9, 795–804 [PubMed] [Google Scholar]
- 4.Ambrosone C. B., McCann S. E., Freudenheim J. L., Marshall J. R., Zhang Y., Shields P. G. (2004) J. Nutr. 134, 1134–1138 [DOI] [PubMed] [Google Scholar]
- 5.Hecht S. S. (2000) Drug Metab. Rev. 32, 395–411 [DOI] [PubMed] [Google Scholar]
- 6.Morse M. A., Wang C. X., Stoner G. D., Mandal S., Conran P. B., Amin S. G., Hecht S. S., Chung F. L. (1989) Cancer Res. 49, 549–553 [PubMed] [Google Scholar]
- 7.Pereira M. A. (1995) Anticancer Res. 15, 1953–1956 [PubMed] [Google Scholar]
- 8.Stoner G. D., Morrissey D. T., Heur Y. H., Daniel E. M., Galati A. J., Wagner S. A. (1991) Cancer Res. 51, 2063–2068 [PubMed] [Google Scholar]
- 9.Yang Y. M., Conaway C. C., Chiao J. W., Wang C. X., Amin S., Whysner J., Dai W., Reinhardt J., Chung F. L. (2002) Cancer Res. 62, 2–7 [PubMed] [Google Scholar]
- 10.Xiao D., Lew K. L., Zeng Y., Xiao H., Marynowski S. W., Dhir R., Singh S. V. (2006) Carcinogenesis 27, 2223–2234 [DOI] [PubMed] [Google Scholar]
- 11.Chen Y. R., Han J., Kori R., Kong A. N., Tan T. H. (2002) J. Biol. Chem. 277, 39334–39342 [DOI] [PubMed] [Google Scholar]
- 12.Xiao D., Singh S. V. (2002) Cancer Res. 62, 3615–3619 [PubMed] [Google Scholar]
- 13.Xu C., Shen G., Yuan X., Kim J. H., Gopalkrishnan A., Keum Y. S., Nair S., Kong A. N. (2006) Carcinogenesis 27, 437–445 [DOI] [PubMed] [Google Scholar]
- 14.Xiao D., Johnson C. S., Trump D. L., Singh S. V. (2004) Mol. Cancer Ther. 3, 567–575 [PubMed] [Google Scholar]
- 15.Xu C., Shen G., Chen C., Gélinas C., Kong A. N. (2005) Oncogene 24, 4486–4495 [DOI] [PubMed] [Google Scholar]
- 16.Xiao D., Zeng Y., Choi S., Lew K. L., Nelson J. B., Singh S. V. (2005) Clin. Cancer Res. 11, 2670–2679 [DOI] [PubMed] [Google Scholar]
- 17.Kim J. H., Xu C., Keum Y. S., Reddy B., Conney A., Kong A. N. (2006) Carcinogenesis 27, 475–482 [DOI] [PubMed] [Google Scholar]
- 18.Wang L. G., Liu X. M., Chiao J. W. (2006) Carcinogenesis 27, 2124–2132 [DOI] [PubMed] [Google Scholar]
- 19.Bommareddy A., Hahm E. R., Xiao D., Powolny A. A., Fisher A. L., Jiang Y., Singh S. V. (2009) Cancer Res. 69, 3704–3712 [DOI] [PMC free article] [PubMed] [Google Scholar]
- 20.Mi L., Gan N., Cheema A., Dakshanamurthy S., Wang X., Yang D. C., Chung F. L. (2009) J. Biol. Chem. 284, 17039–17051 [DOI] [PMC free article] [PubMed] [Google Scholar]
- 21.Xiao D., Singh S. V. (2007) Cancer Res. 67, 2239–2246 [DOI] [PubMed] [Google Scholar]
- 22.Dikalov S. I., Li W., Mehranpour P., Wang S. S., Zafari A. M. (2007) Biochem. Pharmacol. 73, 972–980 [DOI] [PMC free article] [PubMed] [Google Scholar]
- 23.Xiao D., Powolny A. A., Antosiewicz J., Hahm E. R., Bommareddy A., Zeng Y., Desai D., Amin S., Herman-Antosiewicz A., Singh S. V. (2009) Pharm Res. 26, 1729–1738 [DOI] [PMC free article] [PubMed] [Google Scholar]
- 24.Galati D., Srinivasan S., Raza H., Prabu S. K., Hardy M., Chandran K., Lopez M., Kalyanaraman B., Avadhani N. G. (2009) Biochem. J. 420, 439–449 [DOI] [PMC free article] [PubMed] [Google Scholar]
- 25.Wu M., Neilson A., Swift A. L., Moran R., Tamagnine J., Parslow D., Armistead S., Lemire K., Orrell J., Teich J., Chomicz S., Ferrick D. A. (2007) Am. J. Physiol. Cell Physiol. 292, C125–C136 [DOI] [PubMed] [Google Scholar]
- 26.Gerencser A. A., Neilson A., Choi S. W., Edman U., Yadava N., Oh R. J., Ferrick D. A., Nicholls D. G., Brand M. D. (2009) Anal Chem. 81, 6868–6878 [DOI] [PMC free article] [PubMed] [Google Scholar]
- 27.Xiao D., Vogel V., Singh S. V. (2006) Mol. Cancer Ther. 5, 2931–2945 [DOI] [PubMed] [Google Scholar]
- 28.Choi S., Lew K. L., Xiao H., Herman-Antosiewicz A., Xiao D., Brown C. K., Singh S. V. (2007) Carcinogenesis 28, 151–162 [DOI] [PubMed] [Google Scholar]
- 29.Kim Y. A., Xiao D., Xiao H., Powolny A. A., Lew K. L., Reilly M. L., Zeng Y., Wang Z., Singh S. V. (2007) Mol. Cancer Ther. 6, 1599–1609 [DOI] [PMC free article] [PubMed] [Google Scholar]
- 30.Brown H., Prescott R. (1999) Applied Mixed Models in Medicine, pp. 33–42, John Wiley & Sons, New York [Google Scholar]
- 31.Zielonka J., Hardy M., Kalyanaraman B. (2009) Free Rad. Biol. Med. 46, 329–338 [DOI] [PMC free article] [PubMed] [Google Scholar]
- 32.Bernardes C. F., Meyer-Fernandes J. R., Basseres D. S., Castilho R. F., Vercesi A. E. (1994) Biochim. Biophys. Acta 1188, 93–100 [DOI] [PubMed] [Google Scholar]
- 33.Yadava N., Nicholls D. G. (2007) J. Neurosci. 27, 7310–7317 [DOI] [PMC free article] [PubMed] [Google Scholar]
- 34.Nicholls D. G., Johnson-Cadwell L., Vesce S., Jekabsons M., Yadava N. (2007) J. Neurosci. Res. 85, 3206–3212 [DOI] [PubMed] [Google Scholar]
- 35.Anderson S., Bankier A. T., Barrell B. G., de Bruijn M. H., Coulson A. R., Drouin J., Eperon I. C., Nierlich D. P., Roe B. A., Sanger F., Schreier P. H., Smith A. J., Staden R., Young I. G. (1981) Nature 290, 457–465 [DOI] [PubMed] [Google Scholar]
- 36.King M. P., Attardi G. (1989) Science 246, 500–503 [DOI] [PubMed] [Google Scholar]
- 37.Buchet K., Godinot C. (1998) J. Biol. Chem. 273, 22983–22989 [DOI] [PubMed] [Google Scholar]
- 38.García J. J., Ogilvie I., Robinson B. H., Capaldi R. A. (2000) J. Biol. Chem. 275, 11075–11081 [DOI] [PubMed] [Google Scholar]
- 39.Chandel N. S., Schumacker P. T. (1999) FEBS Lett. 454, 173–176 [DOI] [PubMed] [Google Scholar]
- 40.Kim W. H., Park W. B., Gao B., Jung M. H. (2004) Mol. Pharmacol. 66, 1383–1396 [DOI] [PubMed] [Google Scholar]
- 41.Buccellato L. J., Tso M., Akinci O. I., Chandel N. S., Budinger G. R. S. (2004) J. Biol. Chem. 279, 6753–6760 [DOI] [PubMed] [Google Scholar]
- 42.Yu L., Wan F., Dutta S., Welsh S., Liu Z., Freundt E., Baehrecke E. H., Lenardo M. (2006) Proc. Natl. Acad. Sci. U.S.A. 103, 4952–4957 [DOI] [PMC free article] [PubMed] [Google Scholar]
- 43.Kabeya Y., Mizushima N., Ueno T., Yamamoto A., Kirisako T., Noda T., Kominami E., Ohsumi Y., Yoshimori T. (2000) EMBO J. 19, 5720–5728 [DOI] [PMC free article] [PubMed] [Google Scholar]
- 44.Trachootham D., Zhou Y., Zhang H., Demizu Y., Chen Z., Pelicano H., Chiao P. J., Achanta G., Arlinghaus R. B., Liu J., Huang P. (2006) Cancer Cell 10, 241–252 [DOI] [PubMed] [Google Scholar]
- 45.Wu X. J., Hua X. (2007) Cancer Biol. Ther. 6, 646–647 [DOI] [PubMed] [Google Scholar]
- 46.Cai J., Jones D. P. (1998) J. Biol. Chem. 273, 11401–11404 [DOI] [PubMed] [Google Scholar]
- 47.Chen Y., McMillan-Ward E., Kong J., Israels S. J., Gibson S. B. (2007) J. Cell Sci. 120, 4155–4166 [DOI] [PubMed] [Google Scholar]
- 48.Brand M. D. (2010) Exp. Gerontol. 45, 466–472 [DOI] [PMC free article] [PubMed] [Google Scholar]
Associated Data
This section collects any data citations, data availability statements, or supplementary materials included in this article.


