

Abstract
Purpose
To investigate the feasibility of using IDEAL fat-water imaging and the resultant fat fraction metric in detecting brown adipose tissue (BAT) in mice, and in differentiating BAT from white adipose tissue (WAT).
Materials and Methods
Excised WAT and BAT samples and whole-mice carcasses were imaged with a rapid S fat-water IDEAL-SPGR sequence on a 3T scanner using a single-channel wrist coil. An isotropic voxel size of 0.6 mm was used. Excised samples were also scanned with single-voxel proton spectroscopy. Fat fraction images from IDEAL were reconstructed online using research software, and regions of WAT and BAT were quantified.
Results
A broad fat fraction range for BAT was observed (37–70%), in comparison to a tighter and higher WAT range of 90–93%, in both excised tissue samples and in situ. Using the fat fraction metric, the interscapular BAT depot in each carcass could be clearly identified, as well as peri-renal and inguinal depots that exhibited a mixed BAT and WAT phenotype appearance.
Conclusion
Due to BAT’s multi-locular fat distribution and extensive mitochondrial, cytoplasm, and vascular supply, its fat content is significantly less than that of WAT. We have demonstrated that the fat fraction metric from IDEAL-MRI is a sensitive and quantitative approach to non-invasively characterize BAT.
Keywords: Brown adipose tissue, white adipose tissue, fat fraction, IDEAL
INTRODUCTION
Brown adipose tissue (BAT) remains a topic of great interest in human obesity and energetics research (1–3). Whereas white adipose tissue (WAT) is a lipid reservoir and white adipocytes are composed of a single large intracellular lipid droplet, BAT in contrast is involved in energy expenditure and non-shivering-thermogenesis, and is in contrast highly vascularized and metabolically active (1). Furthermore, brown adipocytes are characterized by multiple smaller intracellular lipid droplets and abundance of iron-rich mitochondria (1,4). Currently, BAT measurements in animals require sacrifice and necropsy, or rely on indirect measures of energy expenditure in response to BAT stimulation (5). BAT studies in humans have been limited, partly due to the lack of reliable and non-invasive detection techniques to study small quantities of diffusely distributed BAT depots in vivo (6,7). Incidental findings of BAT with positron emission and computed tomography (PET/CT) have been reported (8–10) in humans. These findings have been validated in prospective cohorts of adult humans, using PET/CT in addition to biochemical and histological assays (11–14). However, PET/CT is expensive and requires radionuclide uptake by metabolically active BAT, as well as ionizing radiation exposure. Consequently, PET/CT is not broadly applicable as a minimal-risk procedure for studying BAT in large subject populations.
Investigators in the past have employed chemical-shift-selective MRI and spectroscopy (MRS) techniques to detect and quantify interscapular BAT in rats (15,16). Lunati, et al. utilized paired 2D single-slice spin echo sequences to selectively acquire images of fat and water protons at 4.7 Tesla. The 180° RF refocusing pulse of the spin echo sequence was manipulated such that it was selectively tuned to either the proton resonant frequencies of fat (primarily -CH2- methyelene protons) or water in order to generate separate images of the two moieties. In order to account for T1 and T2 relaxation bias on the measured fat and water signals, Lunati, et al. acquired multiple series of fat and water images with varying TR and TE values. From the multiple TR and TE images, the true proton density of fat and water were extrapolated via curve-fitting, and subsequently a map of the fat-water proton ratio (fat fraction) was formed. Due to the need for two separate spin echo acquisitions per TR/TE combination, the imaging time spent to acquire a single slice across the interscapular BAT depot was over 20 minutes (16).
Recent advances in rapid chemical-shift MRI have led to the development time-efficient, computationally-robust and accurate fat-water separation techniques. One example is the IDEAL (Iterative Decomposition with Echo Asymmetry and Least squares estimation) algorithm (17,18). A methodological advancement of IDEAL is an improvement in the accuracy of computing the proton density fat fraction. IDEAL utilizes a multi-echo 3D data acquisition strategy to capture fat and water signals, and through iterative post-processing, yields an estimate of the fat fraction by systematically accounting for relaxation effects (19–21), magnetic field non-uniformity, and the fact that the fat spectrum is characterized by multiple proton resonance peaks (22). The resultant fat fraction map can be used to analyze the relative amounts of fat on a voxel-wise basis in local regions of interest. IDEAL (23,24) and similar variants of the technique (25) have been recently used to study hepatic fat fractions. One major benefit of IDEAL is ability to resolve the full fat fraction range of 0 to 100% without ambiguity.
In this work, we utilize 3D IDEAL to identify and differentiate BAT from WAT based on the unique fat fractions of the two tissues. Due to intracellular characteristics that enable BAT’s involvement in thermogenesis, we hypothesize that its fat fractions will be significantly lower than in lipid-rich WAT. We present corroborating results from excised tissues and in situ whole-mice experiments. To our knowledge, this is the first work to demonstrate the feasibility of IDEAL-MRI in characterizing BAT.
METHODS and PROCEDURES
Excised tissues samples of interscapular BAT and gonadal WAT and 28 post-mortem mice carcasses were prepared and imaged between September 2008 and November 2009. All animal research was conducted after approved by the local Institutional Animal Care and Use Committee. This work involved researchers from two institutions. At the Small Animal Phenotyping Laboratory of the University of Alabama at Birmingham, the animals were housed at 22±2°C and were provided ad libitum access to food prior to sacrifice. The carcasses were then immediately shipped by overnight courier service to investigators at the University of Southern California, where MRI experiments were conducted on a 3 Tesla whole-body human MRI scanner (Signa HDx, GE Healthcare, Waukesha, Wisconsin) using a single-element wrist receiver coil (BC-10, Mayo Clinic, Rochester, Minnesota). All samples were imaged within 24 hours after sacrifice. At the time of imaging, post-mortem carcasses ranged in age from 2 to 19 weeks. All samples were set aside to equilibrate to room temperature prior to imaging.
A 3D six-echo IDEAL-T2*-SPGR pulse sequence was used in this work (22). The sequence was an investigational research version of the IDEAL software and was provided by GE Healthcare. Imaging parameters for the excised tissue samples were TR = 10 msec, TE spacing = 0.8 msec, first TE = 1.5–1.8 msec, flip angle = 5°, receiver bandwidth = ±125 kHz, 0.6 mm true (non-zero-interpolated) isotropic spatial resolution, field-of-view (FOV) = 15 cm, fractional phase FOV = 0.75, and an echo train length (ETL - number of echoes per TR) of one. For each TE, the number of signal averages (NSA) was set to six to further enhance image signal-to-noise ratio. All excised tissue samples were imaged together in a Petri dish, using one IDEAL data acquisition and 16 slices. Imaging time for the excised specimens was 12 minutes. For the post-mortem animal carcasses, a 3D imaging volume was prescribed to encompass the entire carcass, requiring 34 to 56 slices. Similar FOV, spatial resolution, and imaging parameters were utilized, with the exception of TR = 20 msec, ETL = 2 with fly-back unipolar readout gradients, and NSA = 3. The wrist coil was large enough to allow four animals to be imaged simultaneously per IDEAL data acquisition. Imaging time for each set of four animals was a little over 20 minutes. The multipeak T2*-IDEAL algorithm (22) was implemented on the scanner console using pre-calibrated amplitude and frequency parameters for the fat spectra (22,26,27). Co-registered water, fat, and noise-bias-corrected fat fraction data sets (20) were generated online.
In addition to IDEAL, single-voxel proton MRS was performed on two excised BAT and WAT samples to clearly demonstrate the differences in fat fraction between the two tissues. Resulting spectra were analyzed with the Java-based MRUI software (28). The areas under the fat and water spectral peaks were computed to generate a similar fat fraction metric. Parameters for MRS were: TR = 1.5 sec, TE = 14 msec, 20×20×20 mm3 voxel, 2048 spectral data points, 2.5 kHz bandwidth, no water suppression, and eight signal averages. The MRS experiment was carried out for proof-of-concept purposes only and thus involved only one TE acquisition. Thus, T2* correction was not performed on the MRS spectra.
For illustration and anatomical reference, cryosection was performed on a separate adult mouse that was not part of the imaged cohort. For cryosection, the carcass was skinned from the base of the skull to the bottom of the rib cage, and fixed in a 10% buffered formalin solution overnight at 4°C. The specimen was washed with formalin and immersed in a 30% sucrose solution (0.1M phosphate buffer, pH ~7.4) at 4°C to cryoprotect the soft tissues. The specimen was subsequently imbedded in Tissue-Tek® OCT (Optimum Cutting Temperature) solution, quickly frozen in liquid nitrogen and stored at −80°C until sectioning. All sections were prepared using a Leica CM1900 Cryostat and photographed with a 7.1 megapixel Canon SD1000 camera.
RESULTS
Figure 1 summarizes IDEAL image results from excised BAT and WAT samples. The photo in Figure 1a shows that the two tissues are visually distinctive in terms of color. The brown-reddish tone of BAT is due to its high vascularity and iron-rich content within the large number of intracellular mitochondria. IDEAL water and fat images are shown in Figures 1b and 1c, respectively. Note that the two BAT samples have markedly lower fat signal intensity (arrows) than lipid-rich WAT, consistent with lower fat content. Conversely, BAT exhibited greater water content in the reconstructed water image. The quantitative difference between BAT and WAT is evident in the fat fraction map. The average (± standard deviation) fat fractions were (left to right): 92%±2% (WAT), 51%±8% (BAT), 93%±2% (WAT), and 62%±7% (BAT). The BAT sample on the left is from 4-week-old juvenile mice; the BAT sample on the right is from 12-week-old adults. Note the uniform appearance of the WAT samples in the fat fraction map, in contrast to the more heterogeneous nature of BAT. The extent of variation in fat fraction for BAT was broader than WAT, possibly due to the fact that the BAT-labeled samples contained admixtures of both tissue types. The lowest fat fraction was coincident with the darkest (most reddish) BAT sample (second from left).
Figure 1.

IDEAL results from excised tissues. (a) Brown and white adipose tissue (BAT, WAT) are visually distinct. (b) Water, (c) fat, and (d) fat fraction map. Reconstructed fat image illustrates lower fat content in BAT (arrows) than WAT. Mean fat fraction for the four samples were (left to right) 92%, 51%, 93%, and 62%. The sample vials were placed in a water-filled Petri dish. Thus, note that water in the dish is correctly reconstructed to the water image. WAT: white adipose tissue; BAT: brown adipose tissue.
Figure 2 illustrates MRS results from two representative BAT and WAT samples. Raw spectra are shown. Note that the WAT sample is predominantly composed of lipids, exhibiting a strong methylene proton peak at 1.3 parts-per-million (ppm). In contrast, the BAT sample also contained a significant water signal at 4.7 ppm. Both spectra exhibit other minor fat resonance peaks (arrows) in addition to the methylene peak. These include methyl (0.9 ppm), olefinic (5.2–5.5 ppm), diallylic (2.8 ppm), and α-carboxyl (2.1–2.2 ppm) groups. The fat fractions of these WAT and BAT samples were approximately 92% and 58%, respectively. To facilitate plotting and visualization, the data have been scaled and normalized. Due to the small size of the excised tissues and their placement in small vials with air present, significant magnetic field inhomogeneity may have been present. This would have led to the broader line widths, which can be seen in the WAT spectrum. Although T2* was not performed, it remains conceptually evident that thes BAT fat fraction is significantly lower than that of WAT.
Figure 2.

Single-voxel proton MRS results of two representative tissue samples. WAT (dashed black) is composed nearly entirely of lipids, with a dominant methylene (-CH2-) located at 1.3 ppm. In contrast, BAT (solid gray) exhibits an appreciable water signal, at approximately 4.7 ppm. Arrows point to the multiple minor fat resonant peaks that are visible on either spectrum, including the methyl group (-CH3) at 0.9 ppm, olefinic group (-HC=HC-) at 5.2–5.5 ppm, diallylic group (=CH-CH2-HC=) at 2.8 ppm, and -CH2-α-to-carboxyl group at 2.1–2.2 ppm. ppm: parts per million; a.u. arbitrary units.
Figure 3a illustrates in situ results from four post-mortem mice specimens. The same fat fraction color map is used from Figure 1. A representative coronal slice highlights the prominent interscapular BAT depot (red contours in fat images). The top two animals were 12-week-old fully-grown adults. The bottom two animals were 4-week-old juveniles. The average interscapular BAT fat fractions of the adults were 64% and 52%, 10–15% greater than that of the juveniles (42% and 39%). In the fat fraction map, note the visually distinctive color representation of BAT (green and yellow shades) versus that of lipid-rich WAT (red) and lean tissue (dark purple). Figure 3b further showcases the peri-renal and inguinal adipose tissue depots from one adult (top) and one juvenile (bottom) mouse surrounding the kidneys. The colorized fat fraction map has been overlaid with the grayscale water image. Note the apparent difference in fat fraction in these depots between the two animals. The depots in the juvenile exhibit a mixed appearance of BAT and WAT phenotypes, whereas that of the adult is nearly entirely composed of WAT.
Figure 3.
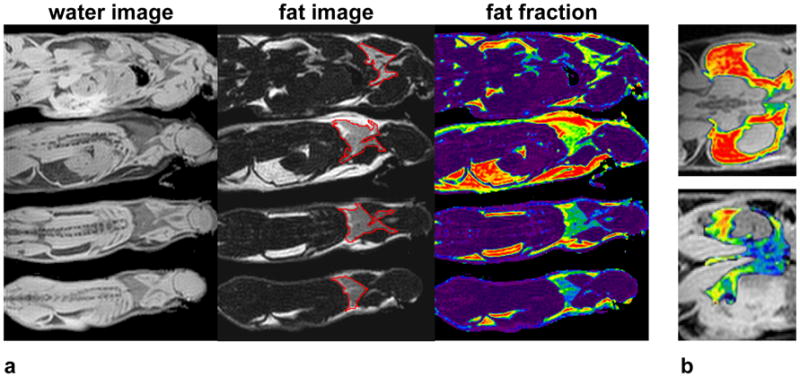
In situ identification of BAT in mice. (a) Reconstructed water and fat images, and fat fraction map, with interscapular BAT depot (red contours in fat image). (b) Fat fraction map overlaid on water image, illustrating the peri-renal and inguinal adipose tissue depot in one adult (top) and one juvenile (bottom) mouse. Significant differences in the fat fraction maps are evident. Note particularly that the juvenile depot contains a mixture of WAT and BAT, whereas the adult depot is almost entirely WAT. The same color map is used from Figure 1.
Axial fat fraction reformats of the dorsal interscapular BAT depot (arrows) are shown in Figure 4a for one adult (top) and on juvenile (bottom) mouse, illustrating the 0.6 mm high-resolution isotropic nature of the 3D data sets. The distinctive trapezoidal, bi-lobed shape of the interscapular BAT depot is fully delineated. In the adult specimen, note the evident layer of WAT above the BAT depot. This WAT layer is less prominent in the juvenile. For anatomical reference, Figure 4b shows an axial slice prepared from cryosection, with arrows identifying the visually distinct interscapular BAT and WAT depots.
Figure 4.
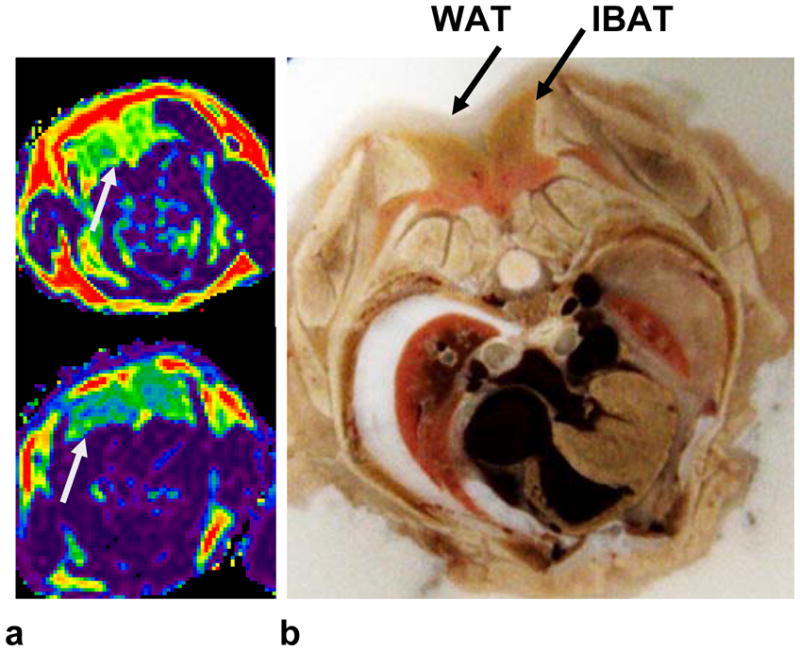
(a) Axial reformats highlighting the interscapular BAT (gray arrows) depot along the dorsal aspects of an adult (top) and an juvenile (bottom) mouse. (b) For anatomical reference, a representative photo from axial cryosection (of a separate animal, same gender, similar age and weight) is shown. The same color map is used from Figure 1.
Figure 5a summarizes the average fat fraction within the interscapular BAT depot as a function of age from the 22 carcasses imaged in this work. There is anecdotal evidence suggesting that the interscapular BAT fat fraction is lower in young mice and increases progressively with age. Figure 5b summarizes the average interscapular BAT fat fraction for 22 of the 28 specimens where age and body weight data were available, showing a similar trend of BAT with higher fat fraction in heavier animals. In contrast, WAT fat fractions in all mice were greater than 90% (data points not shown). Similarly, Figure 6 summarizes the interscapular BAT depot volume computed from 3D IDEAL data sets as a function of age and weight. Note that in each mouse, there is less than 0.5 ml of BAT within the interscapular depot.
Figure 5.

(a) Plot of average interscapular BAT fat fraction versus age in 28 mice, suggesting a moderate trend of leaner (lower fat content) BAT in young mice and fattier BAT in adult mice. (b) Plot of average interscapular BAT fat fraction for 22 mice versus body weight. Gray circles denote animals 2–4 weeks of age. Black circles denote animals 9–12 weeks of age.
Figure 6.

Plot of interscapular BAT depot volume versus (a) age and (b) weight. Both plots show similar positive correlation strength. In (b), gray circles denote animals 2–4 weeks of age. Black circles denote animals 9–12 weeks of age.
DISCUSSION
This work has demonstrated the feasibility of using the 3D IDEAL fat fraction metric as a sensitive index for distinguishing BAT and WAT. Collectively, results from Figures 1–4 corroborate the hypothesis of this work --- BAT fat fraction is lower than WAT fat fraction. Due to its involvement in thermogensis, BAT appears to be uniquely characterized by fat fractions that are distinct from lipid-rich WAT and lean tissues. Additional results from Figure 5a suggested lower BAT fat fractions in young juvenile mice and higher BAT fat fractions in adult mice. We speculate that this is potentially indicative of the juveniles’ higher thermogenic potential and requirement. Due to their greater body surface-to-volume ratio, juveniles likely experience more body heat loss than adults. Consequently, their BAT is regularly engaged in thermogenesis, which requires increased fatty acid metabolism. This heat demand is gradually reduced in larger adult mice due to their smaller surface-to-volume ratio. Consequently, adult mice exhibit fattier BAT, which can differentiate and become more similar in appearance to WAT (1). Results from Figure 5b also suggested lower BAT fat fractions in animals with lower body weights, consistent with the historic notion that active BAT can metabolize excess lipids to produce heat. The heat is then dissipated by the animal into the surroundings. Thus, BAT has been suggested as a mechanism protecting the animal against weight gain and obesity (3,29,30). Results from Figure 6 showed that in our cohort of normal and healthy mice, interscapular BAT depot volume positively correlated with both age and weight. Furthermore, the small size of the interscapular BAT depot emphasizes the tissue’s thermogenic efficiency.
There are several limitations to the 2D spin echo method employed by previously investigators for MRI of BAT (16). First, two separate chemical-shift-selective acquisitions were needed to obtain separate fat-only and water-only images, which is time consuming. Second, the performance of the spin echo approach will be less robust at lower magnetic field strengths. The 180° refocusing pulse employed by Lunati, et al. had a bandwidth of 500 Hz. This bandwidth would be too broad and inadequate for use at 1.5 and 3 Tesla, where methylene fat and hydroxyl water resonances are separated by approximately 210 and 420 Hz, respectively. Consequently, use of a broad pulse would cause signal leakage between fat and water. Another disadvantage of using selective fat saturation methods to quantify fat is its inability to completely saturate the minor fat peaks that exist near the water peak, such as the olefinic groups (31). In contrast, the IDEAL method with multipeak fat spectral modeling is much more time-efficient, and intrinsically decomposes fat and water signals without requiring spectrally-selective pulses.
The most significant advantage of IDEAL is that the algorithm more accurately models the fat spectrum with multiple peaks, in contrast to the chemical-shift-selective spin echo approach which models the fat spectrum with only a single methylene resonance. Previous works have shown that the fatty acid chains of BAT and WAT can be significantly unsaturated with olefinic protons (27,32). With the single-peak model, signals from the olefinic protons are often erroneously assigned to the water component. If unaccounted for, a considerable underestimation of the true fat fraction can occur (22,33). In the current implementation of IDEAL, we utilized a pre-calibrated multi-peak spectral profile based on WAT from human data. While this gave accurate measures of WAT fat fraction, the corresponding estimates of BAT fat fraction could have been improved slightly had we adopted a profile specific to BAT. However, the underlying chemical composition and ratio of saturated and unsaturated triglycerides between BAT and WAT is not believed to be significantly different (27).
The application of MRI to study BAT in humans is under investigation. Reports using PET/CT and histology have confirmed the presence of BAT in adult humans (11–14). With PET/CT, BAT activity was identified by observing false-positive symmetrical uptake of radionuclide fluorodeoxyglucose with cold temperature stimulation. One advantage of using MRI will be its ability to identify BAT based on the tissue’s fat fraction, regardless of its metabolic activity due to environmental conditions. MRI is also safer by not requiring the use and uptake of exogenous radionuclides. Another benefit IDEAL-MRI is its relatively high-spatial-resolution in comparison to other imaging modalities. This allows an investigator to potentially isolate BAT in very small and localized regions. While studies have demonstrated the presence of BAT in humans across several anatomic sites and age ranges (6,34), it has been shown that they may be buried in highly localized and small islets within major WAT depots (4). As demonstrated in Figures 3 and 4, IDEAL fat fraction measures can discriminate and depict heterogeneous adipose tissue mixtures of BAT and WAT in mice.
Although an isotropic resolution of 0.6 mm was used in this work, a fundamental limitation of identifying BAT by fat fraction MRI in very small depots, especially in the presence of WAT, is partial volume effects. In circumstances where fat has infiltrated organs and skeletal muscles such as in hepatic steatosis, the regional fat fraction may be similar to the range occupied by BAT. Furthermore, voxels residing at the interface of WAT and lean tissue will also mimic fat fractions that are similar to that of BAT. To minimize false-identification of BAT, assistance from a priori knowledge of common sites in animals and humans will be critical (5–7). Therefore, for large BAT depots such as the interscapular and peri-renal regions, fat fraction IDEAL-MRI should be sufficient for BAT characterization. However, for smaller depots or mixtures of WAT and BAT that is predominantly WAT, other MRI methods that provide either greater spatial resolution or an alternative contrast mechanism between BAT and WAT need to be pursued. Nonetheless, further validation of quantifying BAT in mass or volume units should is needed against gold-standard references such as histological staining, necropsy, and chemical assay.
Another limitation of this work was the imaging of carcass versus live animals. The current study involved two groups of investigators at two different research institutions. One group has expertise in small animal work, while the other has expertise in MRI. Investigators who performed the MRI experiments did not have access to laboratory facility at their institution for the handling of live animals, and also did not have sedation equipment for live animal MRI. Investigators at both institutions are currently pursuing live animal BAT MRI protocols. The implications of imaging carcasses versus live specimens include differences in body temperature, respiratory and cardiac motion, and the presence of vascular flow. With respect to temperature, the chemical shift between water and fat may change, thereby impacting the resultant fat fraction measurement. With our investigational IDEAL software, we did perform several separate IDEAL reconstructions where the chemical shift between water and fat was varied between −400 and −450 Hz in 10 Hz increments, based on spectral measurements from pre-scan calibration. In the tested carcass data sets, we observed less than 2% change in the resulting BAT fat fraction as a result of the chemical shift variation. Additionally, the WAT fat fraction remained greater than 90%, and the quality of the separate fat and water images were not significantly different.
In addition to fat-water imaging, other sensitive MRI methods can be useful in studying BAT. Since BAT is highly vascularized due to the need to efficiently transport the generated heat throughout an animal’s body, techniques that measure blood flow can be developed to exploit the differences in local blood tissue perfusion rates between BAT and WAT (35). Again, the use of post-mortem carcasses is in fact a limitation of the present work. It is also plausible that the absence of blood flow in carcasses could have altered the apparent fat fraction of BAT in comparison to in vivo conditions (16). With blood flow, the fat fraction of BAT is expected to be lower. Yet another contrast mechanism that can potentially be exploited to differentiate WAT and BAT is T2* weighted imaging. It is speculated that BAT T2* will be lower than that of WAT, due to the presence of iron in the mitochondria of BAT and other cellular differences. In the current work, we additionally measured T2* values in BAT and surrounding WAT from the carcasses, using T2* maps that were generated from the six-echo IDEAL algorithm. For WAT, a smaller range of 9 to 20 msec T2* values was measured. However, for interscapular BAT, we did not observe lower T2* values, but instead a range between 11 and 50 msec. Interestingly, when compared against corresponding fat fractions of BAT, a modest positive correlation between T2* and fat fraction was obtained (r = 0.6). This appears consistent with the notion that as BAT becomes more active in lipid metabolism (lower fat fraction), increased local blood flow and intracellular iron and mitochondria contents would lead to shortened T2* values. The feasibility of T2* imaging of BAT and WAT should be further explored, particularly in live animal experiments.
In conclusion, the present work has demonstrated the feasibility of identifying brown adipose tissue using rapid IDEAL-MRI. It provides a framework for using MRI to non-invasively characterize BAT in vivo. The fat fraction index could potentially enable accurate quantification of BAT volumes in vivo, as well as the monitoring of cellular differentiation between BAT and WAT depots as a function of age. Furthermore, BAT relations to muscle development can be explored, as recent literature suggests that brown adipocytes and myoblasts originate from the same stem cell line (36–38). IDEAL-MRI will be an attractive method to longitudinally investigate BAT function and physiology, and in the assessment of BAT alterations due to diet and temperature manipulations.
Acknowledgments
The authors gratefully thank gratefully thank Dr. Huanzhou Yu and Ann Shimakawa from General Electric Healthcare for providing assistance for providing technical assistance with the IDEAL software.
Grant Support: HHH, MIG, KSN: NCI Centers for Transdisciplinary Research on Energetics and Cancer (TREC) (U54CA116848) and NIDDK (R21 DK 081173, K25 DK 087931-01)
DLS, TRN: NIDDK (P30DK56336, P60DK079626, and T32DK062710)
References
- 1.Cinti S. The role of brown adipose tissue in human obesity. Nutr Metab Cardiovasc Dis. 2006;16:569–574. doi: 10.1016/j.numecd.2006.07.009. [DOI] [PubMed] [Google Scholar]
- 2.Nedergaard J, Bengtsson T, Cannon B. Unexpected evidence for active brown adipose tissue in adult humans. Am J Physiol Endocrinol Metab. 2007;293:E444–452. doi: 10.1152/ajpendo.00691.2006. [DOI] [PubMed] [Google Scholar]
- 3.Himms-Hagen J. Obesity may be due to a malfunctioning of brown fat. Can Med Assoc J. 1979;121:1361–1364. [PMC free article] [PubMed] [Google Scholar]
- 4.Zingaretti MC, Crosta F, Vitali A, et al. The presence of UCP1 demonstrates that metabolically active adipose tissue in the neck of adult humans truly represents brown adipose tissue. Faseb J. 2009 doi: 10.1096/fj.09-133546. [DOI] [PubMed] [Google Scholar]
- 5.Cannon B, Nedergaard J. Brown adipose tissue: function and physiological significance. Physiol Rev. 2004;84:277–359. doi: 10.1152/physrev.00015.2003. [DOI] [PubMed] [Google Scholar]
- 6.Heaton JM. The distribution of brown adipose tissue in the human. J Anat. 1972;112:35–39. [PMC free article] [PubMed] [Google Scholar]
- 7.Aherne W, Hull D. The Site of Heat Production in the Newborn Infant. Proc R Soc Med. 1964;57:1172–1173. doi: 10.1177/003591576405701226. [DOI] [PMC free article] [PubMed] [Google Scholar]
- 8.Hany TF, Gharehpapagh E, Kamel EM, Buck A, Himms-Hagen J, von Schulthess GK. Brown adipose tissue: a factor to consider in symmetrical tracer uptake in the neck and upper chest region. Eur J Nucl Med Mol Imaging. 2002;29:1393–1398. doi: 10.1007/s00259-002-0902-6. [DOI] [PubMed] [Google Scholar]
- 9.Cohade C, Osman M, Pannu HK, Wahl RL. Uptake in supraclavicular area fat (“USA-Fat”): description on 18F-FDG PET/CT. J Nucl Med. 2003;44:170–176. [PubMed] [Google Scholar]
- 10.Yeung HW, Grewal RK, Gonen M, Schoder H, Larson SM. Patterns of (18)F-FDG uptake in adipose tissue and muscle: a potential source of false-positives for PET. J Nucl Med. 2003;44:1789–1796. [PubMed] [Google Scholar]
- 11.van Marken Lichtenbelt WD, Vanhommerig JW, Smulders NM, et al. Cold-activated brown adipose tissue in healthy men. N Engl J Med. 2009;360:1500–1508. doi: 10.1056/NEJMoa0808718. [DOI] [PubMed] [Google Scholar]
- 12.Virtanen KA, Lidell ME, Orava J, et al. Functional brown adipose tissue in healthy adults. N Engl J Med. 2009;360:1518–1525. doi: 10.1056/NEJMoa0808949. [DOI] [PubMed] [Google Scholar]
- 13.Cypess AM, Lehman S, Williams G, et al. Identification and importance of brown adipose tissue in adult humans. N Engl J Med. 2009;360:1509–1517. doi: 10.1056/NEJMoa0810780. [DOI] [PMC free article] [PubMed] [Google Scholar]
- 14.Saito M, Okamatsu-Ogura Y, Matsushita M, et al. High incidence of metabolically active brown adipose tissue in healthy adult humans: effects of cold exposure and adiposity. Diabetes. 2009;58:1526–1531. doi: 10.2337/db09-0530. [DOI] [PMC free article] [PubMed] [Google Scholar]
- 15.Sbarbati A, Guerrini U, Marzola P, Asperio R, Osculati F. Chemical shift imaging at 4.7 tesla of brown adipose tissue. J Lipid Res. 1997;38:343–347. [PubMed] [Google Scholar]
- 16.Lunati E, Marzola P, Nicolato E, Fedrigo M, Villa M, Sbarbati A. In vivo quantitative lipidic map of brown adipose tissue by chemical shift imaging at 4.7 Tesla. J Lipid Res. 1999;40:1395–1400. [PubMed] [Google Scholar]
- 17.Reeder SB, Wen Z, Yu H, et al. Multicoil Dixon chemical species separation with an iterative least-squares estimation method. Magn Reson Med. 2004;51:35–45. doi: 10.1002/mrm.10675. [DOI] [PubMed] [Google Scholar]
- 18.Reeder SB, Pineda AR, Wen Z, et al. Iterative decomposition of water and fat with echo asymmetry and least-squares estimation (IDEAL): application with fast spin-echo imaging. Magn Reson Med. 2005;54:636–644. doi: 10.1002/mrm.20624. [DOI] [PubMed] [Google Scholar]
- 19.Yu H, McKenzie CA, Shimakawa A, et al. Multiecho reconstruction for simultaneous water-fat decomposition and T2* estimation. J Magn Reson Imaging. 2007;26:1153–1161. doi: 10.1002/jmri.21090. [DOI] [PubMed] [Google Scholar]
- 20.Liu CY, McKenzie CA, Yu H, Brittain JH, Reeder SB. Fat quantification with IDEAL gradient echo imaging: correction of bias from T1 and noise. Magn Reson Med. 2007;58:354–364. doi: 10.1002/mrm.21301. [DOI] [PubMed] [Google Scholar]
- 21.Bydder M, Yokoo T, Hamilton G, et al. Relaxation effects in the quantification of fat using gradient echo imaging. Magn Reson Imaging. 2008;26:347–359. doi: 10.1016/j.mri.2007.08.012. [DOI] [PMC free article] [PubMed] [Google Scholar]
- 22.Yu H, Shimakawa A, McKenzie CA, Brodsky E, Brittain JH, Reeder SB. Multiecho water-fat separation and simultaneous R2* estimation with multifrequency fat spectrum modeling. Magn Reson Med. 2008;60:1122–1134. doi: 10.1002/mrm.21737. [DOI] [PMC free article] [PubMed] [Google Scholar]
- 23.Kim H, Taksali SE, Dufour S, et al. Comparative MR study of hepatic fat quantification using single-voxel proton spectroscopy, two-point dixon and three-point IDEAL. Magn Reson Med. 2008;59:521–527. doi: 10.1002/mrm.21561. [DOI] [PMC free article] [PubMed] [Google Scholar]
- 24.Reeder SB, Robson P, Yu H, et al. Quantification of hepatic steatosis with MRI: The effects of accurate fat spectral modeling. J Magn Reson Imaging. 2009;29:1332–1339. doi: 10.1002/jmri.21751. [DOI] [PMC free article] [PubMed] [Google Scholar]
- 25.Yokoo T, Bydder M, Hamilton G, et al. Nonalcoholic fatty liver disease: diagnostic and fat-grading accuracy of low-flip-angle multiecho gradient-recalled-echo MR imaging at 1.5 T. Radiology. 2009;251:67–76. doi: 10.1148/radiol.2511080666. [DOI] [PMC free article] [PubMed] [Google Scholar]
- 26.Ren J, Dimitrov I, Sherry AD, Malloy CR. Composition of adipose tissue and marrow fat in humans by 1H NMR at 7 Tesla. J Lipid Res. 2008;49:2055–2062. doi: 10.1194/jlr.D800010-JLR200. [DOI] [PMC free article] [PubMed] [Google Scholar]
- 27.Zancanaro C, Nano R, Marchioro C, Sbarbati A, Boicelli A, Osculati F. Magnetic resonance spectroscopy investigations of brown adipose tissue and isolated brown adipocytes. J Lipid Res. 1994;35:2191–2199. [PubMed] [Google Scholar]
- 28.Naressi A, Couturier C, Castang I, de Beer R, Graveron-Demilly D. Java-based graphical user interface for MRUI, a software package for quantitation of in vivo/medical magnetic resonance spectroscopy signals. Comput Biol Med. 2001;31:269–286. doi: 10.1016/s0010-4825(01)00006-3. [DOI] [PubMed] [Google Scholar]
- 29.Himms-Hagen J. Impaired thermogenesis and brown fat in obesity. Can J Surg. 1984;27:125. [PubMed] [Google Scholar]
- 30.Himms-Hagen J. Thermogenesis in brown adipose tissue as an energy buffer. Implications for obesity. N Engl J Med. 1984;311:1549–1558. doi: 10.1056/NEJM198412133112407. [DOI] [PubMed] [Google Scholar]
- 31.Bley TA, Wieben O, Francois CJ, Brittain JH, Reeder SB. Fat and water magnetic resonance imaging. J Magn Reson Imaging. 31:4–18. doi: 10.1002/jmri.21895. [DOI] [PubMed] [Google Scholar]
- 32.Lunati E, Farace P, Nicolato E, et al. Polyunsaturated fatty acids mapping by (1)H MR-chemical shift imaging. Magn Reson Med. 2001;46:879–883. doi: 10.1002/mrm.1272. [DOI] [PubMed] [Google Scholar]
- 33.Hines CD, Yu H, Shimakawa A, McKenzie CA, Brittain JH, Reeder SB. T1 independent, T2* corrected MRI with accurate spectral modeling for quantification of fat: validation in a fat-water-SPIO phantom. J Magn Reson Imaging. 2009;30:1215–1222. doi: 10.1002/jmri.21957. [DOI] [PMC free article] [PubMed] [Google Scholar]
- 34.Tanuma Y, Tamamoto M, Ito T, Yokochi C. The occurrence of brown adipose tissue in perirenal fat in Japanese. Arch Histol Jpn. 1975;38:43–70. doi: 10.1679/aohc1950.38.43. [DOI] [PubMed] [Google Scholar]
- 35.Heim T, Hull D. The blood flow and oxygen consumption of brown adipose tissue in the new-born rabbit. J Physiol. 1966;186:42–55. doi: 10.1113/jphysiol.1966.sp008019. [DOI] [PMC free article] [PubMed] [Google Scholar]
- 36.Seale P, Bjork B, Yang W, et al. PRDM16 controls a brown fat/skeletal muscle switch. Nature. 2008;454:961–967. doi: 10.1038/nature07182. [DOI] [PMC free article] [PubMed] [Google Scholar]
- 37.Crisan M, Casteilla L, Lehr L, et al. A reservoir of brown adipocyte progenitors in human skeletal muscle. Stem Cells. 2008;26:2425–2433. doi: 10.1634/stemcells.2008-0325. [DOI] [PubMed] [Google Scholar]
- 38.Farmer SR. Brown fat and skeletal muscle: unlikely cousins? Cell. 2008;134:726–727. doi: 10.1016/j.cell.2008.08.018. [DOI] [PubMed] [Google Scholar]