

SUMMARY
Neogenin has been identified as a receptor for neuronal axon guidance cues netrins and RGMs (repulsive guidance molecules). Here we provide evidence for neogenin in regulating endochondral bone development and BMP (bone morphogenetic protein) signaling. Neogenin deficient mice were impaired in digit/limb development and endochondral ossification. BMP2 induction of Smad1/5/8 phosphorylation and Runx2 expression, but not non-canonical p38 MAPK activation, was reduced in chondrocytes from neogenin mutant mice. BMP receptor association with membrane micro-domains, which is necessary for BMP signaling to Smad, but not p38 MAPK, was diminished in neogenin deficient chondrocytes. Furthermore, RGMs appear to mediate neogenin interaction with BMP receptors in chondrocytes. Taken together, our results indicate that neogenin promotes chondrogenesis in vitro and in vivo, revealing an unexpected mechanism underlying neogenin regulation of BMP signaling.
INTRODUCTION
Endochondral ossification is a cellular process essential for the formation of long bones and most craniofacial bones during skeletal development (Erlebacher et al., 1995; Pogue and Lyons, 2006). It begins with a cartilage template consisting of condensed mesenchymal cells that undergo sequential chondrocyte proliferation and maturation (Erlebacher et al., 1995; Mackie et al., 2008; Pogue and Lyons, 2006). Differentiated chondrocytes eventually ossify to form bone. This process is regulated by many global hormones including growth hormones and thyroids as well as local growth factors such as BMP, FGF (fibroblastic growth factor), PTHrP (parathyroid hormone related protein), and Ihh (Indian hedgehog) (Kronenberg, 2003). Among them, BMPs, members of transforming growth factor β (TGFβ) superfamily, are considered as master regulators of both chondrogenesis and osteoblastogenesis. Multiple BMPs (BMP2/4/6) and their receptors type IA, IB, and II are expressed by chondrocytes and periochondrium (Pathi et al., 1999; Yoon et al., 2005). Their mutation results in aberrant chondrogenesis in mice (Yoon and Lyons, 2004; Yoon et al., 2005; Yoon et al., 2006). Upon BMP stimulation, type I and II receptors form heterodimers to recruit and phosphorylate R-Smads including Smad1, Smad5 and Smad8. R-Smads subsequently form a complex with common Smads (Smad4) and translocate into nuclei to activate transcription of target genes such as Runx2 (ten Dijke, 2006; Wotton and Massague, 2001; Zou et al., 1997). In addition, non-Smad (non-canonical) BMP signaling mediated by Tak1/Tab1 activates p38 MAPK (Gilboa et al., 2000; Hassel et al., 2003; Nohe et al., 2002).
Neogenin, a member of the DCC (deleted in colorectal cancer) family, regulates neuronal axon guidance by serving as a receptor for the guidance cue netrin (Keino-Masu et al., 1996) as well as repulsive cue RGMs (Cole et al., 2007; Rajagopalan et al., 2004). In addition to the nervous system, neogenin is also expressed at high levels in cartilages during embryonic development (Gad et al., 1997). However, its role in cartilage or bone development remains largely unknown. In this study, we provide evidence for a role of neogenin in chondrogenesis. Neogenin mutant mice showed digit mal-development and defective endochondral ossification or bone formation. Chondrocytes from neogenin mutant mice exhibited impaired differentiation. We have investigated mechanisms by which neogenin regulates endochondroal bone formation. Our results demonstrate an unexpected mechanism by which neogenin regulates BMP signaling and function in terminal chondrogenesis and skeletal development.
RESULTS
Neogenin expression in growth plates and bone cells
To study neogenin’s in vivo function, we took advantage of neogenin-deficient mice generated by retrotransposon-mediated “gene trapping” (Mitchell et al., 2001). The insertion of the retrotransposon into the intron between exons 7–8 in the neogenin gene resulted in ~90% reduction in neogenin protein in homozygotes (neogeninm/m) (Figure S1A). The mutant mice in C57/BL6 background reduced in body size and weight (Figure S1B and S1C), and died ~ 30 days after birth, implicating neogenin in skeletal development. To test this hypothesis, mutant embryos were stained with alcian blue (for chondrocyte matrix) and alizarin red (for mineralization). The skeleton size of E14.5 embryos was reduced (Figure S1D). At this age, mineralization of digits of phalanges and sternum was readily detectable in control; however it was drastically reduced or barely detectable in mutant embryos (Figure S1D). These results indicate defective digit development in neogeninm/m embryos.
To understand how neogenin regulates skeletogenesis, we examined its expression in ulna growth plates, where chondrogenesis and endochondrial bone formation occurs (Pogue and Lyons, 2006). Chondrocytes of different stages (resting, proliferative, pre-hypertrophic, and hypertrophic) are distributed in distinct zones in developing long-bone cartilages (Figure 1A) (Goldring et al., 2006; Pogue and Lyons, 2006). Neogenin was expressed in nearly all zones, but at higher levels in hypertrophic chondrocytes and osteoblasts of trabecular bones (Figure 1B). The staining of neogenin was specific because the antibody recognized a single band in lysates of primary chondrocytes from wild type, but not mutant, mice (Figure 1C), and the signal was undetectable by a non-specific IgG (Figure 1B). To further study neogenin expression, we took advantage of neogeninm/m mutant mice that carry a LacZ knocked-in in the neogenin gene, whose expression could be a reporter of endogenous neogenin expression (Mitchell et al., 2001). Indeed, LacZ activity, detectable in both hetero (+/m) - and homozygote (m/m), exhibited a pattern similar to that revealed by immunostaining (Figure 1D). Together, these results demonstrate neogenin expression in developing chondrocytes and osteoblasts with a highest level in hypertrophic chondrocytes.
Figure 1. Neogenin expression in P1 growth plates and impaired endochondral bone formation in neogenin deficient mice.

(A) Illustration of endochondral ossification displayed layered structure. (B) Immunohistochemical staining analysis of neogenin distribution in cartilage. The radius sections of newborn wild type mice were incubated with anti-neogenin or non-specific IgG antibodies and visualized by DAB. Bar, 120 μm. (C) Western blot analysis of lysates from wild type and neogenin mutant chondrocytes using indicated antibodies. (D) Lac Z activity in cartilage of neogeninm\m and +/m mice, in comparison with immunohistochemical staining analysis of neogenin. The growth plates of distal ulnas from new bore mice with indicated genotype were examined. Each layer structures were indicated. Neogenin was highly expressed in hypertrophic chondrocytes and osteoblasts of the trabecular bone. Bar, 10 μm. (E) Chondrogenesis and bone development examined by hematoxylin/eosin and alcian blue/von Kossa staining in ulna sections of wild-type and neogenin mutant littermates at age of P1. Higher power images of each layer were shown in (F). Note that an increased pre- and hypertrophic chondrocyte zones, reduced bone matrix and mineralization (E, star), and decreased trabecular bone volume (F, arrow) were demonstrated. The bone collar formation was not affected (E, asterisk). Quantitative analysis of bone lengths was shown in (G). The length of pre- and hypertrophic zone over total was significantly increased in mutant growth plates (*, P < 0.05, significant difference from wild type control).
Impaired endochondrial bone formation in neogenin deficient mice
To determine if neogenin regulates chondrogenesis in vivo, we examined the structure of distal ulnas of newborn mutant mice. The overall width of ulnas was reduced in mutant mice in comparison with age-controlled littermates (Figure 1E). The length of the growth plate, including pre-hypertrophic and hypertrophic zones, was increased in mutant mice (Figures 1E and 1F). These results implicate deficient terminal differentiation of chondrocytes. In addition, endochondral bone ossification was reduced in neogenin mutant growth plates (Figures. 1E and 1G). Whereas there was no calcium deposition invading into the hypertrophic zones (Figures 1E and 1G), the mineralization capability of periochondral cells appeared to be un-affected (Figure 1E). Defective chondrocyte maturation was also observed in the growth plates of 2–3 weeks old mutant mice (data not shown). Taken together, these results suggest that neogenin is required for terminal chondrogenesis and/or endochondral bone formation in vivo.
Cartilage hypertrophy, blood vessel invasion, and osteoblast invasion are coordinated and highly regulated during chondrogenesis (Goldring et al., 2006). To determine if neogenin regulates these events, we studied expression of PECAM, a marker for invading blood vessels. PECAM positive cells were distributed at the cartilage/bone junction invading into the hypertrophic zone of wild type mice (Figure 2A). However, they were reduced in number and sparsely distributed at the end of hypertrophic zones in mutant (Figure 2B), indicating defective angiogenesis. Collagen X, a matrix protein secreted by mature hypertrophic chondrocytes and osteoblasts (Mackie et al., 2008), was reduced in mutant growth plates (Figures 2C and 2D), suggesting defective osteoblast invasion. Moreover, ~10% of cells at the hypertrophic zone were apoptotic in wild type mice (Figures 2E and 2F), consistent with previous reports (Yoon et al., 2005; Yoon et al., 2006). However, the number of apoptotic cells was reduced in mutant mice (Figures 2A and 2B). The chondrocyte cell proliferation was also examined by immunohistochemical staining of proliferating cell nuclear antigen (PCNA). The number of PCNA positive cells and the length of the proliferative zone in neogenin mutant appeared to be similar to that of wild type control (Figure 2G). However, the ratio of PCNA positive cells over total cells was reduced in mutant growth plates (Figure 2H), suggesting that neogenin mutant chondrocytes may also have reduced mitotic activity.
Figure 2. Reduction of chondrocyte proliferation and apoptosis and decrease of blood vessel invasion and osteoblast function in neogenin deficient growth plates.

(A–B) Decreased blood vessel invasion in neogenin mutant mice, revealed by immunofluorescence staining analysis of PECAM, a marker for angiogenesis. (C–D) Reduced bone matrix deposition in neogenin mutant mice, viewed by anti-collagen X immunostaining. (E–F) Decreased apoptosis at chondro-osseu junction in neogenin mutant mice, revealed by TUNEL analysis. The nuclei were stained with PI (red). In A-F, immunofluorescence staining or TUNEL analyses were carried out in ulna sections of new born mice. Confocal images were shown in (A, C, E), and quantitative analyses of the percentage of positive stained cells (over total cells in the indicated area) were illustrated in (B, D, F). Data shown were mean +/− SEM, n=3; **, p<0.01, significant difference from wild type control. (G–H) Chondrocyte proliferation revealed by immunohistochemical staining analysis of PCNA, a marker for cell proliferation, in ulna sections of P3 mice. DAB images were shown in (G), and quantification analysis of the percentage of positive stained cells (over total cells in the indicated proliferative zone) was shown in (H). Data shown were mean +/− SEM, n=3; *, p<0.05, significant difference from wild type control. Bar, 120 μm.
Neogenin regulation of chondrocyte maturation in a cell autonomous manner
We next examined if neogenin regulates terminal chondrogenesis in a cell autonomous manner. In vitro chondrogenesis assay was performed using chondrocytes derived from wild type and neogenin mutant costal cartilages. Wild type, but not mutant, chondrocytes express neogenin (Figures 3A and 3B). In the presence of the differentiation medium (DM), wild type chondrocytes showed a time dependent cartilage matrix deposition, revealed by alcian blue staining (Figure 3C). In contrast, cartilage matrix deposition was reduced in neogeninm/m chondrocytes (Figure 3C), suggesting a requirement of neogenin for chondrogenesis in vitro and demonstrating a cell autonomous effect by neogenin in this event.
Figure 3. Defective chondrogenesis in vitro in cells from neogenin deficient mice.

Western blot (A) and immunostaining (B) analyses of neogenin expression in wild type (+/+) and mutant (m/m) chondrocytes. Neogenin was detected in wild type, but not mutant, chondrocytes, demonstrating the specificity. Bar, 5 μm. (C) Reduced In vitro chondrocyte differentiation in neogenin deficient cells. Chondrocytes from new born wild type and mutant mice were incubated with differentiation medium (DM, growth medium supplemented with 10 mM β-glyceriophosphate and 50 μg/ml ascorbic acid) for indicated days. Cells were stained with alcian blue to view chondrocyte matrix, a differentiation marker. Bar, 50 μm. (D–F) Real time PCR analysis of genes associated with chondrocyte proliferation and/or differentiation (D), different transcriptional factors known to be important for chondrocyte differentiation (E), and BMP downstream target genes (F) was shown. In (D–F), chondrocytes isolated from new born mice were cultured in the presence of growth medium (GM) or differentiation medium (DM) for 24 hours. RNAs were isolated for real time PCR analysis as described in the Methods. Date were normalized by internal control of GAPDH, and presented as fold over wild type control (mean +/− SD, n = 6); * denoted p<0.05, significant difference from wild type control.
To further study neogenin regulation of chondrocyte maturation, we studied expression of genes associated with different stages of chondrocyte proliferation and/or differentiation. Expression of terminal differentiation markers, such as collagen X (Col X) and osteocalcin, was reduced when mutant chondrocytes were cultured in DM, although MMP9 was slightly reduced (Figure 3D). In contrast, collagen II (Col II), a protein associated with proliferative chondrocytes, was increased in the mutant culture at both GM (growth medium) and DM (Figure 3D). These results, in line with impaired endochondral bone formation in neogenin mutant growth plates, further support for neogenin in chondrocyte maturation.
To understand how neogenin regulates chondrocyte maturation, we compared expression levels of transcription factors essential for chondrogenesis, including Sox6, Sox9, and Runx2 (Karsenty, 2008; Karsenty and Wagner, 2002). Runx2, but not Sox6/9, was down-regulated in neogenin mutant culture particularly at differentiation condition (Figure 3E). Runx2 is known to be induced by the BMP pathway (Karsenty, 2008; Karsenty and Wagner, 2002); therefore, we examined expression of other BMP target genes, including Id1 and Atoh8 (Meynard et al., 2009). Indeed, their expression was induced only in wild type, but not mutant, culture upon differentiation (Figure 3F), supporting the view for a defective BMP signaling in neogenin mutant chondrocytes.
Requirement of neogenin for BMP-induced Smad phosphorylation, but not p38 MAPK activation
Next, we determined if neogenin is required for BMP signaling, a pathway crucial for Runx2 expression and endochondral bone formation (Yoon and Lyons, 2004). Chondrocytes were treated with recombinant BMP2, which increased Smad1/5/8 phosphorylation (p-Smad1/5/8) in a time-dependent manner in wild type culture: elevated within 5 min, and remained high to 60 min (Figures 4A and 4B). However, in neogeninm/m chondrocytes, BMP2 induction of p-Smad1/5/8 was delayed and transient: not elevated until 15 min, and returned to basal levels within 60 min of stimulation (Figures 4A and 4B), suggesting a requirement of neogenin for the induction and maintenance of p-Smad1/5/8. Interestingly, neogenin was only required for BMP2 induction of Smad signaling, but not for non-canonical signaling events, as BMP2-stimulated p38 MAPK phosphorylation was similar in time course and intensity between wild type and mutant chondrocytes (Figures 4A and 4C). Moreover, it is specific for the BMP pathway, not TGFβ stimulated signaling, because phosphorylation of Smad2 and Erk in response to TGFβ showed no difference between wild type and mutant chondrocytes (Figure 4D). Furthermore, Stat1 and Erk activation by FGF, another growth factor important for chondrogenesis, was similar between wild type and neogenin deficient cells (Figure 4E). Together, these observations demonstrate the specificity of neogenin in regulating BMP-induced canonical Smad signaling. In support of this notion was the observation that Runx2 induction by BMP2, revealed by real time PCR analysis, was only observed in wild type, but not mutant, chondrocytes (Figure 4F).
Figure 4. Reduction of Smad1/5/8, but not p38 MAPK, phosphorylation and decreased Runx2 expression in neogenin deficient chondrocytes in response to BMP2.

(A) Decreased BMP2 induced p-Smad1/5/8, but not p-p38 MAPK, in chondrocytes from neogenin mutant mice. Chondrocytes from neogenin+/+ and m/m mice were serum starved for overnight, then stimulated with BMP2 (100 ng/ml) for the indicated time. Cell lysates were analyzed by Western blotting using indicated antibodies. (B-C) Quantitative analysis of data from (A). Phosphorylation of Smad1/5/8 and p38 MAPKwere normalized by total Smad1 and p38 respectively, and quantified by Image J software. Data shown were mean +/− SD, n=3; *, p<0.05, in comparison with control. (D–E) Normal TGF-β and FGF signaling in neogenin deficient chondrocytes. Serum starved chondrocytes were treated with 50 ng/ml TGF-β (D) or 10 ng/ml FGF2 (E) for the indicated time. (F) Reduction of BMP2 induced Runx2 expression in neogenin mutant chondrocytes, which was revealed by real time PCR analysis. Chondrocytes from the wild type and mutant littermates were treated with BMP2 (100 ng/ml) for 2 days. Runx2 transcripts were analyzed by real time PCR and normalized by internal control GAPDH. Data shown were fold over wild type control (mean +/− SD) from 3 independent experiments with duplicate or triplicate samples each; *, p<0.05, significant difference from the wild type control. (G) Rescue of defective BMP reporter expression by neogenin. Wild type and neogenin mutant chondrocytes were transiently transfected vector (control) or neogenin with BMP signaling reporter plasmid (9XSBE-Luc). Transfected cells were stimulated with BMP2 (100 ng/ml). Luciferase activity was normalized and presented as mean +/− S.D. of triplicates from a representative experiment. *, P < 0.05, in comparison with the absence of BMP stimulation. (H) Decreased p-Smad1/5/8 in neogenin mutant growth plates. Cartilage lysates derived from wild type (+/+) and neogenin mutant (m/m) mice at P1 were subjected for Western blot analysis using indicated antibodies. (I) Illustration of a working model for neogenin regulation of BMP signaling and function.
To determine if the defective BMP2 signaling in neogenin deficient cells can be rescued by expression of neogenin, mutant chondrocytes were transiently transfected with neogenin with or without 9XSBE-Luc, a luciferase reporter that contains 9 BMP-Smad responsive elements. Neogenin mutant cells exhibited a reduction of the luciferase activity in response to BMP2 (Figure 4G). Expression of neogenin indeed rescued the phenotype, increasing reporter expression by BMP2 (Figure 4G). These results suggest that the defective BMP2 induction of Runx2 in neogenin mutant chondrocytes may be due to the loss of neogenin protein.
We next addressed if neogenin regulates BMP signaling in vivo. Smad1/5/8 phosphorylation was examined in ulnas cartilages of new born wild type and mutant mice. The p-Smad1/5/8 was reduced in mutant cartilage, especially in prehypertrophic chondrocytes and trabecular osteoblasts, in comparison with the wild type control (Figure S2). Consistently, p-Smad1/5/8 levels were reduced in lysates of mutant tibia cartilage (Figure 4H). In contrast, no apparent change was detected for Smad1 protein, phosphorylation of p38 MAPK and Erk (Figure 4H), pStat1 that was activated by FGF, or pSmad2 that was activated by TGF-β (data not shown), demonstrating the specificity of the effect of neogenin. Together with in vitro studies, these in vivo results support the model that neogenin is necessary for BMP-induced Smad1/5/8 signaling and subsequent expression of Runx2 (Figure 4I).
Rescue of defective BMP signaling and chondrogenesis in neogenin deficient chondrocytes by high dose of BMP2
We next addressed if the defective BMP signaling and function in neogenin mutant chondrocytes can be rescued by exogenous BMP2 treatment. Wild type and mutant chondrocytes were treated with BMP2 and induced Smad1/5/8 phosphorylation and chondrocyte differentiation were examined. Cells treated with 50–100 ng/ml BMP2 showed a decrease of p-Smad1/5/8 in neogeninm/m cells as compared with the wild type control (Figures 5A and 5B). However, BMP2 at doses of >500 ng/ml induced comparable p-Smad1/5/8 in neogenin mutant cells to that in the wild type control (Figures 5A and 5B). In line with this observation, high doses of BMP2 (1000 ng/ml) nearly completely rescued chondrocyte differentiation phenotype as revealed by alcian blue-stained cartilage matrix deposition (Figures 5C, 5D and 5F). Treatment with netrin-1 at both high (~500 ng/ml) and low (~50 ng/ml) doses, failed to rescue the phenotype (Figures 5E and 5F). These results provide additional evidence for defective BMP signaling and function in neogenin mutant cells and suggest that neogenin may play a role in modulating BMP receptor sensitivity and/or binding to BMPs.
Figure 5. In vitro rescue of defective BMP signaling and function in neogenin deficient cells by high doses of BMP2.
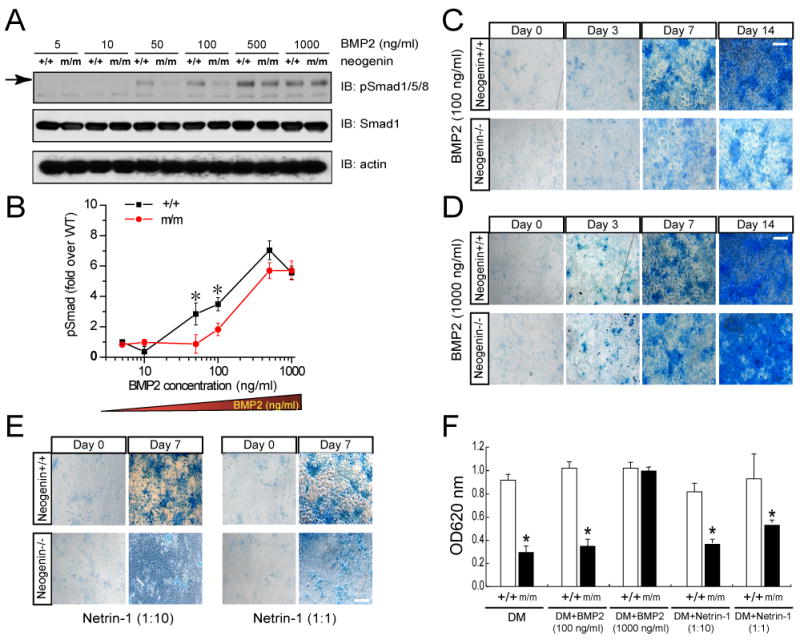
(A–B) Decreased p-Smad1/5/8 was only observed in neogenin mutant chondrocytes in response to low, but not high, doses of BMP2. Chondrocytes from neogenin+/+ and m/m mice were serum starved for overnight, then stimulated with indicated doses of BMP2 for 30 min. Data from (A) were quantified by Image J software, normalized by total Smad1, and presented in (B) as fold over wild type control (BMP2, 5 ng/ml)(mean +/− SD, n=3). (C–F) Defective in vitro chondrocyte differentiation in neogenin mutant cells was rescued by high dose of BMP2 (D), but not low dose of BMP2 (C) or netrin-1(E). Chondrocytes from new born wild type and neogenin mutant mice were incubated with the differentiation medium without or with indicated doses of BMP2 or netrin-1 for indicated days. Chondrocyte differentiation was revealed by alcian blue staining. Images were shown in (C-E), and quantification analyses of data from (C–E, day 7) were illustrated in (F). OD620 values over the wild type control were presented (mean +/− SEM, n=3). *, P < 0.05, significant difference from wild type.
Dependence on neogenin for BMP2-induced BMP receptor association with membrane micro-domains
To explore underlying mechanisms, we first determined if BMP receptor level and distribution were altered in neogenin mutant chondrocytes. Western blot and real time PCR analyses demonstrated a comparable level of BMP receptor (II) in neogenin deficient chondrocytes as wild type control (Figures S3A and S3B). Type IA (BMPRIA) appeared to be slightly reduced in the mutant cells by Western blot, but not by real time PCR analysis (Figures S3A and S3B). Similarly, immunostaining analysis showed comparable levels of BMPRIA and BMPRII in both types of chondrocytes (Figure S3C). We next examined if BMP receptor association with membrane micro-domains of lipid rafts, an event important for BMP signaling (Hartung et al., 2006), is altered in mutant chondrocytes. Chondrocytes were fractionated by OptiPrep density gradient centrifugation (Zhu et al., 2006). 12 fractions were isolated and fraction 5 was identified as a lipid raft fraction, as it was associated with flotillin-1 and caveolin 1, markers of lipid rafts (Figure 6A)(Magee et al., 2002). Note that BMP receptors (IA and II) were not detected in the raft fraction (#5) in the absence of BMP stimulation (Figure 6A). However, upon BMP stimulation, they became present in the lipid raft fraction of wild type chondrocytes (Figures 6A and 6C). Remarkably, this BMP-induced raft association of BMP receptors (IA and II) was abolished in neogenin mutant chondrocytes (Figures 6A and 6C), suggesting a requirement of neogenin. This effect appeared to be specific, as flotillin-1 level was unchanged in mutant or wild type chondrocytes in response to BMP2 stimulation (Figures 6A and 6D). In supporting this view, neogenin association with the raft fraction was also observed upon BMP stimulation, but not at the basal condition (Figures 6E and 6F).
Figure 6. Requirement of neogenin for BMP-induced of BMP receptor association with lipid rafts.

(A) Abolished lipid raft association of BMP receptors (Ia and II) in neogenin mutant chondrocytes in response to BMP2. Primary cultured chondrocytes were treated with or without 100 ng/ml BMP2 for 60 min. Cell lysates were subjected to ultracentrifuge analysis and collected as 12 fractions. Each fraction was analyzed by Western blotting using indicated antibodies. Fraction 5 (between the red dot lines) was considered as lipid raft fraction, as flotinin, a marker of lipid rafts, was enriched in this fraction. (B–D) Data from (A) were quantified by Image J software and presented as percentage of raft fraction over total fractions (mean +/− SEM, n=3). *, p<0.01, in comparison with control. (E–F) Neogenin association with lipid raft fraction in wild type chondrocytes stimulated with BMP2. Western blots were shown in (E) and quantification analysis of data was illustrated in (F). Data shown was percentage of raft fraction over total fractions (mean +/− SEM, n=3). *, p<0.01, in comparison with control.
Requirement of membrane micro-domain association of BMP receptors for BMP induction of Smad phosphorylation and in vitro chondrogenesis
Next, we determined whether BMP receptor association with lipid rafts may be required for BMP induction of canonical Smad1/5/8 phosphorylation. Methyl-β-cyclodextrin (MCD) is a water-soluble cyclic oligomer that is able sequester cholesterol within its hydrophobic core. It has been widely accepted as a plasma membrane cholesterol chelator to disperse lipid rafts (Zhu et al., 2006; Zidovetzki and Levitan, 2007). Pretreatment with 5 μM MCD for 8 hours abolished BMP2-induced BMP receptor association with lipid rafts (data not shown) and reduced Smad1/5/8 phosphorylation (Figures 7A and 7B). However, p38 MAPK phosphorylation by BMP2 was not affected, and the basal level was increased in the presence of MCD (Figures 7A and 7C). These results suggest a requirement for lipid raft association of BMP receptors in BMP induction of Smad1/5/8 phosphorylation, but not p38 MAPK activation. Moreover, we found a significant reduction of cartilage matrix deposition in MCD-treated differentiated chondrocytes (Figure 7D), indicating impaired in vitro chondrogenesis.
Figure 7. Requirement of lipid raft association of BMP receptors for BMP induction of Smad1/5/8, but not p38 MAPK, phosphorylation and chondrocyte differentiation.

(A) Depletion of cholesterol by MCD treatment suppressed phosphorylation of Smad1/5/8, not p38. Primary cultured chondrocytes were pretreated with 5mM MCD for 18 hrs, followed by BMP2 (100ng/ml) stimulation for indicated time. Cell lysates were collected and subjected for Western Blotting analysis using anti-pSmad1/5/8 and p-p38 MAPK antibodies. Stripped membranes were re-blotted with antibodies against Smad1, p38 MAPK and β-actin to indicate equal amount of loading. (B–C) Quantitative analysis of results from (A). Phosphorylation of Smad1/5/8 and p38 were quantified by Image J software and normalized by Smad1 and P38 respectively. Data shown were mean +/− SEM, n=3, *, p<0.05, in comparison with control. (D) Chondrocyte differentiation was attenuated by lipid raft disruption by MCD. Primary cultured chondrocytes were cultured in chondrocyte differentiation medium together with or without MCD for indicated times. Chondrocyte differentiation was evaluated by alcian blue staining.
RGMs expression in chondrocytes that may bridge neogenin with BMP receptors for membrane micro-domain association
To understand underlying mechanisms of neogenin regulation of BMP receptor association with membrane micro-domains, we first examined if neogenin forms a complex with BMP receptors. HEK293 cells expressing Myc-neogenin with or without HA-BMPRs were subjected to coimmunoprecipitation. Weak or undetectable level of neogenin was found in BMPRIA (ALK3) or IB (ALK6)–immunocomplexes (Figure 8A), suggesting little direct interaction between neogenin and BMP receptors. We then asked if RGM acts as a “bridging” protein for neogenin to associate with BMP receptors, because RGMs not only interact with neogenin but also bind to BMPs and BMPRs (Babitt et al., 2006; Babitt et al., 2005; Rajagopalan et al., 2004; Samad et al., 2005; Zhang et al., 2005). Co-expression of RGMc, indeed, increased neogenin association with BMP receptors, particularly to BMPRIA (Figure 8A). These results suggest that a super BMP receptor complex, including BMPR (IA), RGMc, and neogenin, can be formed, and that RGMc may be a linker for neogenin association with BMPRs.
Figure 8. RGM, a linker of neogenin with BMP receptors, in lipid rafts of chondrocytes.

(A) Coimmunoprecipitation analysis of neogenin with BMP receptors in HEK293 cells. Lysates of HEK 293 cells expressing indicated proteins were immunoprecipidated with anti-HA (for BMP receptors) antibody. The resulting immunoprecipitates were subjected for Western blot analysis using anti-Myc antibody (for neogenin). Loading lysates expressing indicated proteins were revealed by Western blot analyses with indicated antibodies (bottom panels). (B) In situ hybridization analysis of RGMc expression in growth plates of P1 distal ulnas. Bar, 150 μm. High-magnification views of each layer structures were shown in bottom panels. RGMc was highly expressed in proliferative and hypertrophic chondrocytes and osteoblasts of the trabecular bone. Bar, 10 μm. (C) Western blot analysis of RGMs (a, b, and c) expression in chondrocytes from wild type and neogenin mutant mice. (D) Coimmunoprecipitation analysis of neogenin with BMPR1a and BMPR2 in chondrocytes. Chondrocytes were stimulated with or without BMP2 (100 ng/ml, 30 min). Cells were lysed with 1% Triton X-100 containing buffer. Lysates were subjected to the ultracentrifuge for isolation of DRM (enriched in lipid rafts) fractions by sucrose gradient as described in Supplemental Experimental Procedures. The membrane proteins isolated from DRM fractions were used for immunoprecipidation and immunoblotting analyses with indicated antibodies (see Supplemental Experimental Procedures). Loading lysates were shown on the bottom right panels, and spliced IP data from the same SDS gel/blot were re-shown in bottom left panels. (E) Reduced lipid raft association of RGMs (a and c) in neogenin mutant chondrocytes stimulated with BMP2. Chondrocytes from wild type(+/+) and neogenin mutant (m/m) mice were treated with or without 100 ng/ml BMP2 for 60 min. Cell lysates were subjected for lipid raft isolation as described in Fig. 6. The resulting 12 fractions were subjected to Western blot analyses with indicated antibodies. (F) Data from (E) were quantified by Image J software and presented as percentage of raft fraction over total fractions (mean +/− SEM, n=3). *, p<0.05, in comparison with wild type control. (G) A diagram illustrating the model for RGMs in bridging neogenin with BMP receptors at the lipid raft in response to BMP stimulation, where p-Smad1/5/8 is activated. In neognein mutant chondrocytes, reduced RGMs and BMP receptors were found in the lipid raft. Thus, a reduced p-Smad1/5/8 signaling and function was observed.
We next determined if RGMc is expressed in chondrocytes in vivo and in culture. In situ hybridization analysis demonstrated that RGMc transcript was expressed in chondrocytes at P1 growth plates (Figure 8B), high in the proliferative and pre-and hyper-trophic zones (Figure 8B). It was also detected in cultured chondrocytes by Western blot analysis (Figure 8C). In addition to RGMc, RGMa and RGMb were also expressed in chondrocytes (Figure 8C). Note that RGM protein levels were unaffected in neogenin mutant chondrocytes (Figure 8C). We then examined if endogenous neogenin forms a complex with BMPR1A, BMPR2, and RGMc in chondrocytes with or without BMP stimulation. To this end, DRM (detergent resistant membrane) fractions were used for coimmunoprecipitation analysis. Neogenin was detected in immuno-complexes of BMPRIA, BMPR2, or RGMc, which were increased by BMP2 stimulation (Figure 8D). The increase of neogenin association with BMPR1A, BMPR2, or RGMc was specific, as neogenin was not detected in the immuno-complex with a nonspecific (NS) rabbit serum nor caveolin-1 (Figure 8D). Moreover, the increase of neogenin association with BMPR1A or RGMc appeared to correlate well with their increase in lipid rafts in response to BMP2 stimulation (Figure 8D). These results support the view that BMP induces a super receptor complex in membrane micro-domains, which contains neogenin, RGMs, and BMP receptors. In further supporting the view, both RGMa and RGMc were detected in the lipid raft fraction of lysates from both wild type and mutant chondrocytes (Figure 8E). However, upon BMP stimulation, both RGMa and RGMc association with lipid raft fraction was increased in wild type, but not neogenin mutant, chondrocytes (Figures 8E and 8G), suggesting a requirement of neogenin for BMP2 induced RGMs association with lipid rafts.
DISCUSSION
The present study provides evidence for neogenin in regulating BMP-induced Smad1/5/8 phosphorylation, terminal chondrogenesis, and endochondral bone formation. Our results suggest that neogenin may regulate chondrocyte maturation by promoting BMP induced BMP receptor association with lipid rafts, thus enhances effective BMP receptor concentration or BMP binding affinity and increases Smad phosphorylation and Runx2 induction.
Neogenin was identified as a binding protein for axon guidance cues like netrins and RGMs and has been implicated in neural development (Rajagopalan et al., 2004; Wilson and Key, 2007; Yamashita et al., 2007; Zhang et al., 2005). This paper provides evidence for a function of neogenin in endochondral bone formation during skeleton development. This is supported by the observations that neogenin is highly expressed in developing/differentiating chondrocytes in culture and in vivo; chondrocytes from neogenin deficient mice show a reduction of matrix deposition and defect on expression of genes associated with chondrocyte maturation. In addition, neogenin mutant mice are impaired in endochondral ossification, reduced chondrocyte hypertrophy, angiogenesis, and osteoblast invasion, phenotypes associated with chondrocyte maturation or endochondral bone formation.
Endochondral bone formation is essential for long bone growth. It involves multiple cellular processes including mesenchymal condensation that form a template of chondrocytes, cell proliferation and hypertrophy, and cell apoptosis, blood vessels invasion, and bone matrix mineralization (Kronenberg, 2003). Various extracellular factors including PTHrP, Ihh, Wnts, FGFs and BMPs coordinate to regulate different cellular processes that eventually lead to endochondral bone formation (Kronenberg, 2003, 2006; Yoon and Lyons, 2004). Though how exactly neogenin regulates endochondral bone formation remains to be further investigated, our studies have pointed that neogenin acts via regulating BMP signaling. This view is supported by the observations that neogenin deficient mice exhibit similar phenotypes as loss-of-function BMPR1A (Bmpr1aCKO) and/or GDF5 mutants (Baur et al., 2000; Yi et al., 2000; Yoon et al., 2005; Yoon et al., 2006). Both mutants show expanded pre- and hypertrophic cartilage and defective hypertrophic terminal differentiation (Yoon et al., 2006). In primary culture, neogenin deficient chondrocytes show altered time course of Smad1/5/8 phosphorylation, reduced Runx2 gene induction, and decreased in vitro chondrogenesis in response to BMP2, providing additional support for neogenin regulation of BMP signaling and function. In agreement with this view, recent reports suggest that neogenin is required for BMP induced hepcidin expression in HepG2 cells (Zhang et al., 2009) and in mouse liver (Lee et al.). It is noteworthy that the skeleton phenotype in neogenin mutant mice appeared to be “weaker” than those Bmpr1aCKO;Bmpr1b+/−, Bmpr1b−/− or Smad1/5CKO;Smad8+/− triple knockout mutant mice (Retting et al., 2009; Yoon et al., 2006). Defective chondrocyte proliferation and reduced Sox9 expression was observed in growth plates in Bmpr1aCKO;Bmpr1b+/− and Smad1/5CKO;Smad8+/− mice (Retting et al., 2009; Yoon et al., 2006), but not in neogenin mutant mice. This difference may be due to neogenin selectively regulating BMPR1A signaling in hypertrophic chondrocytes, as both neogenin and BMPR1A, but not 1B, exhibit a similar expression pattern in growth plates (prehypertrophic and hypertrophic zones) and forms a protein complex in chondrocytes, and both neogenin−/− and Bmpr1aCKO mutants show similar phenotypes (elongated hyperthrophic zones and defective hypertrophic differentiation)(Yoon et al., 2006) (Fig. 2). BMPR1B, however, is not expressed in the same regions, but is expressed at higher level in proliferative chondrocytes, and thus may have different function. Therefore, the double mutant (Bmpr1aCKO;Bmpr1b+/−) exhibit more sever defects (Yoon et al., 2006). Similarly, Smad1/5/8 triple, but not single, mutants show more severe phenotypes (Retting et al., 2009; Yoon et al., 2006), in agreement with the notion that only when all BMP signaling (1A and 1B) is disrupted, more severe phenotypes occur. Taken together, these observations suggest that Smad1/5/8 or BMP receptors (1A and 1B) have broader functions than neogenin does and that neogenin specifically regulates chondrocyte terminal differentiation, possible at the level of BMPR1A.
Note that p38 MAPK phosphorylation induced by BMP appears to be unaffected in neogenin mutant chondrocytes. p38 MAPK is implicated in chondrogenesis, based on observations that inhibition of p38 activity affects cartilage nodule formation (Oh et al., 2000) and influences the transition from the prehypertrophic to hypertrophic chondrocyte phenotype (Zhen et al., 2001). However, our results suggest that the defective chondrocyte maturation in neogenin mutant mice may be primarily due to the impaired Smad, but not p38 MAPK, signaling.
Our studies have suggested an intriguing mechanism underlying neogenin regulation of BMP induced canonical Smad signaling. Neogenin appears to promote BMP receptor association with membrane micro-domains (e.g., lipid rafts), where BMP activates Smad1/5/8, but not p38 MAPK pathway. Lipid raft is known to serve as a signaling platform on cell membrane where multiple signal pathways are initiated (Lajoie et al., 2009). BMP receptors have been found to be associated with lipid rafts in a variety of cell types, including vascular smooth muscle cells and pulmonary endothelium (Hartung et al., 2006; Wertz and Bauer, 2008). Our studies have suggested a role of lipid raft in BMP2 induced canonical Smad phosphorylation. This event may be cell type dependent, as it has been reported that BMP2 induces Smad1/5 phosphorylation in the non-lipid raft regions in HEK293 cells (Hartung et al., 2006).
How does neogenin regulate BMP receptor association with membrane micro-domains/lipid rafts in response by BMP2? Proteins that concentrated in lipid rafts include GPI-linked proteins, doubly acylated proteins (e.g., Src-family kinases), cholesterol-linked and palmitoylated proteins. These proteins may serve as anchors for harboring other proteins upon ligand binding. We speculate that upon BMP stimulation, BMP receptors heterodimerize and form a protein complex with many other proteins, including RGMs, a family GPI anchored proteins that acts as a BMP co-receptor (Babitt et al., 2006; Babitt et al., 2005; Samad et al., 2005) and neogenin. Neogenin may facilitate and stabilize BMP receptor complex in the lipid rafts by its interaction with RGMs. This view is supported by our observations that RGMs are co-expressed with neogenin in chondrocytes and associated with lipid raft fraction; expression of RGMc increases neogenin association with BMP receptors (e.g., BMPR1a); and that neogenin mutant cells reduced BMP2 stimulated RGMa and RGMc association with lipid rafts. However, the exact role of RGMs during endochondral bone formation remains to be further investigated.
In summary, our results suggest that neogenin plays an important role in BMP receptor association with lipid raft, where BMP induces canonical Smad1/5/8 phosphorylation, an essential signaling for terminal chondrocyte differentiation and endochondral bone formation. These results reveal an underlying mechanism of neogenin regulation of BMP signaling, and implicate neogenin as a potential convergent point for crossing talks among different extracellular guidance cues (e.g., netrins and RGMs) and growth factors (e.g., BMPs).
EXPERIMENTAL PROCEDURES
Animals
Neogenin mutant mice, kindly provided by Dr. Sue Ackerman (The Jackson’s laboratory), were generated by Bay Genomics as described previously (Mitchell et al., 2001), which have been crossed into C57BL/6 genetic background. Control littermates were processed in parallel for each experiment. Neogenin mutation was confirmed by genotyping by PCR and by the loss of the neogenin expression by Western blot analysis. All experimental procedures were approved by the Animal Subjects Committee at the Medical College of Georgia, according to U.S. National Institute of Health guidelines.
Skeletal histology analysis
Embryos and dissected limbs were skinned, eviscerated and fixed in 95% ethanol. Skeletal preparations were performed as described previously (Chen et al., 2008). Briefly, the embryos were stained in alcian blue overnight at room temperature. After rinsing with 95% ethanol, they were cleared in 1% KOH overnight at 4 °C, then stained in alizarin red overnight at room temperature. The bone structures were cleared in gradient glycerol/KOH and Store in 100% glycerol. The samples were subject to photography and analysis.
Bone sections were stained with alcian blue/von Kossa/nuclear fast red/safranin O to show the histological structures. The sections were treated with 3% acetic acid for 3 min and stained in 1% alcian blue for 30–45 min. After rinsed in tap water, the sections were stained with 2.5% silver nitrate for 30 min under UV light. Washed the slides and counterstained with nuclear fast red for 3 min.
Primary chondrocyte culture and differentiation
Primary chondrocyte culture was carried out as previously described (Mak et al., 2008). In brief, ventral parts of the rib cages of 0- to 3-day-old wild-type pups were eviscerated of skin and muscles and incubated with 2 mg/ml proteinase (Roche) for 30 minutes at 37°C. The samples were then incubated with 3 mg/ml collagenase D (Roche) in DMEM (Gibco) at 37°C for 1.5 hours until all soft tissues had detached from the cartilage. The cartilage was washed with PBS several times and separated from soft tissues by sedimentation. The cartilage was then digested with collagenase for 4 to 5 hours. Chondrocytes were collected by centrifugation and plated on culture dishes at a density of 1 × 10⁷ cells/ml. Cells were maintained in growth medium (GM)(DMEM with 10% FBS plus penicillin and streptomycin). To induce chondrocyte differentiation, differentiation medium (DM)(growth medium supplemented with 10 mM β-glycerophosphate and 10 μg/ml ascorbic acid) were used. In some experiments, recombinant BMP2 or netrin-1 were added into the DM as indicated.
To evaluate chondrocyte differentiation, alcian blue staining was utilized. Cultured chondrocytes were fixed in 80% methanol for 20 min at −20°C, and then incubated with 0.1% HCl-alcian blue for 2 hrs. Excess stain was washed off. Nodule number was counted. The stain was quantified by solubolizing the stain with 6M guanidine hydrochloride for 8 hrs at room temperature. Absorbance of OD620 nm was measured using a spectrophotometer.
Isolation of lipid rafts
Lipid rafts were prepared as described previously (Zhu et al., 2006). Briefly, cells from a 100 mm dish, either control or treated, were washed two times with ice-cold PBS and lysed with 1.3 ml of ice-cold TNE/CHAPS buffer (20 mM CHAPS, 25 mM TRIS/HCl pH 7.4, 150 mM NaCl, 3 mM EDTA, 1x PMSF, 1x Protease inhibitor Cocktail (Sigma). Lysates were rotated for 30 min at 4°C and homogenized by passing through a 27 gauge needle twenty times. The homogenized lysates an OptiPrep™ concentration of 40% was adjusted by adding 2.7 ml 60% OptiPrep™ solution. The mixture was vortexed vigorously, transferred to an 12.5 ml ultracentrifuge tube (Beckman) and a discontinous OptiPrep™ gradient (30%, 5%) was formed above the lysate by adding 4 ml 30% OptiPrep™ and subsequently 4 ml 5% OptiPrep™. The gradient was ultracentrifuged for 20 h at 39,000 rpm and 4°C using the SW40Ti rotor (Beckman Instruments, Fullerton, CA). Twelve fractions (1 ml each) were collected from top to bottom and designated as fractions 1–12. Fractions were analyzed using SDS-PAGE and subsequent western blotting. To verify the separation, a specific caveolin 1 and flotinin 1 antibody was applied. The fractions 4 and 5 containing flotinin-1 were designated the lipid raft fractions. As a control 100 μl of the lysate were transferred to an eppendorf-tube and centrifuged for 20 min at 13000 rpm and 4°C. In some cases, lysates were concentrated by acetone precipitation. The cleared control-lysates were denatured by adding 20 μl 6 x SDS-sample buffer and boiled for 5 min.
DRM isolation, immunoblotting, and coimmunoprecipitation analysis
The immunoblotting analysis was carried out as described previously (Ren et al., 2004).The cells were washed with ice-cold PBS and solubilized for 30 min on ice in modified radioimmunoprecipitation assay (RIPA) buffer or extraction buffer (0.5% Lubrol-PX, 50 mM KCl, 2 mM CaCl2, 4 mM MgCl2, 20% glycerol, 50 mM Tris-HCl, pH 7.4), supplemented with the protease inhibitors. Lysates were centrifuged at 14,000 rpm for 10 min, and the supernatants were used for immunoprecipitation or Western blotting.
For co-immunoprecipitation, in addition to cell lysates, DRM (detergent resistant membranes) fractions were used. DRM fractions were isolated as previously described (Okamoto et al., 2001). In brief, cells were lysed in TNE buffer (25 mM Tris-HCl, pH7.4, 150 mM NaCl, 5 mM EDTA, 1x PMSF, 1x protease inhibitor cocktail) containing 1% Triton X-100. The DRMs were isolated by gradient sucrose separation by ultracentrifuge (20 hr at 39,000rpm, 4°C). The floating DRM bands were collected and diluted to 12 ml with TNE. Membrane proteins were harvested by centrifugation for 1 hr at 120,000 xg. The resulting pellets were re-solubolized by RIPA buffer. The supernatants, pre-cleared with protein A/G beads, were incubated with indicated antibodies and protein A/G beads at 4°C for overnight. After centrifugation, beads were washed three times with TNE buffer. Bound proteins were eluted with SDS sample buffer and subjected to SDS-PAGE and immuno-blot analysis. For quantitative analysis, autoradiographic films were scanned and analyzed with NIH Image J software.
Statistical analysis
Data were analyzed using an unpaired two tailed Student’s t test and are expressed as the mean plus/minus SD. P values less than 0.05 were considered significant.
Other Procedures
Materials and reagents, expression plasmids, X-Gal staining, transfection and luciferase assays, immunofluorescence confocal microscopy, and quantitative real time RT-PCR analysis were described in Supplemental Experimental Procedures.
Supplementary Material
Acknowledgments
We thank Dr. Sue Ackerman (The Jackson Laboratory) for providing neogenin mutant mice, Drs. E. Olson (University of Texas Southwestern Medical Center), X. Cao (Johns Hopkins Medical School), X.M Shi (Medical College of Georgia), and F. X. Long (Washington University) for reagents, and Dr. D. Chen (University of Rochester) for a cell line. This study was supported in part by grants from National Institutes of Health (WCX and LM).
Footnotes
Publisher's Disclaimer: This is a PDF file of an unedited manuscript that has been accepted for publication. As a service to our customers we are providing this early version of the manuscript. The manuscript will undergo copyediting, typesetting, and review of the resulting proof before it is published in its final citable form. Please note that during the production process errors may be discovered which could affect the content, and all legal disclaimers that apply to the journal pertain.
References
- Babitt JL, Huang FW, Wrighting DM, Xia Y, Sidis Y, Samad TA, Campagna JA, Chung RT, Schneyer AL, Woolf CJ, et al. Bone morphogenetic protein signaling by hemojuvelin regulates hepcidin expression. Nature genetics. 2006;38:531–539. doi: 10.1038/ng1777. [DOI] [PubMed] [Google Scholar]
- Babitt JL, Zhang Y, Samad TA, Xia Y, Tang J, Campagna JA, Schneyer AL, Woolf CJ, Lin HY. Repulsive guidance molecule (RGMa), a DRAGON homologue, is a bone morphogenetic protein co-receptor. The Journal of biological chemistry. 2005;280:29820–29827. doi: 10.1074/jbc.M503511200. [DOI] [PubMed] [Google Scholar]
- Baur ST, Mai JJ, Dymecki SM. Combinatorial signaling through BMP receptor IB and GDF5: shaping of the distal mouse limb and the genetics of distal limb diversity. Development (Cambridge, England) 2000;127:605–619. doi: 10.1242/dev.127.3.605. [DOI] [PubMed] [Google Scholar]
- Chen M, Zhu M, Awad H, Li TF, Sheu TJ, Boyce BF, Chen D, O’Keefe RJ. Inhibition of beta-catenin signaling causes defects in postnatal cartilage development. Journal of cell science. 2008;121:1455–1465. doi: 10.1242/jcs.020362. [DOI] [PMC free article] [PubMed] [Google Scholar]
- Cole SJ, Bradford D, Cooper HM. Neogenin: A multi-functional receptor regulating diverse developmental processes. The international journal of biochemistry & cell biology. 2007;39:1569–1575. doi: 10.1016/j.biocel.2006.11.009. [DOI] [PubMed] [Google Scholar]
- Erlebacher A, Filvaroff EH, Gitelman SE, Derynck R. Toward a molecular understanding of skeletal development. Cell. 1995;80:371–378. doi: 10.1016/0092-8674(95)90487-5. [DOI] [PubMed] [Google Scholar]
- Gad JM, Keeling SL, Wilks AF, Tan SS, Cooper HM. The expression patterns of guidance receptors, DCC and Neogenin, are spatially and temporally distinct throughout mouse embryogenesis. Developmental biology. 1997;192:258–273. doi: 10.1006/dbio.1997.8756. [DOI] [PubMed] [Google Scholar]
- Gilboa L, Nohe A, Geissendorfer T, Sebald W, Henis YI, Knaus P. Bone morphogenetic protein receptor complexes on the surface of live cells: a new oligomerization mode for serine/threonine kinase receptors. Molecular biology of the cell. 2000;11:1023–1035. doi: 10.1091/mbc.11.3.1023. [DOI] [PMC free article] [PubMed] [Google Scholar]
- Goldring MB, Tsuchimochi K, Ijiri K. The control of chondrogenesis. Journal of cellular biochemistry. 2006;97:33–44. doi: 10.1002/jcb.20652. [DOI] [PubMed] [Google Scholar]
- Hartung A, Bitton-Worms K, Rechtman MM, Wenzel V, Boergermann JH, Hassel S, Henis YI, Knaus P. Different routes of bone morphogenic protein (BMP) receptor endocytosis influence BMP signaling. Molecular and cellular biology. 2006;26:7791–7805. doi: 10.1128/MCB.00022-06. [DOI] [PMC free article] [PubMed] [Google Scholar]
- Hassel S, Schmitt S, Hartung A, Roth M, Nohe A, Petersen N, Ehrlich M, Henis YI, Sebald W, Knaus P. Initiation of Smad-dependent and Smad-independent signaling via distinct BMP-receptor complexes. The Journal of bone and joint surgery. 2003;85-A(Suppl 3):44–51. doi: 10.2106/00004623-200300003-00009. [DOI] [PubMed] [Google Scholar]
- Karsenty G. Transcriptional control of skeletogenesis. Annual review of genomics and human genetics. 2008;9:183–196. doi: 10.1146/annurev.genom.9.081307.164437. [DOI] [PubMed] [Google Scholar]
- Karsenty G, Wagner EF. Reaching a genetic and molecular understanding of skeletal development. Developmental cell. 2002;2:389–406. doi: 10.1016/s1534-5807(02)00157-0. [DOI] [PubMed] [Google Scholar]
- Keino-Masu K, Masu M, Hinck L, Leonardo ED, Chan SS, Culotti JG, Tessier-Lavigne M. Deleted in Colorectal Cancer (DCC) encodes a netrin receptor. Cell. 1996;87:175–185. doi: 10.1016/s0092-8674(00)81336-7. [DOI] [PubMed] [Google Scholar]
- Kronenberg HM. Developmental regulation of the growth plate. Nature. 2003;423:332–336. doi: 10.1038/nature01657. [DOI] [PubMed] [Google Scholar]
- Kronenberg HM. PTHrP and skeletal development. Annals of the New York Academy of Sciences. 2006;1068:1–13. doi: 10.1196/annals.1346.002. [DOI] [PubMed] [Google Scholar]
- Lajoie P, Goetz JG, Dennis JW, Nabi IR. Lattices, rafts, and scaffolds: domain regulation of receptor signaling at the plasma membrane. The Journal of cell biology. 2009;185:381–385. doi: 10.1083/jcb.200811059. [DOI] [PMC free article] [PubMed] [Google Scholar]
- Lee DH, Zhou LJ, Zhou Z, Xie JX, Jung JU, Liu Y, Xi CX, Mei L, Xiong WC. Neogenin inhibits HJV secretion and regulates BMP induced hepcidin expression and iron homeostasis. Blood. doi: 10.1182/blood-2009-11-251199. [DOI] [PMC free article] [PubMed] [Google Scholar]
- Mackie EJ, Ahmed YA, Tatarczuch L, Chen KS, Mirams M. Endochondral ossification: how cartilage is converted into bone in the developing skeleton. The international journal of biochemistry & cell biology. 2008;40:46–62. doi: 10.1016/j.biocel.2007.06.009. [DOI] [PubMed] [Google Scholar]
- Magee T, Pirinen N, Adler J, Pagakis SN, Parmryd I. Lipid rafts: cell surface platforms for T cell signaling. Biol Res. 2002;35:127–131. doi: 10.4067/s0716-97602002000200003. [DOI] [PubMed] [Google Scholar]
- Mak KK, Kronenberg HM, Chuang PT, Mackem S, Yang Y. Indian hedgehog signals independently of PTHrP to promote chondrocyte hypertrophy. Development (Cambridge, England) 2008;135:1947–1956. doi: 10.1242/dev.018044. [DOI] [PMC free article] [PubMed] [Google Scholar]
- Meynard D, Kautz L, Darnaud V, Canonne-Hergaux F, Coppin H, Roth MP. Lack of the bone morphogenetic protein BMP6 induces massive iron overload. Nature genetics. 2009;41:478–481. doi: 10.1038/ng.320. [DOI] [PubMed] [Google Scholar]
- Mitchell KJ, Pinson KI, Kelly OG, Brennan J, Zupicich J, Scherz P, Leighton PA, Goodrich LV, Lu X, Avery BJ, et al. Functional analysis of secreted and transmembrane proteins critical to mouse development. Nature genetics. 2001;28:241–249. doi: 10.1038/90074. [DOI] [PubMed] [Google Scholar]
- Nohe A, Hassel S, Ehrlich M, Neubauer F, Sebald W, Henis YI, Knaus P. The mode of bone morphogenetic protein (BMP) receptor oligomerization determines different BMP-2 signaling pathways. The Journal of biological chemistry. 2002;277:5330–5338. doi: 10.1074/jbc.M102750200. [DOI] [PubMed] [Google Scholar]
- Oh CD, Chang SH, Yoon YM, Lee SJ, Lee YS, Kang SS, Chun JS. Opposing role of mitogen-activated protein kinase subtypes, erk-1/2 and p38, in the regulation of chondrogenesis of mesenchymes. The Journal of biological chemistry. 2000;275:5613–5619. doi: 10.1074/jbc.275.8.5613. [DOI] [PubMed] [Google Scholar]
- Okamoto T, Schwab RB, Scherer PE, Lisanti MP. Analysis of the association of proteins with membranes. In: Bonifacino Juan S, et al., editors. Current protocols in cell biology/editorial board. Unit 5. Chapter 5. 2001. p. 4. [DOI] [PubMed] [Google Scholar]
- Pathi S, Rutenberg JB, Johnson RL, Vortkamp A. Interaction of Ihh and BMP/Noggin signaling during cartilage differentiation. Developmental biology. 1999;209:239–253. doi: 10.1006/dbio.1998.9181. [DOI] [PubMed] [Google Scholar]
- Pogue R, Lyons K. BMP signaling in the cartilage growth plate. Current topics in developmental biology. 2006;76:1–48. doi: 10.1016/S0070-2153(06)76001-X. [DOI] [PubMed] [Google Scholar]
- Rajagopalan S, Deitinghoff L, Davis D, Conrad S, Skutella T, Chedotal A, Mueller BK, Strittmatter SM. Neogenin mediates the action of repulsive guidance molecule. Nature cell biology. 2004;6:756–762. doi: 10.1038/ncb1156. [DOI] [PubMed] [Google Scholar]
- Ren XR, Ming GL, Xie Y, Hong Y, Sun DM, Zhao ZQ, Feng Z, Wang Q, Shim S, Chen ZF, et al. Focal adhesion kinase in netrin-1 signaling. Nature neuroscience. 2004;7:1204–1212. doi: 10.1038/nn1330. [DOI] [PubMed] [Google Scholar]
- Retting KN, Song B, Yoon BS, Lyons KM. BMP canonical Smad signaling through Smad1 and Smad5 is required for endochondral bone formation. Development (Cambridge, England) 2009;136:1093–1104. doi: 10.1242/dev.029926. [DOI] [PMC free article] [PubMed] [Google Scholar]
- Samad TA, Rebbapragada A, Bell E, Zhang Y, Sidis Y, Jeong SJ, Campagna JA, Perusini S, Fabrizio DA, Schneyer AL, et al. DRAGON: a bone morphogenetic protein co-receptor. The Journal of biological chemistry. 2005 doi: 10.1074/jbc.M410034200. [DOI] [PubMed] [Google Scholar]
- ten Dijke P. Bone morphogenetic protein signal transduction in bone. Current medical research and opinion. 2006;22(Suppl 1):S7–11. doi: 10.1185/030079906X80576. [DOI] [PubMed] [Google Scholar]
- Wertz JW, Bauer PM. Caveolin-1 regulates BMPRII localization and signaling in vascular smooth muscle cells. Biochemical and biophysical research communications. 2008;375:557–561. doi: 10.1016/j.bbrc.2008.08.066. [DOI] [PubMed] [Google Scholar]
- Wilson NH, Key B. Neogenin: one receptor, many functions. The international journal of biochemistry & cell biology. 2007;39:874–878. doi: 10.1016/j.biocel.2006.10.023. [DOI] [PubMed] [Google Scholar]
- Wotton D, Massague J. Smad transcriptional corepressors in TGF beta family signaling. Current topics in microbiology and immunology. 2001;254:145–164. [PubMed] [Google Scholar]
- Yamashita T, Mueller BK, Hata K. Neogenin and repulsive guidance molecule signaling in the central nervous system. Current opinion in neurobiology. 2007;17:29–34. doi: 10.1016/j.conb.2006.12.001. [DOI] [PubMed] [Google Scholar]
- Yi SE, Daluiski A, Pederson R, Rosen V, Lyons KM. The type I BMP receptor BMPRIB is required for chondrogenesis in the mouse limb. Development (Cambridge, England) 2000;127:621–630. doi: 10.1242/dev.127.3.621. [DOI] [PubMed] [Google Scholar]
- Yoon BS, Lyons KM. Multiple functions of BMPs in chondrogenesis. Journal of cellular biochemistry. 2004;93:93–103. doi: 10.1002/jcb.20211. [DOI] [PubMed] [Google Scholar]
- Yoon BS, Ovchinnikov DA, Yoshii I, Mishina Y, Behringer RR, Lyons KM. Bmpr1a and Bmpr1b have overlapping functions and are essential for chondrogenesis in vivo. Proceedings of the National Academy of Sciences of the United States of America. 2005;102:5062–5067. doi: 10.1073/pnas.0500031102. [DOI] [PMC free article] [PubMed] [Google Scholar]
- Yoon BS, Pogue R, Ovchinnikov DA, Yoshii I, Mishina Y, Behringer RR, Lyons KM. BMPs regulate multiple aspects of growth-plate chondrogenesis through opposing actions on FGF pathways. Development (Cambridge, England) 2006;133:4667–4678. doi: 10.1242/dev.02680. [DOI] [PubMed] [Google Scholar]
- Zhang AS, West AP, Jr, Wyman AE, Bjorkman PJ, Enns CA. Interaction of hemojuvelin with neogenin results in iron accumulation in human embryonic kidney 293 cells. The Journal of biological chemistry. 2005;280:33885–33894. doi: 10.1074/jbc.M506207200. [DOI] [PubMed] [Google Scholar]
- Zhang AS, Yang F, Wang J, Tsukamoto H, Enns CA. Hemojuvelin-neogenin interaction is required for bone morphogenic protein-4-induced hepcidin expression. The Journal of biological chemistry. 2009;284:22580–22589. doi: 10.1074/jbc.M109.027318. [DOI] [PMC free article] [PubMed] [Google Scholar]
- Zhen X, Wei L, Wu Q, Zhang Y, Chen Q. Mitogen-activated protein kinase p38 mediates regulation of chondrocyte differentiation by parathyroid hormone. The Journal of biological chemistry. 2001;276:4879–4885. doi: 10.1074/jbc.M004990200. [DOI] [PubMed] [Google Scholar]
- Zhu D, Xiong WC, Mei L. Lipid rafts serve as a signaling platform for nicotinic acetylcholine receptor clustering. J Neurosci. 2006;26:4841–4851. doi: 10.1523/JNEUROSCI.2807-05.2006. [DOI] [PMC free article] [PubMed] [Google Scholar]
- Zidovetzki R, Levitan I. Use of cyclodextrins to manipulate plasma membrane cholesterol content: evidence, misconceptions and control strategies. Biochimica et biophysica acta. 2007;1768:1311–1324. doi: 10.1016/j.bbamem.2007.03.026. [DOI] [PMC free article] [PubMed] [Google Scholar]
- Zou H, Choe KM, Lu Y, Massague J, Niswander L. BMP signaling and vertebrate limb development. Cold Spring Harbor symposia on quantitative biology. 1997;62:269–272. [PubMed] [Google Scholar]
Associated Data
This section collects any data citations, data availability statements, or supplementary materials included in this article.