Abstract
Background and objectives: Although uremic pruritus (UP) is a highly prevalent complication of chronic kidney disease, it remains poorly characterized. There have been no longitudinal studies of natural history, and no health-related quality of life (HR-QOL) instruments have been developed for UP. The objectives of this study were to describe the natural history of UP, to compare rating scales of itching intensity, and to assess usefulness and validity of HR-QOL instruments for UP.
Design, setting, participants, & measurements: The intensity, severity, and effects of pathologic itching on HR-QOL were assessed prospectively in 103 patients with UP on chronic hemodialysis. Outcome measures were obtained at scheduled intervals over 3.5 months.
Results: Itching daily or nearly daily was reported by 84% of patients and had been ongoing for >1 year in 59%. In 83%, pruritus involved large, nondermatomal areas with striking bilateral symmetry. Two thirds of the patients were using medications such as antihistamines, steroids, and various emollients without satisfactory relief of itching. Statistically significant associations were found among itching intensity, severity, and HR-QOL measures in domains such as mood, social relations, and sleep. Among patients with moderate-to-severe UP, changes in itching intensity of 20% or greater were associated with significant reductions in HR-QOL measures.
Conclusions: This first longitudinal study of UP describes key features of UP and its effect on HR-QOL. The assessment instruments we have developed are easily used, are responsive to changes in UP intensity, and should facilitate clinical evaluation and research to meet the needs of afflicted patients.
Uremic pruritus (UP) is a common and distressing complication of end-stage renal disease (ESRD). A global cross-sectional study of >18,000 hemodialysis patients reported a 42% prevalence of moderate or extreme UP, which was strongly associated with sleep disturbance, depression, impaired quality of life, and mortality (1). Despite high prevalence and life-altering comorbidities, UP remains poorly characterized and lacks effective treatment. Clinicians have made efforts to ameliorate possible contributing factors by delivering adequate dialysis and controlling, for example, hyperparathyroidism, hyperphosphatemia, and anemia. Despite best attempts at prevention and control, many hemodialysis patients continue to be afflicted by chronic, intense itching. Treatments currently used for uremic pruritus such as antihistamines, steroids, emollients, and phototherapy (UVB) have not been investigated rigorously, and no drugs have been approved for this indication by the U.S. Food and Drug Administration. Lack of data on the natural history of UP and paucity of relevant measurement tools have been among the impediments to progress.
Hence, our objectives in conducting this first observational longitudinal study of UP was to better characterize its natural history and to develop useful, reliable, and valid instruments to assess intensity, severity, and effect on health-related quality of life (HR-QOL).
Materials and Methods
Patient-Reported Outcomes Instrument Development
We began patient-reported outcomes instrument development by noting the similarities between neuropathic pain and pathologic pruritus (2). Both conditions are subjectively experienced and may or may not be associated with objective findings. Neurobiologically, disease-associated changes in peripheral and central nervous system sensory pathways have been demonstrated in both pathologic pruritus and neuropathic pain. Because of the aversive and pervasive nature of both conditions, many of the clinical complications are similar, such as emotional distress, diminished enjoyment of life, work, and social relations, and poor quality of sleep (3,4).
In developing HR-QOL instruments for the study of UP, we reviewed both the pruritus and neuropathic pain literature and consulted physicians specializing in nephrology, pain, neurology, and dermatology. To ascertain expert opinion on UP and its sequelae, we convened a panel of leading physician and scientific experts on pruritus from the United States, Japan, and Europe. To elicit patients' perspectives, we used responses from a web-based survey of ESRD patients with UP.
On the basis of this input, we developed several tools for this investigation. For itching intensity, we adapted two scales from those used most widely for quantifying intensity of pain: the 100-mm visual analog scale (VAS) (5–12) and the 11-point numerical rating scale (NRS) (13–15). The VAS scale already has been used for assessing itching intensity in clinical trials (5–12). We were interested in comparing patients' ease of use of the NRS with the VAS and in measuring correlations between the two scales. The UP intensity scales were designed to measure “worst” itching over the previous 24 hours, with separate measurements for worst daytime and worst nighttime itching.
Two quality of life (QOL) measures in particular influenced our development of UP QOL instruments: the Skindex-16, widely used for pruritic dermatologic disorders and previously correlated with the VAS (16), and the Brief Pain Inventory, developed for use in neuropathic pain (17). Both the Brief Pain Inventory and the Skindex-16 have overlapping domains of mood, emotional distress, and social functioning, underscoring the similarity in the construct for evaluating HR-QOL in pain and pruritus. The Brief Pain Inventory additionally includes a question on disruption of sleep, known to complicate UP, and also a body diagram useful for showing spatial distribution of symptoms.
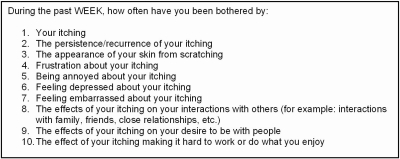
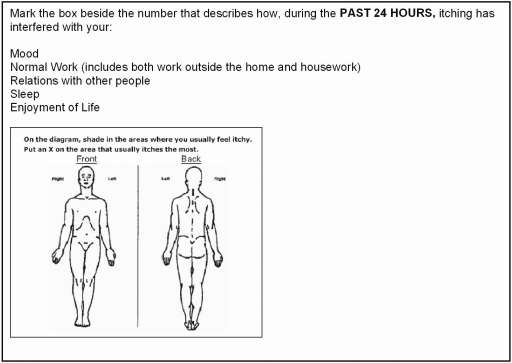
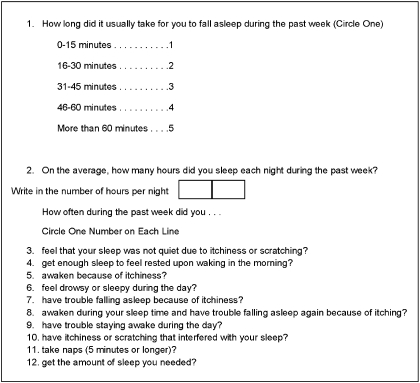
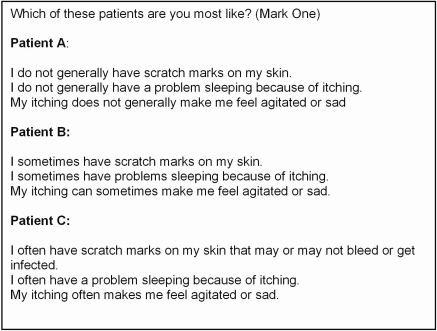
Developed for UP, the “Skindex-10” and “Brief Itching Inventory” (BII) are shown in Figures 1 and 2. Because sleep disturbance is a commonly reported complication of nocturnal itching, we adapted the sleep survey from the Medical Outcomes Study (MOS) (18), a 2-year study of patients with chronic conditions. The “Itch MOS” is shown in Figure 3. In addition, we developed a multidimensional question (“Self-Assessed Disease Severity”) to allow patients to categorize themselves into one of three “types” of patient (e.g., A, B, or C), depending on severity of concomitant signs and symptoms (Figure 4). This self-categorization instrument was previously tested in a web-based survey of 101 patients on hemodialysis and found to predict intensity and chronicity of UP (3).
Figure 1.
Skindex-10. Patients filled one of seven bubbles (“0 [never bothered], 1, 2, 3, 4, 5, and 6 [always bothered]”) for each of the questions. The total score was the sum of the numeric value of each answered question. The domain scores were sums of the following: disease domain (questions 1 to 3), mood/emotional distress domain (questions 4 to 6), and social functioning domain (questions 7 to 10).
Figure 2.
Brief Itching Inventory. Patients filled 1 of 11 bubbles (“0 [itch does not interfere)] 1, 2, 3, 4, 5, 6, 7, 8, 9, and 10 [itch completely interferes]”) for each of the questions above. The total score was the sum of the numeric value of each answered question. The body diagram was not quantified.
Figure 3.
Itch MOS (of sleep). For most questions, patients circled one of six numbers ranging from “1” (“all of the time”) to “6” (“none of the time”), indicating the frequency of various aspects of pruritus-related sleep disruption over the preceding week. Patients also estimated the average amount of sleep per night during the past week.
Figure 4.
Patient self-categorization of pruritus disease severity. Patients selected one of three patient profiles that most closely resembled them.
Statistical Analyses
Continuous variable endpoints were compared using ANOVA with post hoc analysis by all pairwise multiple comparisons (Tukey). Categorical variables were analyzed using χ2 or Fisher's exact test. Correlations were derived from a simple linear regression model.
The ITCH National Registry Study
In this prospective, multicenter, longitudinal, observational study, 103 patients on stable hemodialysis were enrolled from 13 dialysis units in the United States. The study was approved by an institutional review board and all patients gave their written informed consent. Patients who were ≥18 years, had been receiving chronic hemodialysis three or more times per week, had pruritus (defined as score of >10 mm on a 100-mm VAS), and were able to understand and complete the patient questionnaires were recruited for the study. Patients who had pruritus that was attributed to a cause other than ESRD or its complications were excluded. Potential causes of pruritus such as hyperparathyroidism or anemia were considered to be complications of ESRD; therefore, such patients were allowed to enroll in the study. Patients were excluded if they had had a significant alteration in their dialysis regimen within 2 weeks of screening, such as changes in dialysis filter type, increase or decrease by >1 h/wk in prescribed dialysis time, change in type or site of dialysis access, or change in prescribed blood flow rate by >100 ml/min.
Patients completed questionnaires during their hemodialysis sessions or while they were physically in the dialysis unit under staff supervision. The questionnaires included the VAS, NRS, Skindex-10, BII, Itch MOS, and the Self-Assessment of Disease Severity. The Beck Depression Index was also administered to evaluate the most common comorbid affective disorder among patients with ESRD (19,20).
Site personnel were carefully and consistently trained, in person, by a single trainer, on administration of the study patient questionnaires. We standardized the patient experience by having site personnel read aloud a set of instructions before the completion of every questionnaire. Patients underwent two practice sessions for training purposes during which they completed all of the questions that they would encounter during the study. They were to complete the surveys without input on the answers from site staff or other patients. Study coordinators collected laboratory, dialysis, medical history, and medication information by chart review.
The study was conducted in two phases: a 12-week initial study (part 1) and a 2-week follow-up study (part 2). During part 1, patients underwent a screening visit, two training sessions over 1 or more days, a baseline visit, and six follow-up visits (one every 2 weeks). During part 2, patients underwent six visits on six consecutive dialysis sessions over approximately 2 weeks. The investigator at one site left his practice between parts 1 and 2 of the study. As a result, his 13 patients (9 men and 4 women) were not able to participate in part 2. The etiology of end-stage renal disease in these patients was hypertension (n = 9), diabetes (n = 3), and glomerulonephritis (n = 1), and their mean worst night and day VAS scores were 63 ± 18 and 61 ± 15.6 mm, respectively.
The objectives of the two study phases were to describe disease activity over longer and shorter intervals of time and, in part 2, to conduct test-retest reliability assessments on selected outcome measures (e.g., VAS, the correlation of BII with Skindex-10, the correlation of VAS with Skindex-10, and the relationship between both Skindex-10 and BII and Self-Assessed Disease Severity).
Results
Baseline Characteristics
Baseline characteristics of the study population are summarized in Table 1. A medical history of depression (38.5%), anxiety (25.6%), and insomnia (25.6%) were common, but only 3.6 and 1.3% of patients had a history of dermatitis or xerosis, respectively. Nearly 27% had a history of neuropathy and 13.2% had previously had a stroke or transient ischemic attack.
Table 1.
Demographics and baseline characteristics (n = 103)
| Baseline Characteristics | Mean (SD) or n (%) |
|---|---|
| Age | 56 (14.2) |
| Gender (% male) | 53 (52%) |
| Race | |
| Caucasian | 32 (31.4%) |
| African American | 68 (66.7%) |
| other | 2 (2.0%) |
| Etiology of ESRDa | |
| hypertension | 41 (40.2%) |
| diabetes | 48 (47.1%) |
| glomerulonephritis | 6 (5.9%) |
| cystic kidney disease | 3 (2.9%) |
| urologic | 0 |
| other | 12 (11.8%) |
| Years of ESRD | 4.1 (3.0) |
| Years on hemodialysis | 4.2 (2.9) |
| No. years of itching daily/nearly daily | |
| not daily/nearly daily | 15 (14.6%) |
| <1 year | 27 (26.2%) |
| 1 to 5 years | 43 (41.7%) |
| >5 years | 18 (17.5%) |
| Oral antihistamines (over the counter) | 20 (19.4%) |
| Oral antihistamines (prescribed) | 13 (12.3%) |
| IV antihistamines | 8 (7.8%) |
| Topical antihistamines | 0 (0%) |
| Gabapentin | 14 (13.6%) |
| Topical corticosteroids | 3 (2.9%) |
| IV or oral corticosteroids | 4 (3.9%) |
| Naltrexone | 1 (1%) |
| Topical tacrolimus | 0 |
| UVB treatment | 0 |
| Antidepressants | 29 (8.1%) |
| Anti-anxiolytics/sedatives | 24 (23.8%) |
| Opiods and opioid combinationb | 38 (36.9%) |
| Nonprescription sleep aid | 2 (1.9%) |
More than one primary etiology was reported for several patients.
Excluding naltrexone.
Clinical Description of Uremic Pruritus
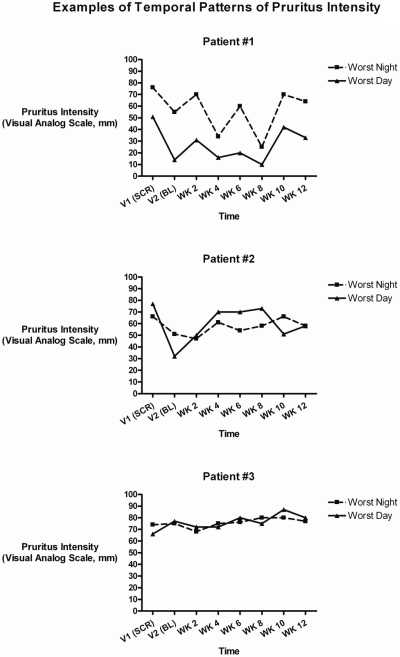
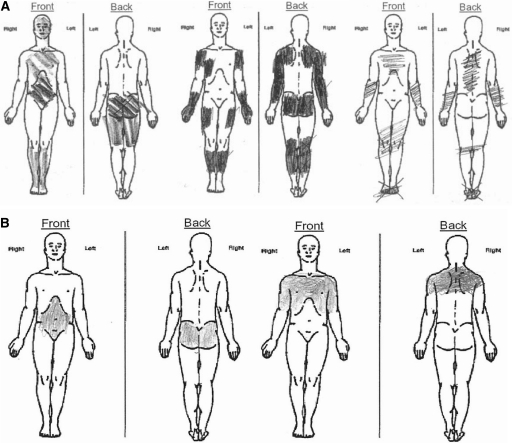
Only 2 patients who were consented for the study failed to qualify for it; failure was based, per protocol, on screening visit VAS measurements of pruritus intensity that were <10 mm. The mean worst itching intensity for enrolled patients was 59.9 mm. Among enrollees, 84% reported having itching daily or nearly daily and 59% had had daily/nearly daily itching for >1 year (Table 1). Over the first 12 weeks of the study, itch intensity fluctuated and appeared to be somewhat cyclical in some patients, but in none did itching entirely resolve (Figure 5). In general, mean worst itching intensity was higher (worse) for the 12-hour nighttime period than for the 12-hour daytime period. Qualitative evaluation of patterns of pruritus distribution, using standardized body diagrams, revealed that 83% of patients had itching over large, discontinuous, nondermatomal regions of skin with striking bilateral symmetry (Figure 6). Even where affected areas changed markedly from baseline to week 12, bilateral symmetry was preserved. Pruritus distribution was highly variable from patient to patient, whereas manifestation of mirror symmetry was an attribute they had in common.
Figure 5.
Over 12 weeks of follow-up, itch intensity fluctuated and appeared to be cyclical in some patients, although rarely normalizing if the baseline VAS was >40 mm. SCR, screening; BL, baseline; WK, week.
Figure 6.
Spatial patterns of uremic pruritus. (A) Representative body diagrams from 3 subjects depicting pruritus-affected areas. (B) Pruritus distribution in a single patient at baseline and at week 14 in the study.
Demographic factors such as race, years of ESRD, and etiology of renal failure did not distinguish patients as to greater or lesser severity of UP. Laboratory measures such as calcium-phosphate product, parathyroid hormone levels, hemoglobin, and dialysis adequacy, as estimated by Kt/V, also were similar across severity types. However, a significant effect of age was observed; patients categorizing themselves as severity types B or C were, on average, 10 years younger than those categorizing themselves as type A (Table 2).
Table 2.
Baseline characteristics by patient-assessed disease severity
| Characteristic | A (n = 35) | B (n = 43) | C (n = 25) | P |
|---|---|---|---|---|
| Age (years) | 63 (11.7) | 54 (15.3) | 53 (13.2) | 0.0048 |
| Gender (% male) | 57% | 49% | 50% | 0.74 |
| Race (%) | ||||
| Caucasian | 29% | 30% | 38% | |
| African American | 71% | 67% | 58% | 0.69 |
| other | 0% | 2% | 4% | |
| Years of ESRD | 3.8 (2.3) | 4.1 (3.1) | 4.7 (3.7) | 0.49 |
| ESRD etiology | ||||
| diabetes | 46% | 51% | 42% | 0.97 |
| hypertension | 43% | 37% | 42% | |
| Ca X P product (mg2/dl2) | 46.2 (12.7) | 51.6 (14.7) | 48.1 (14.6) | 0.24 |
| PTH (pg/ml) | 359 (221) | 415 (381) | 343 (288) | 0.60 |
| Kt/V | 1.61 (0.22) | 1.54 (0.37) | 1.66 (0.35) | 0.29 |
| Hemoglobin (g/dl) | 11.6 (1.4) | 11.9 (1.5) | 11.4 (1.5) | 0.41 |
Data are expressed as means (SD) or percentages. Kt/V is a measure of dialysis adequacy. By the Kt/V method, the means in the A, B, and C groups were as follows: equilibrated [1.6, 1.4, and 1.4; single pool [1.9, 1.7, and 1.7]; natural log [1.8, 1.6, and 1.6]; and unknown [1.7, 1.5, and 1.7].
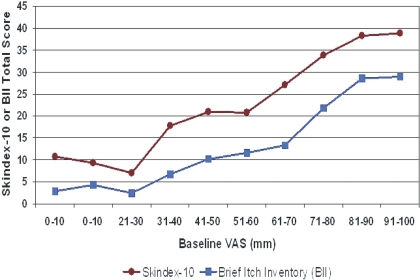
Both the self-categorization of disease severity and VAS measures of itching intensity were associated with lower HR-QOL in all domains measured: sleep, mood/emotional distress, and social functioning/work (Tables 3 and 4). Nearly all individual questions within the Skindex-10 and BII HR-QOL instruments as well as total scores were statistically significantly different across categories of VAS and Self-Assessed Disease Severity (Tables 3 and 4). Relatively small increments of VAS (approximately 10 mm) across a wide range of itching intensities (30 to 90 mm) were associated with poorer health-related quality of life measures (Figure 7). Standardized response means (SRM), the ratio between the mean change from baseline score and the SD of the change in the score, are shown in Table 5 for patient groups with 20% or greater VAS worsening and 20% or greater improvement at weeks 4, 8, and 12, compared with baseline. Longitudinally, changes in itching intensity of ±20% or greater from baseline were associated with clinically significant changes as indicated by SRMs of ≥0.5 or less than −0.5 in the Skindex-10 (moderate effect size) and ≥0.2 or less than −0.2 in the BII at 4, 8, and 12 weeks.
Table 3.
Baseline burden of disease by patient-assessed disease severity
| Characteristic | Patient Type A(n = 35) | Patient Type B(n = 43) | Patient Type C(n = 25) | P(ANOVA) |
|---|---|---|---|---|
| Itching intensity and level of annoyance | ||||
| worst itch, night (VAS, 0 to 100) | 43.2 (28.6) | 55.3 (20.6) | 72.5 (14.1) | <0.001 |
| worst itch, day (VAS, 0 to 100) | 41.5 (28.6) | 46.7 (22.6) | 62.8 (22.3) | 0.0058 |
| worst itch, night (NRS, 0 to 10) | 4.5 (3.0) | 5.3 (2.2) | 7.2 (2.3) | <0.001 |
| worst itch, day (NRS, 0 to 10) | 4.5 (3.0) | 5.1 (2.3) | 6.5 (2.3) | 0.012 |
| how much do you itch right now? (0 to 10) | 2.8 (2.5) | 4.1 (2.6) | 5.5 (2.9) | <0.001 |
| past week, bothered by your itching (0 to 6)a | 2.2 (1.6) | 3.1 (1.2) | 4.5 (1.6) | <0.001 |
| past week, bothered by persistence or recurrence of your itching (0 to 6)a | 2.2 (1.6) | 3.1 (1.3) | 4.2 (1.8) | <0.001 |
| past week, bothered by the appearance of your skin from scratching (0 to 6)a | 1.7 (1.89) | 3.0 (1.83) | 4.3 (1.79) | <0.001 |
| Sleep disruption | ||||
| itching interfered with sleep (0 to 10) | 2.6 (3.2) | 4.3 (2.9) | 7.0 (3.0) | 0.001 |
| hours of sleep last night | 5.5 (2.2) | 4.9 (2.2) | 4.2 (2.2) | 0.0032 |
| hours of sleep lost because of itching | 1.0 (1.4) | 1.7 (1.9) | 1.9 (1.5) | 0.167 |
| MMOS sleep survey scoreb (10 to 60) | 33.3 (14.9) | 47.9 (14.2) | 58.8 (13.2) | <0.0001 |
| Mood/emotional distress | ||||
| past week, bothered by frustration about itching (0 to 6)c | 2.3 (2.1) | 3.3 (1.9) | 4.4 (1.8) | <0.001 |
| past week, bothered by being annoyed about your itching (0 to 6)c | 2.2 (1.9) | 3.8 (1.9) | 4.6 (1.8) | <0.001 |
| past week, bothered by feeling depressed about your itching (0 to 6)c | 0.9 (1.8) | 1.6 (1.5) | 3.7 (2.0) | <0.001 |
| past 24 hours, itching interfered with your enjoyment of life (0 to 10) | 1.5 (2.8) | 3.0 (3.0) | 5.5 (3.8) | <0.001 |
| Beck Depression Index total score | 8.5 (7.0) | 13.3 (10.5) | 23.4 (15.7) | <0.001 |
| Socialization/work | ||||
| past week, bothered by feeling embarrassed by your itching (0 to 6)d | 1.2 (1.8) | 1.6 (1.8) | 3.3 (2.1) | <0.001 |
| past week, bothered by the effects of your itching on interactions with others (0 to 6)d | 0.9 (1.6) | 1.8 (2.0) | 2.9 (2.1) | <0.001 |
| past week, bothered by the effects of your itching on your desire to be with people (0 to 6)d | 0.8 (1.5) | 1.4 (1.7) | 3.2 (2.1) | <0.001 |
| past week, bothered by the effect of your itching making it hard to work or do what you enjoy (0 to 6)d | 1.2 (1.9) | 1.7 (1.8) | 3.5 (2.1) | <0.001 |
| past 24 hours, itching interfered with your normal work (0 to 10) | 1.5 (2.5) | 2.7 (2.8) | 4.6 (3.6) | <0.001 |
| past 24 hours, itching interfered with your relations with other people (0 to 10) | 1.20 (2.5) | 1.95 (2.3) | 4.08 (3.3) | <0.001 |
| Composite scores | ||||
| Skindex-10 (0 to 60) | 16.8 (14.0) | 25.8 (13.8) | 39.9 (14.4) | <0.001 |
| BII (0 to 50) | 8.3 (12.0) | 14.9 (11.6) | 27.2 (14.0) | <0.001 |
Data are expressed as means (SD) or percentages. Kt/V is a measure of dialysis adequacy. Continuous variables via ANOVA with post hoc analysis of all pairwise comparisons (Tukey).
Skindex-10 disease domain question.
The value is based on the standard MMOS score SLP-9 and is based on data from visit 14 (n = 78).
Skindex-10 mood/emotional distress domain question.
Skindex-10 social functioning domain question.
Table 4.
Baseline burden of disease by pruritus intensity
| Characteristic | <50 mm | 51 to 70 mm | >71 mm | P(ANOVA) |
|---|---|---|---|---|
| Itching intensity and level of annoyance | ||||
| worst itch, night (VAS, 0 to 100 mm) | 26.7 (15.3) | 56.7 (31.0) | 76.1 (41.0) | <0.001 |
| worst itch, day (VAS, 0 to 100 mm) | 24.6 (14.5) | 48.6 (18.0) | 67.4 (23.2) | <0.001 |
| worst itch, night (NRS, 0 to 10) | 2.8 (1.7) | 5.7 (1.8) | 7.4 (2.1) | <0.001 |
| worst itch, day (NRS, 0 to 10) | 2.8 (1.9) | 5.5 (1.8) | 6.9 (2.2) | <0.001 |
| how much do you itch right now? (0 to 10) | 2.2 (2.3) | 4.3 (2.3) | 5.2 (2.8) | <0.001 |
| past week, bothered by your itching (0 to 6)a | 2.7 (1.5) | 3.9 (1.4) | 5.2 (1.1) | <0.001 |
| past week, bothered by persistence or recurrence of your itching (0 to 6)a | 2.6 (1.7) | 3.6 (1.7) | 4.8 (1.4) | <0.001 |
| past week, bothered by the appearance of your skin from scratching (0 to 6)a | 1.9 (1.9) | 2.7 (2.0) | 3.7 (2.0) | 0.001 |
| Sleep disruption | ||||
| itching interfered with sleep (0 to 10) | 1.9 (2.3) | 3,9 (2.9) | 6.6 (3.1) | <0.001 |
| hours of sleep lost because of itching | 0.8 (1.1) | 1.2 (2.1) | 2.2 (2.1) | 0.003 |
| MMOS sleep survey SLP-9b (10 to 60) | 35.4 (15.0) | 45.4 (14.6) | 55.1 (14.6) | <0.001 |
| Mood/emotional distress | ||||
| past week, bothered by frustration about itching (0 to 6)c | 2.2 (1.9) | 2.8 (2.0) | 4.3 (1.8) | <0.001 |
| past week, bothered by being annoyed about your itching (0 to 6)c | 2.3 (1.9) | 3.1 (2.1) | 4.5 (1.6) | <0.001 |
| past week, bothered by feeling depressed about your itching (0 to 6)c | 0.93 (1.4) | 1.8 (1.9) | 2.7 (2.3) | <0.001 |
| past 24 hours, itching interfered with you enjoyment of life (0 to 10) | 1.3 (2.0) | 2.3 (2.7) | 5.1 (3.9) | <0.001 |
| Beck Depression Index total score | 10.8 (8.9) | 12.7 (11.5) | 17.7 (14.3) | 0.04 |
| Socialization/work | ||||
| past week, bothered by feeling embarrassed by your itching (0 to 6)d | 0.93 (1.5) | 1.8 (1.8) | 2.7 (2.3) | <0.001 |
| past week, bothered by the effects of your itching on interactions with others (0 to 6)d | 0.7 (1.3) | 2.0 (2.0) | 2.4 (2.2) | <0.001 |
| past week, bothered by the effects of your itching on your desire to be with people (0 to 6)d | 0.6 (1.3) | 1.5 (1.7) | 2.5 (2.1) | <0.001 |
| past week, bothered by the effect of your itching making it hard to work or do what you enjoy (0 to 6)c | 0.7 (1.2) | 1.5 (1.6) | 3.3 (2.3) | <0.001 |
| past 24 hours, itching interfered with your normal work (0 to 10) | 1.0 (1.5) | 2.0 (2.3) | 4.7 (3.6) | <0.001 |
| past 24 hours, itching interfered with your relations with other people (0 to 10) | 0.7 (1.3) | 1.8 (2.4) | 3.6 (3.3) | <0.001 |
| Composite scores | ||||
| Skindex-10 (0 to 60) | 15.0 (12.2) | 24.4 (15.1) | 35.6 (14.3) | <0.001 |
| BII (0 to 50) | 6.3 (7.7) | 12.6 (11.0) | 24.9 (14.5) | <0.001 |
Data are expressed as means (SD) or percentages. Kt/V is a measure of dialysis adequacy. Continuous variables via ANOVA with post hoc analysis by all pairwise multiple comparison (Tukey).
Skindex-10 disease domain question.
The value is based on the standard MMOS score SLP-9 and is based on data from visit 14 (n = 62).
Skindex-10 mood/emotional distress domain question.
Skindex-10 social functioning domain question.
Figure 7.
Quality of life decrements with incremental increases in pruritus intensity (VAS). Linear relationship between 10-mm incremental increases in the visual analogue scale score between 30 and 80 mm and quality of life decrements on the Skindex-10 and Brief Itching Inventory.
Table 5.
Responsiveness of HR-QOL measures to changes in uremic pruritus intensity
| Change from Baseline to Weeks 4, 8, and 12 in HR-QOL Scores |
||||
|---|---|---|---|---|
| BII |
Skindex-10 |
|||
| VAS ≥20% Worse | VAS ≥20% Better | VAS ≥20% Worse | VAS ≥20% Better | |
| Week 4 | ||||
| n | 10 | 23 | 10 | 23 |
| mean (SD) | −3.7 (9.1) | 6.7 (11.0) | −3.2 (8.0) | 9.0 (11.1) |
| SRM | −0.40 | 0.61 | −0.40 | 0.81 |
| Week 8 | ||||
| n | 12 | 15 | 12 | 15 |
| mean (SD) | −4.5 (14.7) | 6.5 (12.8) | −6.1 (5.7) | 12.5 (16.1) |
| SRM | −0.31 | 0.51 | −1.1 | 0.78 |
| Week 12 | ||||
| n | 20 | 18 | 20 | 18 |
| mean (SD) | −5.3 (12.3) | 5.9 (14.5) | −5 (8.7) | 9.0 (15.5) |
| SRM | −0.43 | 0.41 | −0.58 | 0.58 |
SRM is the mean change from baseline/standard deviation (SD) of the change in the score.
Antipruritic Medication Usage
Sixty-seven percent of patients were taking medications for pruritus. Those with greater UP severity were somewhat more likely to take medications (56, 74, and 70% in categories A, B, and C, respectively). All type C patients (representing 25% of the study population) reported that the medications “did not help at all” or only “helped a little,” compared with two thirds of type A patients. Consistent with reports of medication ineffectiveness, pruritus intensity was high and associated symptoms were frequent despite medication use among most patients. For example, among type C patients, 70% took pruritus medications; their mean worst nighttime VAS score was 72.5 mm, 93% had daily or nearly daily itching, and itching was constant in 37%. Among the type C patients who were not taking pruritus medications, 100% cited “nothing works” as the reason, compared with <8.3% of untreated type A patients.
Instrument Validation
VAS and NRS.
We tested both the VAS and NRS scales to determine if dialysis patients would be able to better understand and use scales labeled with tick marks and numbers, as with the NRS, compared with those without such markings, as with the VAS. We found that after we were trained on both instruments, VAS and NRS results correlated highly and in a reproducible manner over time: The R2 ranged from 0.76 to 0.91 for worst day or night itching intensity score at baseline and weeks 4, 8, and 12. The measures of pruritus intensity were positively associated with the self-categorization of UP severity (Table 3). These relationships were maintained over time (data not shown). Mean worst itching intensity was also reproducibly associated with sleep loss using two different measures, the Itch MOS and the sleep question from the BII. Higher mean worst itching intensity was also associated with higher (worse) Skindex-10 and BII total scores, and with a higher Beck Depression Index score (Table 4). Changes in scores of ±20% or greater from baseline VAS were associated with 3- to 12-point changes on the Skindex-10 and BII total scores, with SRMs averaging ≥0.5 or less than −0.5, considered a clinically significant difference for HR-QOL measures in general (Table 5) (21,22).
In part 2 of the study, in which night and day VAS measurements were taken on two adjacent dialysis sessions, 2 days apart, the test-retest reliability (correlation coefficients 0.52 to 0.62) were relatively high, particularly in light of the expected variability of itching from day to day, supporting correlations test-retest reliability of the scale.
Skindex-10 and Brief Itching Inventory.
Despite the different recall period in the Skindex-10 (1 week) and BII (24 hours), the agreement and correlation between these two measures that evaluate similar phenomena was high, showing convergent validity. Moreover, the relationships between the Skindex-10 and BII were consistent over time: The R2 values at visits when these measurements were taken (the baseline and weeks 4, 8, and 12 visits) ranged from 0.67 to 0.74 (data not shown).
We found that both the Skindex-10 and BII were able to predict phenomenologically similar aspects of pruritus measured with different instruments. For example, the disease domain questions of the Skindex-10 and total Skindex-10 score were both associated with pruritus intensity as measured by the VAS at baseline and across multiple time points, as well as Self-Assessed Disease Severity (e.g., A, B, or C categorization) (Tables 3 and 4).
Similarly, the three mood/emotional distress questions from the Skindex-10 and the BII predicted self-assessed disease severity. Results of these questions also mimicked the pattern of responses on the Beck Depression Index, previously validated for use in patients with ESRD (19) (Tables 3 and 4). Additionally, both the Skindex mood and social functioning domains were associated with established medical diagnoses of depression, as derived from medical records. Diagnoses of depression among types A, B, and C were 18, 42, and 71%, respectively (P < 0.05); their composite scores on the Skindex mood domain were 5.2, 8.6, and 12.6, respectively (P < 0.0001) and their composite scores on the Skindex social functioning domain were 4.0, 6.6, and 12.9 (P < 0.0001), respectively. Use of medications specifically for treatment of depression (excluding antidepressants given for indications other than depression, e.g., neuropathic pain) was 30 to 200% greater in type C patients compared with those with lesser pruritus disease severity at various time points in the study. Interference by itching on mood and social functioning reported on the BII followed a similar pattern (Tables 3 and 4).
Itch MOS and Sleep Question from Brief Itching Inventory.
Sleep disruption due to itching, assessed both by the Itch MOS composite score and the sleep interference question from the BII, were significantly associated with the Self-Assessed Disease Severity and VAS scores (Tables 3 and 4). Type C patients and those with a baseline VAS >70 mm estimated losing a mean of 1.9 and 2.2 hours of sleep, respectively, in the previous night because of itching (Tables 3 and 4).
Discussion
We conducted the first longitudinal natural history study of uremic pruritus. Results of a large, multinational cross-sectional study indicated that approximately 42% of patients with ESRD on hemodialysis suffer from moderate or extreme pruritus (1). Corroborating and extending these data, we have documented the unremitting, refractory nature of UP and the reported persistence of this condition over years. We found that both the intensity of the pruritus and Self-Assessed Disease Severity were strongly associated with diminished HR-QOL in multiple domains, including mood, sleep, and social relations. There was a high degree of concordance across multiple measures and instruments that were maintained over time. Although confounding of HR-QOL results by the influence of comorbid conditions cannot be excluded, the Skindex-10, BII, and Itch MOS asked specifically about the effects of itching on various domains, establishing patient-assessed causality. Spatial distribution of pruritus indicated the involvement of large, nondermatomal areas with striking mirror symmetry. Expanding on the work of prior studies (16,20,21), we have reported for the first time that distribution of pruritus can change markedly over time in individuals, and yet bilateral symmetry is maintained. These findings point to a prominent central neurogenic component to UP which deserves further exploration.
The VAS, Skindex-10, BII, Itch MOS, and Self-Assessed Disease Severity used in this study proved to be reliable and valid patient-reported outcome measures for UP. The Self-Assessed Disease Severity instrument in which study patients identified themselves as “most like” patient type A, B, or C was highly associated with all measures of HR-QOL and pruritus intensity. The Self-Assessed Disease Severity measurement is a simple way to operationalize patients' perceptions of their functional limitations in key domains. Because it so easy to understand and can be administered in <1 minute, it is a useful clinical tool for identifying dialysis patients whose UP is adversely affecting their quality of life. For patients undergoing treatment, either the VAS or numerical rating scale can be used to quantify pruritus intensity reliably and chart changes in intensity.
The potential limitations of this study include an over-representation of African Americans (68%) relative to their actual proportions in the dialysis population (23). Additionally, although the study was conducted at 13 dialysis units, the majority of the units were in the southeastern United States and therefore not geographically representative of the entire country. Although old age may be associated with pruritus, to be able to generalize the study to the real world dialysis population, elderly patients were included in the study.
It is well known that dialysis patients have a poor quality of life, in part because of a high symptom burden (22). The significant effect of uremic pruritus on sleep, mood, and social functioning demands our attention and underscores the importance of efforts to improve treatment for this serious complication of ESRD. With the instruments described, we hope to facilitate clinical evaluation, management, clinical investigation, and development of effective remedies.
Disclosures
None.
References
- 1.Pisoni RL, Wikstrom B, Elder SJ, Akizawa T, Asano Y, Keen ML, Saran R, Mendelssohn DC, Young EW, Port FK: Pruritus in haemodialysis patients: International results from the Dialysis Outcomes and Practice Patterns Study (DOPPS). Nephrol Dial Transplant 21: 3495–3505, 2006 [DOI] [PubMed] [Google Scholar]
- 2.Ikoma A, Rukwied R, Stander S, Steinhoff M, Miyachi Y, Schmelz M: Neurophysiology of pruritus: Interaction of itch and pain. Arch Dermatol 139: 1475–1478, 2003 [DOI] [PubMed] [Google Scholar]
- 3.Bhaduri S, Mathur V, Fellmann J, Rosen D: Uremic pruritus patients: A national survey of sleep and mood disruptions [Abstract]. Am J Kidney Dis 49: B31, 2007 [Google Scholar]
- 4.Dar NR, Akhter A: Clinical characteristics of uremic pruritus in patients undergoing haemodialysis. J Coll Physicians Surg Pak 16: 94–96, 2006 [PubMed] [Google Scholar]
- 5.Szepietowski JC, Szepietowski T, Reich A: Efficacy and tolerance of the cream containing structured physiological lipids with endocannabinoids in the treatment of uremic pruritus: A preliminary study. Acta Dermatovenerol Croat 13: 97–103, 2005 [PubMed] [Google Scholar]
- 6.Chen YC, Chiu WT, Wu MS: Therapeutic effect of topical gamma-linolenic acid on refractory uremic pruritus. Am J Kidney Dis 48: 69–76, 2006 [DOI] [PubMed] [Google Scholar]
- 7.Manenti L, Vaglio A, Costantino E, Danisi D, Oliva B, Pini S, Prati E, Testori A: Gabapentin in the treatment of uremic itch: An index case and a pilot evaluation. J Nephrol 18: 86–91, 2005 [PubMed] [Google Scholar]
- 8.Okada K, Matsumoto K: Effect of skin care with an emollient containing a high water content on mild uremic pruritus. Ther Apher Dial 8: 419–422, 2004 [DOI] [PubMed] [Google Scholar]
- 9.Legroux-Crespel E, Cledes J, Misery L: A comparative study on the effects of naltrexone and loratadine on uremic pruritus. Dermatology 208: 326–330, 2004 [DOI] [PubMed] [Google Scholar]
- 10.Pauli-Magnus C, Mikus G, Alscher DM, Kirschner T, Nagel W, Gugeler N, Risler T, Berger ED, Kuhlmann U, Mettang T: Naltrexone does not relieve uremic pruritus: Results of a randomized, double-blind, placebo-controlled crossover study. J Am Soc Nephrol 11: 514–519, 2000 [DOI] [PubMed] [Google Scholar]
- 11.Ashmore SD, Jones CH, Newstead CG, Daly MJ, Chrystyn H: Ondansetron therapy for uremic pruritus in hemodialysis patients. Am J Kidney Dis 35: 827–831, 2000 [DOI] [PubMed] [Google Scholar]
- 12.Duque MI, Yosipovitch G, Fleischer AB, Jr., Willard J, Freedman BI: Lack of efficacy of tacrolimus ointment 0.1% for treatment of hemodialysis-related pruritus: a randomized, double-blind, vehicle-controlled study. J Am Acad Dermatol 52: 519–521, 2005 [DOI] [PubMed] [Google Scholar]
- 13.Bennett MI, Simpson KH: Gabapentin in the treatment of neuropathic pain. Palliat Med 18: 5–11, 2004 [DOI] [PubMed] [Google Scholar]
- 14.Breivik H, Collett B, Ventafridda V, Cohen R, Gallacher D: Survey of chronic pain in Europe: Prevalence, impact on daily life, and treatment. Eur J Pain 10: 287–333, 2006 [DOI] [PubMed] [Google Scholar]
- 15.McReynolds TM, Sheridan BJ: Intramuscular ketorolac versus osteopathic manipulative treatment in the management of acute neck pain in the emergency department: a randomized clinical trial. J Am Osteopath Assoc 105: 57–68, 2005 [PubMed] [Google Scholar]
- 16.Yosipovitch G, Zucker I, Boner G, Gafter U, Shapira Y, David M: A questionnaire for the assessment of pruritus: Validation in uremic patients. Acta Derm Venereol 81: 108–111, 2001 [DOI] [PubMed] [Google Scholar]
- 17.Ross JR, Goller K, Hardy J, Riley J, Broadley K, A'Hern R, Williams J: Gabapentin is effective in the treatment of cancer-related neuropathic pain: A prospective, open-label study. J Palliat Med 8: 1118–1126, 2005 [DOI] [PubMed] [Google Scholar]
- 18.Hays RD, Stewart AL: Sleep measures. In: Measuring Functioning and Well-Being: The Medical Outcomes Study Approach, edited by Stewart AL, Ware JE.Durham,NC, Duke University Press, 1992, pp 235–259 [Google Scholar]
- 19.Watnick S, Wang PL, Demadura T, Ganzini L: Validation of 2 depression screening tools in dialysis patients. Am J Kidney Dis 46: 919–924, 2005 [DOI] [PubMed] [Google Scholar]
- 20.Duque MI, Thevarajah S, Chan YH, Tuttle AB, Freedman BI, Yosipovitch G: Uremic pruritus is associated with higher kt/V and serum calcium concentration. Clin Nephrol 66: 184–191, 2006 [DOI] [PubMed] [Google Scholar]
- 21.Zucker I, Yosipovitch G, David M, Gafter U, Boner G: Prevalence and characterization of uremic pruritus in patients undergoing hemodialysis: Uremic pruritus is still a major problem for patients with end-stage renal disease. J Am Acad Dermatol 49: 842–846, 2003 [DOI] [PubMed] [Google Scholar]
- 22.Weisbord SD, Fried LF, Arnold RM, Fine MJ, Levenson DJ, Peterson RA, Switzer GE: Prevalence, severity, and importance of physical and emotional symptoms in chronic hemodialysis patients. J Am Soc Nephrol 16: 2487–2494, 2005 [DOI] [PubMed] [Google Scholar]


