Abstract
Objective
The purpose of this investigation was to compare the ability of young adults and older adults to integrate auditory and visual sentence materials under conditions of good and poor signal clarity. The Principle of Inverse Effectiveness (PoIE), which characterizes many neuronal and behavioral phenomena related to multisensory integration, asserts that as unimodal performance declines, integration is enhanced. Thus, the PoIE predicts that both young and older adults will show enhanced integration of auditory and visual speech stimuli when these stimuli are degraded. More importantly, because older adults' unimodal speech recognition skills decline in both the auditory and visual domains, the PoIE predicts that older adults will show enhanced integration during audiovisual speech recognition relative to young adults. The present study provides a test of these predictions.
Design
Fifty-three young and 53 older adults with normal hearing completed the closed-set Build-A-Sentence (BAS) Test and the CUNY Sentence Test in a total of eight conditions, four unimodal and four audiovisual. In the unimodal conditions, stimuli were either auditory or visual and either easier or harder to perceive; the audiovisual conditions were formed from all the combinations of the unimodal signals. The hard visual signals were created by degrading video contrast; the hard auditory signals were created by decreasing the signal-to-noise ratio. Scores from the unimodal and bimodal conditions were used to compute auditory enhancement and integration enhancement measures.
Results
Contrary to the PoIE, neither the auditory enhancement nor integration enhancement measures increased when signal clarity in the auditory or visual channel of audiovisual speech stimuli was decreased, nor was either measure higher for older adults than for young adults. In audiovisual conditions with easy visual stimuli, the integration enhancement measure for older adults was equivalent to that for young adults. In conditions with hard visual stimuli, however, integration enhancement for older adults was significantly lower than for young adults.
Conclusions
The present findings do not support extension of the PoIE to audiovisual speech recognition. Our results are not consistent with either the prediction that integration would be enhanced under conditions of poor signal clarity or the prediction that older adults would show enhanced integration, relative to young adults. Although there is considerable controversy with regard to the best way to measure audiovisual integration, the fact that two of the most prominent measures, auditory enhancement and integration enhancement, both yielded results inconsistent with the PoIE, strongly suggests that the integration of audiovisual speech stimuli differs in some fundamental way from the integration of other bimodal stimuli. The results also suggest aging does not impair integration enhancement when the visual speech signal has good clarity, but may affect it when the visual speech signal has poor clarity.
Introduction
As they get older, adults experience declines in their abilities to recognize both acoustically and visually presented speech. In addition to increases in auditory thresholds (e.g. Mills et al. 2006), adults over the age of 60 years may experience declines in monosyllabic word recognition of 6 to 13% per decade (Cheesman 1997), and speech recognition difficulties may become increasingly exacerbated by the presence of background noise (Pederson et al. 1991; Plath 1991). Vision-only speech recognition may also diminish (Farrimond 1959; Honnell et al. 1991). For example, Sommers, Tye-Murray, and Spehar (2005) reported that older adults (ages 65 yrs and older) were significantly poorer at lipreading consonant, word, and sentence stimuli than young adults (ages 18-24 yrs).
Despite convincing documentation of the decline in unimodal speech recognition in older adults, there are remarkably scant data about how aging affects individuals' ability to integrate what they hear with what they see. Most adults, younger and older, recognize more speech when they can both see and hear a talker compared with either listening or watching alone (e.g. Grant et al. 1998; Sumby and Pollack 1954), but young adults on average recognize more speech in an audiovisual condition than do older adults (e.g. Sommers et al. 2005). This age difference in audiovisual performance may relate to differences in unimodal performance (i.e., young adults on average can recognize more speech in a vision-only condition than can older adults, and this in turn may bolster young adults' audiovisual performance) and/or it may relate to differences in abilities to combine or integrate the visual and auditory speech signals. Only a few studies have considered the extent to which age-related differences in audiovisual speech recognition relate to age-related differences in unimodal auditory and visual speech recognition and to what extent they relate to age-related differences in multisensory integration abilities.
The primary purpose of this investigation was to determine whether older adults are more or less able to integrate auditory and visual speech information than young adults, or whether the two groups exhibit comparable auditory enhancement and integration enhancement. Auditory enhancement is the benefit obtained from adding an auditory speech signal to the vision-only speech signal and is often expressed as the percent of improvement available (e.g. Sumby and Pollack 1954). Integration enhancement measures the extent to which recognition of audiovisual stimuli exceeds what would be predicted based on the probabilities of recognizing the component unimodal signals separately (Fletcher 1953; Massaro 1987).
The Principle of Inverse Effectiveness (PoIE), which characterizes many neuronal and behavioral phenomena related to multisensory integration, has been called “one of the best-agreed-upon observations about multisensory integrations” (Lakatos et al. 2007 p. 282). The PoIE asserts that as unimodal performance declines, integration is enhanced (Stein and Meredith 1993). Thus, the PoIE predicts that individuals will show enhanced integration of auditory and visual speech stimuli when these stimuli are degraded. More importantly, because older adults' unimodal speech recognition skills decline in both the auditory and visual domains, the PoIE predicts that older adults will show enhanced integration during audiovisual speech recognition relative to young adults.
The results of a previous study by Helfer (1998) are consistent with this prediction of the PoIE. In the Helfer study, fifteen older adults were asked to recognize nonsense sentences spoken with conversational and clear speech (see Picheny et al. 1986 for a discussion of clear speech). Consistent with the PoIE, age was negatively correlated with visual enhancement for conversational speech, although not for clear speech. (Visual enhancement is similar to auditory enhancement, but indexes the degree to which an auditory signal enhances an individual's visual-only performance.) However, the small sample size and the absence of information about the performance of young adults make any conclusions tentative.
The results from two other investigations of audiovisual speech perception are contrary to the PoIE's prediction regarding age differences and suggest that older and young adults may have similar abilities to integrate auditory and visual speech signals. Cienkowski and Carney (2002) compared young and older persons' susceptibility to the McGurk effect (McGurk and MacDonald 1976) and found that the two groups were equally susceptible. However, because the investigators did not include measures of unimodal performance, it is unclear whether this was because the two groups had equivalent auditory-only and visual-only speech recognition abilities. Sommers et al. (2005) studied auditory enhancement and visual enhancement in young and older adults. Because Massaro and Cohen (2000) have argued that the shortcoming of both auditory enhancement and visual enhancement as indices of integration is that the measures are influenced by unimodal speech recognition performance as well as by integration ability, Sommers et al. attempted to control auditory-only performance by individually adjusting the signal-to-noise ratio (SNR) so that all participants achieved the same percent words correct in an auditory-only condition. No age differences in auditory enhancement or visual enhancement were observed, but Sommers et al. recommended that future research determine whether age equivalence in enhancement holds for adverse listening conditions and other conditions where the need for audiovisual integration is great.
The primary goal of the present study was to compare the ability of young and older adults to benefit from audiovisual speech relative to unimodal speech. The difficulty in such comparisons is that young and older adults typically differ in their ability to perceive unimodal stimuli. Thus, what is needed is an experimental or a measurement approach, or some combination of the two, that adequately deals with the problems inherent in measuring benefits relative to different baselines (Cronbach and Furby 1970). For example, increasing the loudness of auditory speech stimuli presented in conjunction with visual stimuli might benefit those with higher auditory thresholds more than those with lower thresholds, but one would not say that those with higher thresholds are better at integrating auditory and visual stimuli.
With respect to auditory perception, the solution is rather straightforward: One can adjust SNR on an individual basis so that the speech test stimuli are equally perceptible to all individuals, regardless of age or auditory thresholds. With respect to visual perception, the problem is more difficult because older adults' vision-only lip-reading abilities are much poorer than those of young adults (Sommers et al. 2005). Although altering visual stimulus quality can produce gross differences in lipreading performance, fine-tuning stimulus quality to equate individual performance, as seen with auditory stimuli, is far more difficult with visual stimuli.
Accordingly, we have adopted a mixed approach, part experimental manipulation and part measurement-based, to the problem of different baselines. In the auditory domain, stimulus intensity was individually adjusted to SNR values that were intended to produce 40% correct word identification (good auditory condition) and 25% correct word identification (poor auditory condition). In the visual domain, we used two different measures of integration that attempt to control for different unimodal baselines in different ways. The auditory enhancement measure assesses the difference between audiovisual performance and unimodal auditory performance relative to the maximum improvement possible given one's unimodal visual baseline. The integration enhancement measure assesses audiovisual performance relative to what would be predicted based on simple summation of the probabilities of correct unimodal perception, where such predictions are calculated based on the fundamental rules for probabilities.
Currently, considerable controversy exists with regard to the proper way to measure the benefits of integrating stimulus information from different modalities (e.g. Ross et al. 2007). By using two different measurement approaches, we seek to address not only our major concern, age differences in audiovisual integration, but also, at least in a preliminary fashion, the problem of how best to assess such differences.
Methods
Participants
Fifty-three young adults (mean age = 23.0 yrs, SD = 2.1, range = 18.6 – 27.6 yrs) and 53 older adults (mean age = 73.7 yrs, SD = 5.9, range = 65.8 – 85.1 yrs) participated in the investigation. Volunteers were obtained through databases maintained by the Aging and Development Program at Washington University and the Volunteers for Health at Washington University School of Medicine. All participants were screened to have at least 20/40 visual acuity using the Snellen eye chart and normal contrast sensitivity of 1.8 or better using the Pelli-Robson Contrast Sensitivity Chart (Pelli et al. 1988). They also were screened to exclude those with a history of central nervous system problems including stroke and head injury. Participants were all community-dwelling residents and spoke English as their first language. They received $10/hr for their participation.
Participants' hearing acuity was determined by averaging the pure tone thresholds for 0.5, 1.0, and 2.0 KHz. The pure-tone average (PTA) for the better ear was used as the indicator of hearing acuity because all testing was conducted using sound-field presentation. All participants had clinically normal hearing (Roeser et al. 2000), although the young and older groups did differ significantly (mean young PTA for the better ear = 5.2 dB HL, mean older = 14.8 dB HL, t (104) = 8.69, p < .001). Participants' speech discrimination in quiet was assessed using percent words correct with the W-22 word lists presented at 35 dB above their PTA. The two groups did not differ in speech discrimination ability (mean young = 95.1 %, mean older 94.5 %, t (104) = 0.48, ns). Participants with inter-octave slopes of more than 15 dB or inter-octave differences of more than 10 dB were screened out.
Test Stimuli
Test stimuli included the Build-A-Sentence (BAS) Test and the CUNY Sentence test. The BAS Test stimuli consist of audiovisual digital recordings of the head and shoulders of a female talker speaking with a general American accent. The BAS words are taken from a closed set of 36 animate nouns (e.g. bear, team, wife, boys, and dog; for a complete list, see Tye-Murray et al. 2008). The words were selected quasi-randomly to replace the blanks in the following four sentence structures: The _ and the _watched the _ and the _, The _ watched the _ and the _, The _ and the _ watched the _, and finally The _ watched the _. Participants had to select the appropriate words to fill in the blanks from the set of 36 possible words, which appeared on the computer monitor touchscreen. For the current study, 36 lists of unique sentences were generated and then digitally recorded. Randomization was constrained to ensure that each BAS list consisted of three sentences from each structure type (12 sentences all together) and used all 36 words.
The talker sat in front of a neutral background and repeated the sentences into the camera as they appeared on a teleprompter. Recordings were done with a Cannon Elura 85 digital video camera connected to a Dell Precision PC. Digital capture and editing was done in Adobe Premiere Elements. The audio portion of the stimuli was leveled using Adobe Audition to be sure that each sentence had the same average root mean square amplitude. A cue appeared before each sentence asking the participant to ‘Listen’ or ‘Watch’ or both, depending on the condition of the next sentence.
The BAS Test is a good test for assessing younger and older adults' abilities to integrate speech signals for at least three reasons. First, the BAS Test is a closed-set matrix test designed to avoid the floor and ceiling effects sometimes associated with other audiovisual sentence tests (e.g. Sommers et al. 2005). Second, the BAS Test allows the same words to be used to assess performance in varying conditions, such as in conditions of good and poor signal clarity, and in conditions where the stimuli are presented either auditorally, visually, or audiovisually (see Tyler 1993 for a discussion of test lists and assessing auditory enhancement and visual enhancement). Third and finally, the target words are not predictable from the other words in the test sentences, including the other target words; this may be important because some data suggest that older adults may be able to exploit semantic context to overcome unfavorable listening and viewing conditions (e.g. Tye-Murray et al. 2008).
Despite these strengths, it is possible that the BAS Test may not be the ideal test for the present purposes if, as Ross et al. (2007) have suggested, delimited sets of word stimuli lead to artificially high improvements when the visual signal is added to the auditory signal. Therefore, in addition to completing the closed-set BAS, the participants also completed lists of the CUNY Sentence Test (Boothroyd et al. 1985) in all of the test conditions. A different list was administered in each condition. The CUNY Sentence Test consists of lists of 12 unrelated sentences spoken by a female with general American dialect. Lists have a total of about 100 words. Words had to be repeated verbatim in order to be scored correct. A shortcoming of open-set sentence tests is that they often result in floor performance in a vision-only condition, which makes assessment of enhancement and integration problematic.
All auditory stimuli included 6-talker babble presented at approximately 62 dB SPL, and the signal was increased or decreased in amplitude to create the various SNRs. For each presentation the audio signal was routed first through a programmable real-time processor (Tucker-Davis Technologies RP2) where the SNR was set, and then through a calibrated audiometer and amplifier before being presented to the participant over loudspeakers. The test system was calibrated via the voltage-unit meter in the audiometer before every test session.
Procedures
Participants were seated in a sound-treated booth and instructed to repeat verbatim each sentence presented to them. Visual portions of the test stimuli were presented via a 17-inch Touchsystems monitor (ELO ETC-170C) approximately 0.5 meters from the participant. Audio was presented over two loudspeakers oriented ± 45 degrees azimuth in front of the participant. The experimenter, located outside of the booth, entered the participant's responses into the testing computer. Testing was conducted as part of a larger test battery and was always completed over two sessions. The first BAS Test session always included six practice sentences in each of the eight test conditions and a 36-sentence pre-test to determine the appropriate SNR to be used, as well as a subset of the experimental conditions. Similar procedures were used for the CUNY Sentence Test. Testing on the larger battery was limited to 2.5 hours maximum. As a result, the number of experimental conditions completed in the first session varied slightly across participants depending on time constraints, and the remainder of the BAS Test and CUNY Sentence Test conditions were completed in the second session.
There were eight different experimental conditions: four unimodal conditions and four audiovisual conditions. The unimodal auditory presentations included an easier auditory condition (EA) and a harder auditory condition (HA). The SNRs used in these two conditions were determined individually for each participant based on a pre-test in which BAS Test stimuli were presented at varying SNRs in order to generate a psychophysical function (accuracy as a function of SNR). Based on this function, we estimated the SNRs that would produce 40% and 25% accuracy, and these SNRs were used for the EA and HA conditions, respectively. The stimuli in the two unimodal visual conditions, easy visual (EV) and hard visual (HV), were the same for each participant. The EV condition was an unfiltered video signal of the talker, whereas the HV condition was the same video with 98% of the contrast removed. Adobe Premiere was used to create the low contrast HV condition, which resembled a ghost image of the talker. The same procedures were used to develop EV and HV stimuli for the CUNY Sentence Test.
The audiovisual conditions used all combinations of the unimodal stimuli to create EA/EV, HA/EV, EA/HV, and HA/HV conditions. For example, the HA/EV condition was presented with the same SNR expected to elicit 25% performance in the unimodal HA condition. Two randomly selected BAS lists (24 sentences) were presented in each condition and one CUNY list. The order in which experimental conditions were presented was randomly determined for each participant by sampling without replacement.
Analyses
Performance was assessed as the percentage of words correct in each of the unimodal and multimodal conditions. Two measures of integration ability, auditory enhancement and integration enhancement, were derived from the proportion of correct responses obtained in the unimodal and multimodal conditions.
Auditory enhancement represents the amount of benefit afforded by the addition of the auditory channel of speech, normalized for the amount of possible improvement (Sommers et al. 2005; Sumby and Pollack, 1954): Auditory enhancement = (pAV – pV) / (1 - pV), where pAV is the proportion of words correctly identified in an audiovisual condition and pV is the proportion of words correctly identified in the corresponding vision-only condition. The auditory enhancement calculation adjusts for differences in lipreading ability by subtracting pV from audiovisual performance and normalizing for the amount of potential improvement beyond vision-only scores: (1 – pV). Thus, when individual and age differences in auditory-only ability are experimentally controlled, as in the present study, auditory enhancement indexes integration ability because it normalizes for differences in vision-only ability.
It should be noted, however, that although it may represent a reasonable control for differences in the amount of possible improvement under some circumstances (e.g. when ceiling effects are a concern), nevertheless the normalization involved in calculating auditory enhancement biases against finding results consistent with the PoIE. This is because normalization is accomplished by taking the improvement resulting from adding the auditory signal and dividing it by the proportion of errors in the vision only condition. Thus, among those with equivalent improvement, auditory enhancement will be lower for those who made more lipreading errors, which is exactly the opposite of what is predicted by the PoIE.
Integration enhancement scores represent a different approach to indexing integration (Fletcher 1953; Massaro 1987). The integration enhancement measure assesses audiovisual performance relative to what would be predicted based on simple summation of the probabilities of correct unimodal perception, where such predictions are calculated based on the fundamental addition rule for probabilities: Integration enhancement = AVobserved – AVpredicted, where AVpredicted = 1-(1 – pA) * (1 – pV). Note that the predicted probability of correctly identifying an AV signal is calculated by first predicting the probability of failing to identify both its auditory and its visual components, (1 – pA) * (1 – pV), based on performance in the unimodal conditions, and then subtracting the probability of making both errors from 1.0 to obtain the probability of being correct.
Results
Analyses
Statistical analyses of percentage correct scores were conducted using rationalized arcsine transformed scores that better satisfy the assumptions of parametric statistical tests (Studebaker, 1985). However, all values reported in the text and graphs represent the non-transformed data. Because it is possible to have negative values for the auditory enhancement and integration enhancement measures, transformed scores were not computed. Further, unless otherwise stated, statistical comparisons are based on data that have met the assumptions of sphericity and homogeneity of variance.
An additional concern in assessing the PoIE was whether the current design had sufficient power to detect differences between the easy and hard conditions. Power analyses with the current sample size and an alpha level of .05 (one-sided) indicated that power to detect differences at least as large as those observed in the current study exceeded .95. Therefore, any failures to find differences between easy and hard conditions are not likely to be the result of insufficient statistical power.
BAS Test Results
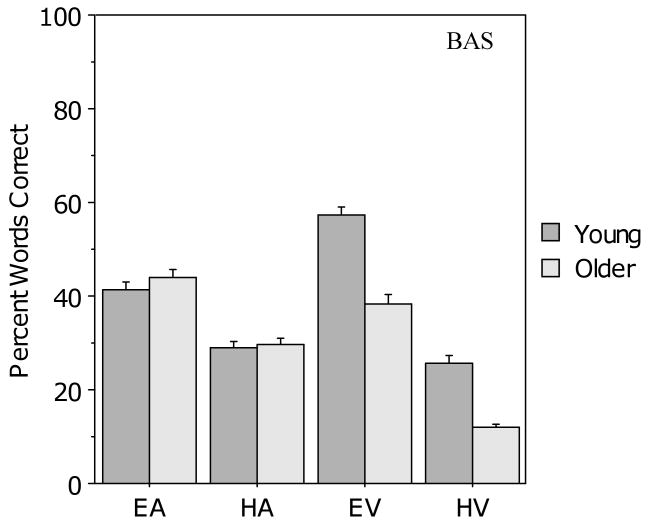
Figure 1 presents the results for the young and older groups in the four unimodal presentation conditions for the BAS Test. On average, both groups correctly identified 42% of the words in the EA condition (with good auditory clarity) and 29% of the words in the HA condition (with poor auditory clarity). Both auditory-only scores were slightly higher than the target values of 40 and 25% respectively (EA, t (105) = 2.6, p = .01; HA t (105) = 4.8, p < .0001). More relevant to the current study, however, the procedure for equating auditory-only performance levels across age groups and across difficulty levels appears to have been effective. A 2 (age: young vs. older) × 2 (auditory clarity: easy vs. hard) analysis of variance (ANOVA) revealed a main effect of clarity (F (1, 104) = 251.1, p < .001), but no effect of age (F (1, 104) = 1.1, p > .10) and no age × clarity interaction.
Figure 1.
Mean percentage correct for the young and older participants in the four unimodal conditions for the BAS Test. Error bars indicate the standard error of the mean.
The procedure for degrading the clarity of the visual signal was also effective, as indicated by the fact that performance in the EV condition (with good visual clarity) was better than performance in the HV condition (with poor visual clarity). Although age differences are apparent in both unimodal visual conditions, young adult mean accuracy was well below ceiling in the EV condition and older adult mean accuracy was above floor in the HV condition. A 2 (age) × 2 (visual clarity: easy vs. hard) ANOVA revealed main effects of both age (F (1, 104) = 73.9, p < .001), and clarity (F (1, 104) = 644.5, p < .001) but no interaction. Levene's test for equality of variance indicated a difference between the young and older groups in the HV condition (SD = 7.5 and 12.5 respectively). Therefore, an independent samples t-test with equal variance not assumed, and with adjusted degrees of freedom, was conducted, revealing a significant difference between the two groups in the HV condition (t (85) = 8.1, p < .001).
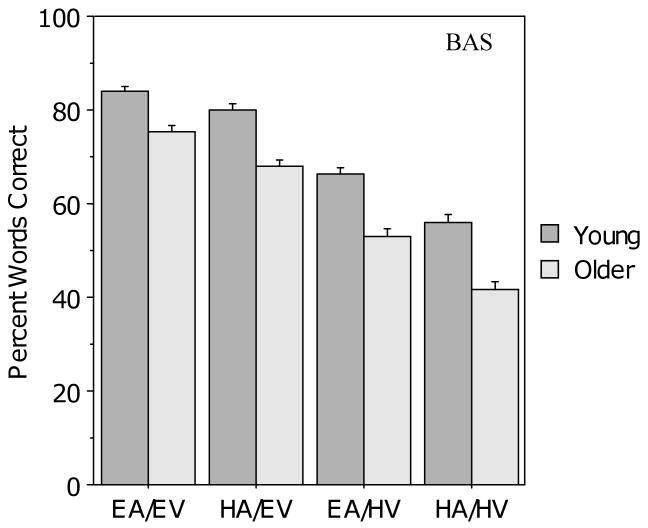
Figure 2 presents the results for the young and older groups in the four audiovisual conditions. The young adults scored higher than the older adults, but the same overall pattern of performance was observed in both groups. As may be seen, performance in the two audiovisual conditions with good auditory clarity (EA/EV and EA/HV) was better than performance in the two conditions with poor auditory clarity (HA/EV and HA/HV), and similarly, performance in the two conditions with good visual clarity (EA/EV and HA/EV) was better than performance in the two conditions with poor visual clarity (EA/HV and HA/HV). To confirm these observations, a 2 (age) × 2 (auditory clarity) × 2 (visual clarity) ANOVA was conducted, revealing main effects of age (F (1, 104) = 50.0, p < .001), auditory clarity (F (1, 104) = 222.9, p < .001), and visual clarity (F (1, 104) = 670.1, p < .001), but no interactions with age.
Figure 2.
Mean percentage correct for the young and older participants in the four audiovisual conditions for the BAS Test. Error bars indicate the standard error of the mean.
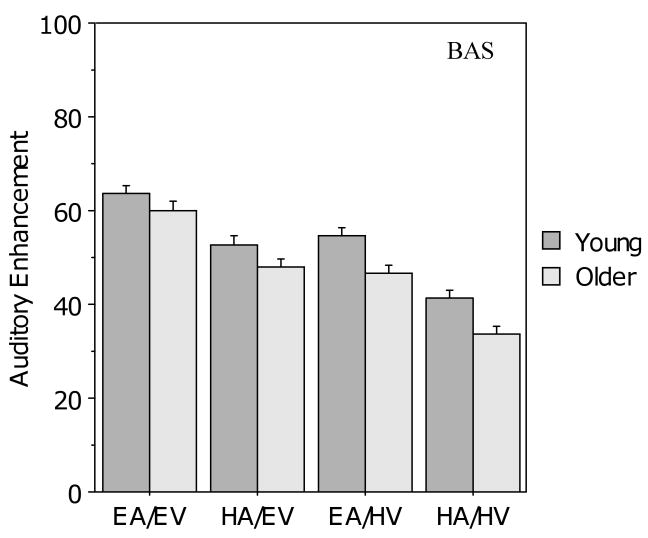
Figure 3 shows first, that the young participants had higher auditory enhancement than the older participants in all four BAS Test conditions, and second, that auditory enhancement decreased for both groups when either auditory or visual clarity decreased. For both age groups, auditory enhancement was higher for the two conditions with good visual clarity and lower for the two conditions with poor visual clarity; likewise, auditory enhancement was higher for the two conditions with good auditory clarity and lower for the two conditions with poor auditory clarity. A 2 (age) × 2 (auditory clarity) × 2 (visual clarity) ANOVA indicated main effects of age (F (1, 104) = 9.37, p < .01), auditory clarity (F (1, 104) = 204.8, p < .001), and visual clarity (F (1,104) = 99.9, p < .001), but no significant interactions. Importantly, all three main effects reflected differences in the direction opposite to that predicted by the PoIE: auditory enhancement was higher for young adults than for older adults, and auditory enhancement was higher in conditions with good signal clarity (either visual or auditory) compared to those with poor signal clarity.
Figure 3.
Mean auditory enhancement (AE) for the young and older participants in the four audiovisual conditions for the BAS Test. Error bars indicate the standard error of the mean.
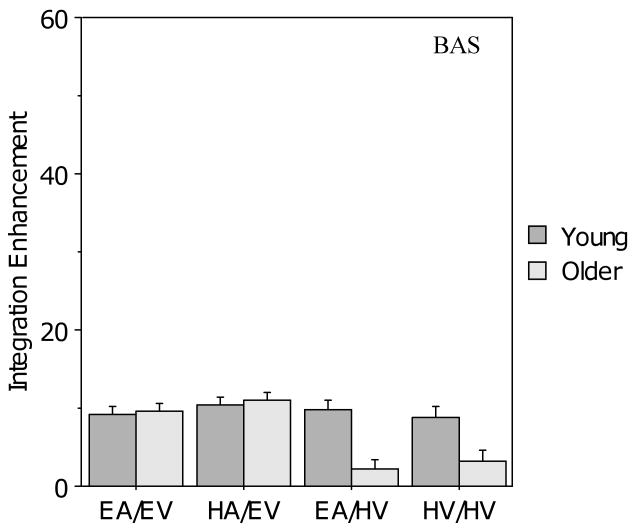
As noted in the Methods section, auditory enhancement may be biased against finding results consistent with the PoIE, and therefore the data were also analyzed using the integration enhancement measure. Figure 4 presents the results of the integration enhancement analysis for the BAS Test. When the level of visual clarity was good, integration enhancement for the two age groups appeared to be comparable, whereas it appeared to be worse for the older group relative to the young group when visual clarity was poor. This was confirmed by a 2 (age) × 2 (auditory clarity) × 2 (visual clarity) ANOVA, which revealed main effects of age (F (1, 104) = 8.95, p < .01) and visual clarity (F (1, 104) = 20.6, p < .001), with differences in the opposite direction to that predicted by the PoIE, but no main effect for auditory clarity (F (1, 104) < 1.0). There was also a two-way interaction between visual clarity and age (F (1,104) = 16.3, p < .001), but no other two-way interactions and no three-way interaction. Bonferroni-corrected pair-wise comparisons indicated that the older group showed significantly less integration enhancement than the young group in audiovisual conditions with poor visual signal clarity (p < .001), whereas the young group showed no difference in integration enhancement between conditions with good and poor visual clarity (p > .50).
Figure 4.
Mean integration enhancement (IE) for the young and older participants in the four audiovisual conditions for the BAS Test. Error bars indicate the standard error of the mean.
CUNY Sentence Test Results
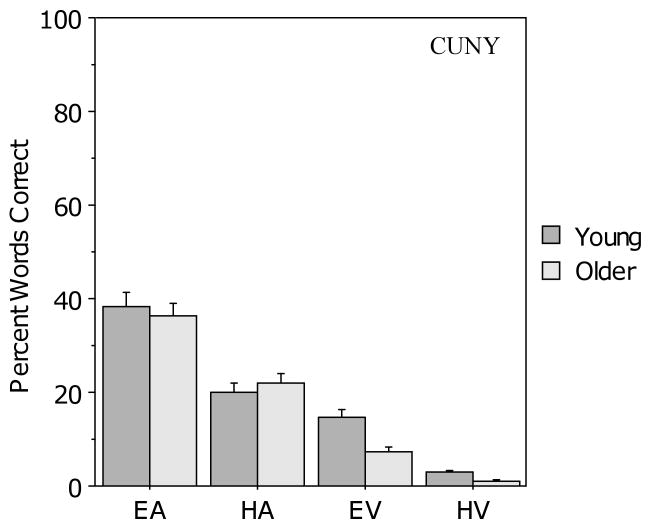
Figure 5 presents the results for the CUNY Sentence Test in the four unimodal conditions. On average, both groups correctly identified 37% of the words in the EA condition and 21% of the words in the HA condition. Auditory-only scores for the HA condition were lower than the target value of 25% (t (105) = 2.9, p < .01). As with the BAS Test, the procedure for equating auditory-only performance levels across age groups and across difficulty levels appears to have been effective. A 2 (age) × 2 (auditory clarity) ANOVA revealed a main effect of level of auditory clarity (F (1, 104) = 84.6, p < .001) but no effect of age (F (1, 104) < 1.0) and no interaction.
Figure 5.
Mean percent correct scores for the young and older participants in the four unimodal conditions for the CUNY Sentence Test. Error bars indicate the standard error of the mean.
Performance in the EV condition was better than that in the HV condition, and there were age differences in both unimodal conditions with the young participants scoring better than the older participants on average. In the HV condition, older participants' performance was at floor (1% words correct). A 2 (age) × 2 (visual clarity) ANOVA revealed main effects of both age (F (1, 104) = 22.2, p < .001) and visual clarity (F (1, 104) = 140.5, p < .001) but no interaction.
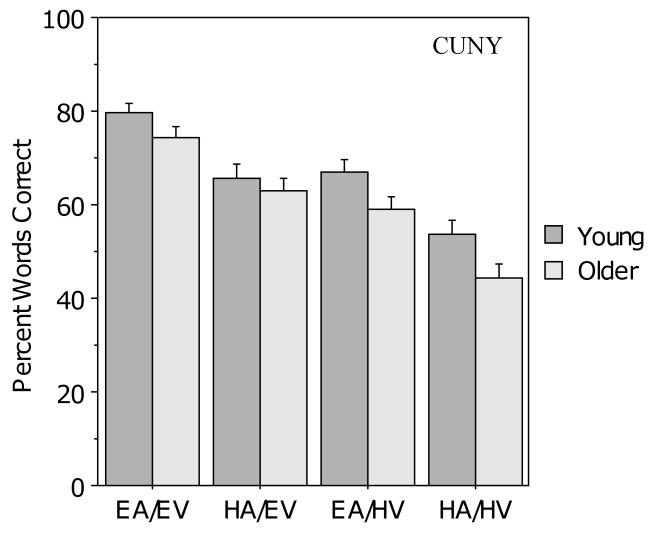
Figure 6 presents the results from the four audiovisual conditions. The young adults scored higher on the CUNY Sentence Test than the older adults, but the same overall pattern of performance was observed in both groups. As clarity of either the auditory or visual signal decreased, performance of both groups declined, and overall, the young group scored higher than the older group. This observation was confirmed by a 2 (age) × 2 (auditory clarity) × 2 (visual clarity) ANOVA that revealed main effects for age (F (1, 104) = 4.7, p = .03), auditory clarity (F (1, 104) = 127.9, p < .001), and visual clarity (F (1, 104) = 123.6, p < .001), but no interactions.
Figure 6.
Mean percent correct scores for the young and older participants in the four audiovisual conditions for the CUNY Sentence Test. Error bars indicate the standard error of the mean.
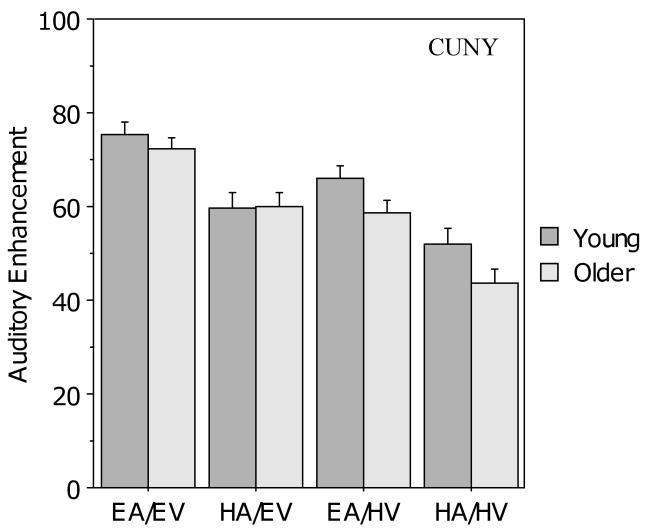
Figure 7 shows that auditory enhancement on the CUNY Sentence Test was better in audiovisual conditions with good auditory clarity as compared to poor auditory clarity, and similarly, auditory enhancement was also better in the conditions with good visual clarity than in those with poor visual clarity. Notably, visual inspection suggests that there was no age difference in the two good visual clarity conditions, but young adults showed greater auditory enhancement than the older adults when visual clarity was poor. A 2 (age) × 2 (auditory clarity) × 2 (visual clarity) ANOVA revealed main effects of auditory clarity (F (1, 104) = 127.9, p < .001) and visual clarity, (F (1,104) = 123.6, p < .001), both in the direction opposite to that predicted by the PoIE, but no main effect of age (F (1, 104) = 1.97, p > .10). The analysis also revealed an interaction between visual clarity and age (F (1, 104) = 4.471, p < .05) but no other interactions. Bonferroni-corrected comparisons indicated that both groups were affected by the level of visual clarity (p < .001 for both groups). Thus, the interaction between age and visual clarity is likely due to the larger effect of clarity observed in the older group compared to the young group.
Figure 7.
Mean auditory enhancement (AE) for the young and older participants in the four audiovisual conditions for the CUNY Sentence Test. Error bars indicate the standard error of the mean.
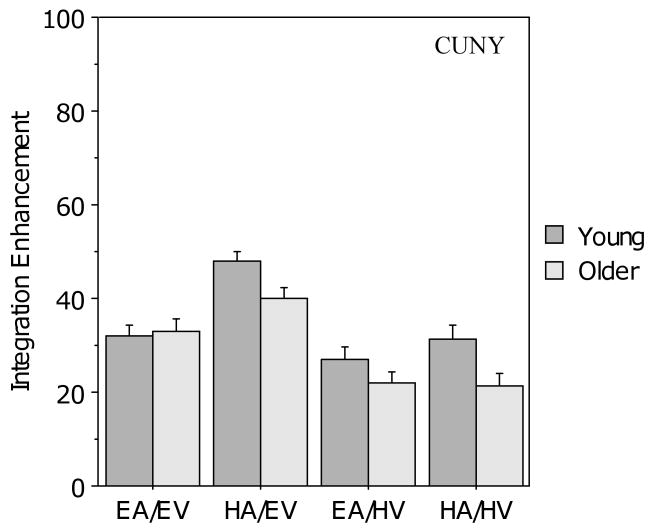
Figure 8 presents the results of the integration enhancement analysis for the CUNY Sentence Test scores. The two groups showed similar integration enhancement in the two audiovisual conditions when visual clarity was good, but the older group showed less integration enhancement than the young group when visual clarity was poor. A 2 (age) × 2 (auditory clarity) × 2 (visual clarity) ANOVA revealed a main effect of visual clarity (F (1, 104) = 26.1, p < .001) but no main effect of age (F (1, 104) = 1.7, p >. 10 or auditory clarity (F (1,104) < 1.0). There was, however, a two-way interaction between age and visual clarity (F (1,104) = 7.79, p < .01), but no other two-way interactions and no three-way interaction. Bonferroni-corrected pair-wise comparisons indicated that the older group had significantly poorer integration enhancement in audiovisual conditions with poor visual signal clarity than in those with good visual clarity (p < .001), opposite to what would be predicted by the PoIE, whereas the young group showed no effect of visual clarity on integration enhancement (p > .10).
Figure 8.
Mean integration enhancement (IE) for the young and older participants in the four audiovisual conditions for the CUNY Sentence Test. Error bars indicate the standard error of the mean.
Discussion
Despite the many differences between the BAS and CUNY Tests, the results on both were generally in agreement with respect to the PoIE. Regardless of which measure was used, auditory enhancement or integration enhancement, there was no evidence of better integration of audiovisual information by older adults relative to young adults on either the BAS Test or the CUNY Sentence Test, or of better integration in conditions with poor signal clarity relative to conditions with good signal clarity on either tests.
Interestingly, on both the BAS and CUNY Tests auditory enhancement was highest in the audiovisual conditions in which both auditory and visual signal clarity were good (EA/EV), lowest in the conditions in which both were poor (HA/HV), and intermediate in the conditions in which one was good and one was poor (HA/EV and EA/HV). This result was observed in both the young and older adult groups, and is exactly the opposite of what is predicted by the PoIE. Further converging evidence comes from a recent study by Ross et al. (2007) in which monosyllabic words were presented as stimuli in an open-set format to adults under the age of 60 years and the SNR of the auditory signal was varied in units of 4 from -20 log units to 0. As was the case in the present investigation, auditory enhancement decreased systematically as SNR decreased, the opposite of what would be expected based on the PoIE.
Even when Ross et al. (2007) used direct difference scores (AV-A) to measure enhancement, the results did not conform to the PoIE prediction of a maximum at the lowest auditory SNR. This result is especially notable because difference scores are biased towards the PoIE prediction because of a ceiling on accuracy measures (as well as having well-known problems with reliability, e.g. Cronbach and Furby 1970). Taken together with Ross et al. (2007), the present findings suggest that the PoIE should be either revised or rejected, at least in reference to audiovisual speech recognition. Although best established in the area of sensory neurophysiology, even there its validity is open to question (Holmes 2009). Thus, the PoIE may not be a general “principle,” but rather an inconsistent phenomenon that emerges in some domains and then only with certain types of stimuli and measures, and under specific stimulus conditions.
The present findings also bear on the controversy as to whether some individuals might be less-efficient integrators than others (e.g. Grant 2002) or whether all individuals integrate auditory and visual speech signals with comparable levels of effectiveness (e.g. Massaro and Cohen 2000). The present findings with respect to young and older adults provide some support for both viewpoints. When the visual signal was good, for example, the young and older groups demonstrated similar levels of integration enhancement, consistent with the view that individuals do not vary in integration ability; when the visual signal was degraded, however, the older participants had poorer integration enhancement, consistent with the view that individuals vary.
The present results further suggest that regardless of whether individuals do or do not vary in their integration performance, the degree of enhancement is influenced by the test format or context in which the speech signal is presented. This conclusion is supported by integration enhancement data for the BAS and CUNY Tests. For the BAS Test, which uses a closed-set of words, integration enhancement was much lower than it was for the CUNY sentences, which presents open-set words. Notably, this difference in integration enhancement was observed for both young and older participants. In previous work, we have shown that the lexical properties of a word (in particular, how similar a word is to other words in the mental lexicon, both acoustically and visually) affect how likely the word is to be recognized in an audiovisual condition (Tye-Murray et al. 2007). This finding, along with the present results, suggests that any conceptualization of audiovisual integration as either an ability or as a cognitive process must take into account the influences of both signal content and context.
The question still remains as to how best to index integration ability. As noted above, difference scores have problems with respect to both bias and unreliability. Accordingly, we used both integration enhancement and auditory enhancement measures in this investigation, and our results may shed some light on what integration measure may be best. That is, our results suggest that integration enhancement may be a more consistent measure across speech stimuli than auditory enhancement. With auditory enhancement, there was a main effect of age for the BAS sentences but not for the CUNY sentences. In contrast, more consistent results were obtained with integration enhancement. For both the BAS and the CUNY Tests, an age by stimulus clarity interaction was observed: young and older participants had similar levels of integration as measured by integration enhancement when visual clarity was good, but only older adult's integration enhancement decreased when visual clarity was reduced.
In addition to bearing on the question of how best to measure integration, these results shed light on how aging affects integration ability. Older participants recognized fewer words under visual-only conditions than young participants on both the BAS and the CUNY. Nevertheless, when visual signal clarity was good, older participants were generally equivalent in integration enhancement to the young participants on both tests, and also were equivalent with respect to auditory enhancement for the CUNY sentences. These findings suggest that, unlike unimodal speech recognition, audiovisual integration does not decline with aging, at least when the visual speech signal has good clarity. When the visual speech signal was degraded by decreasing the contrast, however, the older participants showed poorer integration enhancement than young adults on both the BAS and the CUNY and also showed poorer auditory enhancement on the CUNY. This finding suggests that any account of aging and audiovisual integration must take into account not only the influences of both signal content and context, as discussed previously, but also the potentially different effects of degrading the visual and auditory components of the speech signal.
In contrast to the present findings, some investigators have reported results suggesting that aging may have a positive effect on audiovisual detection performance, although their use of ANOVA to analyze age differences in response latencies is questionable (Hale, Myerson, Faust, and Fristoe, 1995; Myerson, Adams, Hale, and Jenkins, 2003). Diederich, Colonius, and Schomburg (2008) measured the saccadic latencies of older and young participants to a visual target, presented either with or without a synchronized sound stimulus. Latencies for both groups were shorter in the bimodal condition than in the unimodal condition, but the older group showed greater enhancement than the young group. In short, their performance gain was significantly greater than their younger counterparts when the auditory signal was presented. Similar results have been reported for discrimination response times by Laurienti, Burdette, Maldjian, and Wallace (2006).
In both the Diederich et al. (2008) and Laurienti et al. (2006) studies, however, the older participants were slower than the younger participants in all conditions. Thus, the reported greater benefits from audiovisual stimuli may be simply a consequence of age-related slowing, which necessarily magnifies age differences in more difficult (e.g., unimodal) conditions (e.g., Hale et al., 1995; Myerson et al., 2003). Moreover, consistent with the present results, we recently found that older participants showed less enhancement than younger participants in a task wherein an auditory “ba” was supplemented with visual signals (Tye-Murray, Spehar, Myerson, Sommers, and Hale, 2010).
In future research, we intend to study further the decreased ability of older persons to utilize a degraded visual speech signal for audiovisual speech recognition. The present results add additional support to the finding that vision-only speech recognition skills decline with age and suggest that the decline in vision-only speech recognition skills has ramifications for audiovisual speech recognition. In future research, we will also consider further how integration enhancement and auditory enhancement might vary as a function of stimulus type and how best to quantify the integration process.
Acknowledgments
This work was supported by grant AG18029 from the National Institute on Aging. The content is solely the responsibility of the authors and does not necessarily represent the official views of the National Institute on Aging or the National Institutes of Health. We thank Julia Feld, Nathan Rose, and Krista Taake for their suggestions and comments.
This work was supported by grant award number RO1 AG 18029-4 from the National Institute on Aging.
Footnotes
Publisher's Disclaimer: This is a PDF file of an unedited manuscript that has been accepted for publication. As a service to our customers we are providing this early version of the manuscript. The manuscript will undergo copyediting, typesetting, and review of the resulting proof before it is published in its final citable form. Please note that during the production process errors may be discovered which could affect the content, and all legal disclaimers that apply to the journal pertain.
References
- Boothroyd A, Hanin L, Hnath-Chisholm T. The CUNY Sentence Test. New York: City University of New York; 1985. [Google Scholar]
- Cheesman MG. Speech perception by elderly listeners: basic knowledge and implications for audiology. J Speech Lang Path Audiol. 1997;21:104–110. [Google Scholar]
- Cienkowski KM, Carney AE. Auditory-visual speech perception and aging. Ear Hear. 2002;23:439–449. doi: 10.1097/00003446-200210000-00006. [DOI] [PubMed] [Google Scholar]
- Cronbach LJ, Furby L. How should we measure “change” - or should we? Psychol Bull. 1970;74:68–80. [Google Scholar]
- Diederich A, Colonius H, Schomburg A. Assessing age-related multisensory enhancement with the time-window-of-integration model. Neuropsychologia. 2008:2556–2562. doi: 10.1016/j.neuropsychologia.2008.03.026. [DOI] [PubMed] [Google Scholar]
- Farrimond T. Age differences in the ability to use visual codes in auditory communication. Lang Speech. 1959;2:179–192. [Google Scholar]
- Fletcher H. Speech and hearing in communication. 2nd. New York: Van Nostrand; 1953. [Google Scholar]
- Grant KW. Measures of auditory-visual integration for speech understanding: a theoretical perspective. J Acoust Soc Am. 2002;112:30–33. doi: 10.1121/1.1482076. [DOI] [PubMed] [Google Scholar]
- Grant KW, Walden BE, Seitz PF. Auditory-visual speech recognition by hearing-impaired subjects: Consonant recognition, sentence recognition, and auditory-visual integration. J Acoust Soc Am. 1998;103:2677–2690. doi: 10.1121/1.422788. [DOI] [PubMed] [Google Scholar]
- Hale S, Myerson J, Faust M, Fristoe N. Converging evidence for domain-specific slowing from multiple nonlexical task and multiple analytic methods. J Gerontol: Psychol Sci. 1995;50B:P202–P211. doi: 10.1093/geronb/50b.4.p202. [DOI] [PubMed] [Google Scholar]
- Helfer KS. Auditory and auditory-visual recognition of clear and conversational speech by older adults. J Am Acad Audiol. 1998;9:234–242. [PubMed] [Google Scholar]
- Holmes NP. The principle of inverse effectiveness in multisensory integration: Some statistical considerations. Brain Topogr. 2009;21:168–176. doi: 10.1007/s10548-009-0097-2. [DOI] [PubMed] [Google Scholar]
- Honnell S, Dancer JE, Gentry B. Age and speechreading performance in relation to percent correct, eye blinks, and written responses. Volta Review. 1991;93:207–213. [Google Scholar]
- Lakatos P, Chen CM, O'Connell MN, et al. Neuronal oscillations and multisensory interaction in primary auditory cortex. Neuron. 2007;53:279–292. doi: 10.1016/j.neuron.2006.12.011. [DOI] [PMC free article] [PubMed] [Google Scholar]
- Laurienti PJ, Burdette JH, Maldjian JA, Wallace MT. Enhanced multisensory integration in older adults. Neurobiology of Aging. 2006;27:1155–1163. doi: 10.1016/j.neurobiolaging.2005.05.024. [DOI] [PubMed] [Google Scholar]
- Massaro D. Speech perception by ear and eye : A paradigm for psychological inquiry. Hillsdale, NJ: Erlbaum Associates; 1987. [Google Scholar]
- Massaro DW, Cohen MM. Tests of auditory-visual integration efficiency within the framework of the fuzzy logical model of perception. J Acoust Soc Am. 2000;108:784–789. doi: 10.1121/1.429611. [DOI] [PubMed] [Google Scholar]
- McGurk H, MacDonald J. Hearing lips and seeing voices. Nature. 1976;264:746–748. doi: 10.1038/264746a0. [DOI] [PubMed] [Google Scholar]
- Mills JH, Schmiedt RA, Dubno JR. Older and wiser, but losing hearing nonetheless. Hearing Health, Summer. 2006:12–19. [Google Scholar]
- Myerson J, Adams DR, Hale S, Jenkins L. Analysis of group differences in processing speed: Brinley plots, Q-Q plots, and other conspiracies. Psychon Bull & Rev. 2003;10:224–237. doi: 10.3758/bf03196489. [DOI] [PubMed] [Google Scholar]
- Pedersen KE, Rosenhall U, Moller MB. Longitudinal study of changes in speech perception between 70 and 81 years of age. Audiol. 1991;30:201–211. doi: 10.3109/00206099109072886. [DOI] [PubMed] [Google Scholar]
- Pelli DG, Robson JG, Wilkins AJ. The design of a new letter chart for measuring contrast sensitivity. Clin Vis Sci. 1988;2:187–199. [Google Scholar]
- Picheny MA, Durlach NI, Braida LD. Speaking clearly for the hard of hearing. II: acoustic characteristics of clear and conversational speech. J Speech Hear Res. 1986;29:434–446. doi: 10.1044/jshr.2904.434. [DOI] [PubMed] [Google Scholar]
- Plath P. Speech recognition in the elderly. Acta Otolaryngol. 1991:127–130. doi: 10.3109/00016489109127266. [DOI] [PubMed] [Google Scholar]
- Roeser R, Buckley K, Stickney G. Pure tone tests. In: Roeser R, Hosford-Dunn H, Valente M, editors. Audiology: Diagnosis. New York: Thieme; 2000. pp. 227–252. [Google Scholar]
- Ross LA, Saint-Amour D, Leavitt VM, et al. Do you see what I am saying? Exploring visual enhancement of speech comprehension in noisy environments. Cereb Cortex. 2007;17:1147–1153. doi: 10.1093/cercor/bhl024. [DOI] [PubMed] [Google Scholar]
- Sommers MS, Tye-Murray N, Spehar B. Auditory-visual speech perception and auditory-visual enhancement in normal-hearing younger and older adults. Ear Hear. 2005;26:263–275. doi: 10.1097/00003446-200506000-00003. [DOI] [PubMed] [Google Scholar]
- Stein B, Meredith M. The merging of the senses. Cambridge, MA: MIT Press; 1993. [Google Scholar]
- Studebaker GA. A rationalized arcsine transform. Journal of Speech and Hearing Research. 1985;28:455–462. doi: 10.1044/jshr.2803.455. [DOI] [PubMed] [Google Scholar]
- Sumby WH, Pollack I. Visual contribution to speech intelligibility in noise. J Acoust Soc Am. 1954;26:212–215. [Google Scholar]
- Tye-Murray N, Sommers M, Spehar B. Auditory and visual lexical neighborhoods in audiovisual speech perception. Trends Amplif. 2007;11:233–241. doi: 10.1177/1084713807307409. [DOI] [PMC free article] [PubMed] [Google Scholar]
- Tye-Murray N, Sommers M, Spehar B, et al. Auditory-visual discourse comprehension by older and young adults in favorable and unfavorable conditions. Int J Audiol. 2008;47:S31–S37. doi: 10.1080/14992020802301662. [DOI] [PMC free article] [PubMed] [Google Scholar]
- Tye-Murray N, Spehar B, Myerson J, Sommers M, Hale S. Crossmodal enhancement of speech detection in young and older adults: Does signal content matter? 2010 doi: 10.1097/AUD.0b013e31821a4578. Manuscript under review. [DOI] [PMC free article] [PubMed] [Google Scholar]
- Tyler RS. Speech perception by children. In: Tyler RS, editor. Cochlear implants: Audiological foundations. San Diego, CA: Singular Publishing Group; 1993. pp. 191–256. [Google Scholar]


