

Abstract
We quantified antibody responses to the HCV proteome that are associated with sustained virologic response (SVR) in HIV/HCV co-infected patients treated with pegylated interferon and ribavirin. Analysis of pre- and post-treatment samples revealed significant decreases in the combined anti-core, anti-E1 and anti-NS4 HCV antibody titers in those with SVR, but not in the relapsers or non-responders. Furthermore, anti-p24 HIV antibody titers inversely correlated with treatment response. These results suggest that profiling anti-HCV antibody is useful for monitoring HCV therapy especially in discriminating between relapsers and SVRs at 48 weeks.
Keywords: Antibodies, HCV proteome, SVR, Relapsers
Infection by Hepatitis C virus (HCV) is seen in 15-30% of all HIV-infected individuals in the US, due to the shared routes of viral transmission [1, 2]. The introduction of antiretroviral viral therapy (ART) has improved clinical outcomes in patients infected with HIV. However, liver disease has become a leading cause of morbidity and mortality in this population [3, 4]. HIV-HCV co-infection is also associated with higher HCV viral levels in serum [5, 6], rapid progression of liver disease [7] and lower efficacy of pegylated interferon [peg-IFN] plus ribavirin treatment [5, 8]. Development of biomarkers that can accurately predict therapeutic responses are needed to optimize HCV therapy in this co-infected population. Previously, HIV-HCV coinfected patients who were not responsive to peg-IFN and ribavirin HCV therapy were found to have a gene activation signature present before treatment indicative of the activation of many immune-related molecules including interferon stimulated genes [9]. Quantitative and qualitative humoral responses over the course of HCV therapy among HIV co-infected subjects have never been studied. The ability to clearly predict and monitor outcomes of HCV infection in a robust and simple serological test would have obvious clinical utility. Recently, luciferase immunoprecipitation system (LIPS) assays has been used to accurately quantify antibody responses against various viral pathogens [10]. In the present study, we used LIPS antibody profiling against the whole proteome of HCV and partial proteome of HIV to evaluate its utility in predicting and monitoring response to HCV treatment in HCV-HIV coinfected individuals.
Methods
This was a prospective, open-label trial performed at the National Institute of Allergy and Infectious Diseases (NIAID), National Institutes of Health at Bethesda, Maryland. All 29 patients signed informed consent approved by the NIAID institutional review board. HIV-HCV coinfected patients were treated with peg interferon alpha-2b at 1.5 μg/kg subcutaneously every week (Peg-Intron; Schering-Plough) and ribavirin daily (Rebetol, Schering-Plough, at 400mg Qam and 600mg Qpm for < 75kg, 600mg twice per day for > 75kg) for 48 weeks and followed up for 24 weeks after the end of treatment. All patients irrespective of virologic response were treated for 48 weeks. One patient discontinued Ribavirin at week 24 due to refractory anemia but continued Peg-interferon until week 48.
Patients were eligible for the study if they were > 18 years of age and had CD4+ T cell counts > 100 cells/mm3, absolute neutrophil counts >1000 cells/mm3, HCV viral load >2000 copies/mL, histologic evidence of chronic hepatitis C, stable HIV disease with or without ART. Patients with other causes of liver disease, advanced cirrhosis or severe liver decompensation, and several other conditions were excluded. These patients included 11 no response (NR), 9 end of treatment responders, who relapse after 48 weeks of therapy (RELAP) and 9 sustained virologic responders (SVR). All patients, except one of the RELAP patients who was enrolled in the study and one of the previous NR who was omitted due to lack of a serum sample, have been previously described [9].
Ruc-antigen fusions, including HCV core, HCV NS3, HCV NS5A, HIV p24 Gag, and HIV Tat have been previously described [10]. Four additional HCV proteins were generated as Ruc-antigen fusions including E1, E2, NS3, and NS4. One HCV protein, NS5B, was tested, but not found to be useful and was not used further. LIPS assays with these different HCV and other Ruc-antigens were performed as previously described [11]. All of the LU data represents the average of two independent experiments and have been corrected for background LU values.
GraphPad Prism software (San Diego, CA) was used for statistical analyses. Mann-Whitney U tests were used for comparison of antibody titers in different groups and Wilcoxon signed rank was used to evaluate statistical differences from before and after HCV treatment.
Results
Antibody titers in all patients and two additional control samples were evaluated against six different recombinant HCV antigens, essentially derived from the whole proteome of HCV. A heat map, employing log10-transformed antibody titers, was used to display the differing antibody responses toward the six antigens in individual samples from these subgroups (figure 1A). As shown by the heatmap, LIPS profiling against these 6 HCV antigens clearly distinguished the 29 HCV-infected sera from the 2 uninfected control sera. The most useful antibody response was directed against the HCV core, in which all but one of the 29 HCV-HIV coinfected samples was positive. The second most useful antibody response was against NS3 (figure 1A). The other 4 HCV proteins, E1, E2, NS4 and NS5 showed variable immunoreactivity with HIV-HCV-coinfected sera (figure 1A). Of interest, one NR patient was completely negative for anti-core, anti-E1 and anti-E2 antibodies, but showed strong immunoreactivity to three other non-structural HCV proteins (figure 1A). Antibody titers against the six HCV antigens correlated poorly with each other (rs>0.60) suggesting marked heterogeneity in humoral responses (supplementary Table I).
Figure 1.
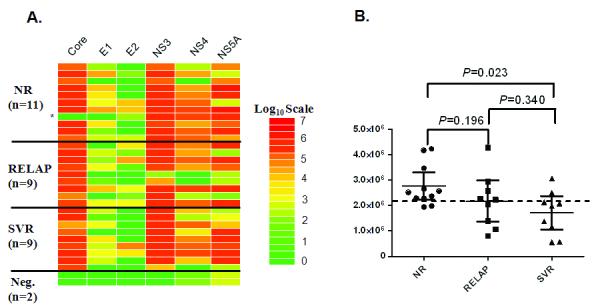
Baseline antibody titers to HCV antigens and p24. A. Heat map representation of patient antibody profiles to the 6 HCV antigens in pretreatment samples from HIV-HCV coinfected patients with differing response to HCV therapy. Antibodies titers were determined in patients from 3 subgroups of HCV-HIV coinfected patients including NR (N=11), RELAP (n=9), SVR (n=9) and 2 non-infected controls. The antibody levels for each serum were log10 transformed and then the levels were color-coded as indicated by the log10 scale on the right, in which signal intensities range from red to green indicating high (red) and low (green) antibody titers. The unusual NR patient without anti-core, anti-E1 and anti-E2 antibodies is shown by the asterisk. B. Anti-p24 antibody titers. Each symbol represents individual samples from NR, RELAP and SVR subgroups. Antibody titers are plotted in LU on the Y-axis and the mean with 95% confidence interval are shown for each group. P values were calculated using the Mann Whitney U test.
Antibody titers against these HCV antigens in pre-treatment sera showed no significant differences between the NR, RELAP and SVR groups (see supplementary figure 1). For example, anti-core antibody mean antibody titer in the NR, RELAP and SVR subgroups was 497,200 LU (95% CI, 279,800-714,700); 483,400 LU (95% CI, 292,500-674,200); and 545,600 LU (95% CI, 299,400-791,900), respectively, and a Mann Whitney U test showed no statistically significant differences (P>0.65). These results suggest that anti-HCV antibody titers in the pretreatment HCV-HIV coinfected samples have no obvious predictive value for response to treatment.
Due to the known impact of HIV-HCV infection on HCV treatment, antibody responses to several HIV proteins were also evaluated in the 3 groups. As shown in figure 1B, all 29 pre-treatment samples were robustly seropositive for anti-p24 HIV GAG antibodies as compared to the 2 uninfected controls and previously determined cut-offs [10]. The mean anti-p24 antibody titers in the NR, RELAP and SVR were 2.77 × 10⁶, 2.17 × 10⁶ and 1.71 × 10⁶ LU, respectively. The anti-p24 antibody titer in the RELAP sub-group did not significantly differ from either the NR or SVR subgroup (Mann Whitney U test, P>0.47), the NR and SVR subgroups showed statistically significant differences in anti-p24 antibody titers (P=0.023). The anti-p24 antibody titers did not correlate (P>0.05) with HIV or HCV viral load, genotype or CD4 counts (data not shown). However, the anti-p24 antibody titers paralleled the cumulative group scores for the IFN-associated gene expression signature previously reported by Lempicki et al. [9] on the same patients. Antibodies to TAT protein of HIV did not differ significantly (P>0.26) between the NR, RELAP and SVR subgroups (data not shown). Since statistically higher anti-p24 antibody titers were detected in the NR versus the SVR group and correlated with failure to HCV therapy, a cut-off based on 2.2 million LU was determined to optimally separate these two groups. Using this approach, 9 of the 11 NR were above cut-off compared to only 2 of the 9 SVR (figure 1B). Based on this analysis, the p24 antibody titers provide 82% positive predictive value in identifying the NR that would fail therapy. Although p24 antibody titers only had value in distinguishing NR from SVR, but not for the RELAP group, there is little practical predictive value for this test in HIV/HIV-coinfected individuals.
Antibody titers to the panel of HCV proteins were also evaluated in the pre and post-treatment for their value in monitoring HCV treatment. Wilcoxon sign ranked test revealed that four of the six HCV proteins (core, E1, E2 and NS4) showed statistically significant (P<0.05) decreases in antibody titer between the pre- and post-treatment samples (figure 2). In contrast, antibody responses to NS3 and NS5A antigens did not significantly change from the before and after treatment (P>0.44). Substratification by treatment outcome revealed that the SVR group showed the most consistent and largest decrease (P=0.02) in antibody titers to the 3 most informative antigens (core, E1, NS4) following treatment (figure 2). In contrast, the NR and RELAP groups had relatively stable antibody titers against these 3 antigens between the pre- and post-treatment (P=0.70 and P=0.43, respectively) (figure 2). Anti-p24 HIV and anti-BRLF2 EBV antibody titers also did not change with anti-HCV therapy (data not shown). There was heterogeneity in response to the different HCV antigens in the SVR, in which some patients showed the largest decrease in anti-HCV core antibodies, while other patients showed more pronounced decreases to ENV1 and NS4. Since decreasing antibodies to these 3 HCV antigens was a common feature of SVR compared to the NR and RELAP group, the relative decrease in antibody between the pre- and post samples was the most useful approach for distinguishing SVR from NR and REALP. Using an antibody titer decrease between the pre- and post-samples of greater than 1.5-fold as a marker of HCV therapy success, 6 of the 9 SVR were positive verses only 1 of the 9 RELAP, and none of the NR. Overall this LIPS test measuring differences in antibody titers to these 3 HCV from the pre and post-treatment samples showed 86% positive predictive value in identifying response to therapy.
Figure 2.

Informative antibody titers pre- and post- HCV treatment in HIV-coinfected NR, RELAP and SVR subgroups. Anti-core, E1 and NS4 antibodies levels at baseline and post-treatment in individual patients from the NR, RELAP and SVR groups. The thick short solid bar reflects the mean titer in each group for the pre and post-treatment sample. Statistical differences between pre- and post-therapy values were calculated using the nonparametric Wilcoxon signed rank test. The bottom of the figure shows the P value derived from summation of the antibody LU titers for the 3 antigens.
Discussion
Our study suggests that highly quantitative HCV proteome-wide antibody responses can be a valuable tool for monitoring and predicting HCV therapeutic responses among HIV co-infected patients. Few studies have examined the utility of anti-pathogen antibodies for predicting and monitoring drug therapy. LIPS provided a clearer summary of the marked patient variability in humoral responses to the whole HCV proteome than previously reported. None of the baseline antibody responses to the 6 different HCV proteins predicted response to HCV therapy. This suggests that pre-existing host humoral responses to HCV generally do not impact the response to HCV therapy. Previously, pre-treatment HCV mono-infected patients not normalized for HCV viral load showed higher anti-NS4A and anti-NS5a antibody titers in the SVR patients compared to the NR [12]. It should be noted that our study differs from these published studies in that the patient population were HCV/HIV-coinfected controlled for HCV viral loads. Nevertheless, one NR patient completely lacked anti-core, anti-E1 and anti-E2 antibodies, but had high levels of other HCV antibodies, possibly explaining the lack of responsiveness to HCV therapy. Since this NR patient (HCV-genotype I) had ample antibodies to HIV and nonstructural HCV proteins, it is likely that selective B-cell exhaustion or deletion of certain populations of plasma B cells may have occurred [13, 14]. Intriguingly, anti-p24 HIV antibodies detected in the pre-treatment samples inversely correlated with response to treatment. The highest anti-p24 antibody titers were in the NR, intermediate titers were in the RELAP and the lowest titers were in the SVR. The higher anti-p24 antibody titers in NR compared to the SVR subgroup suggests that some of the NR patients who respond poorly to IFN treatment may have an abnormal immune response to HIV.
Declining anti-HCV core and envelope specific antibody responses at the end of therapy were observed only among SVR subjects, suggesting that these antibody responses could be used to discriminate between relapsers and SVR at the end of therapy. The SVR group showed the largest and most consistent decrease in antibody titers to the core, E1, and NS4 proteins following 48 weeks of treatment. In contrast, the NR and RELAP groups showed minimal decreases in antibody titers. Despite the less than detectable levels of HCV RNA at end of HCV treatment in the RELAP and SVR groups, significant decreases in anti-HCV antibody titers do occur frequently among the SVR patients. Since the HCV viral load in the RELAP and SVR groups were clinically indistinguishable, and below the level of detection, it is possible that the decrease in antibodies in the SVR subgroup reflects a marked drop in antigen load in the liver rather than in the plasma. Regardless of the mechanism, the differential response in antibody titers among SVR and RELAP groups at the end of treatment, offers a novel tool to predict those who will relapse after stopping treatment. This could lead to developing novel therapeutic strategies, such as extended therapy for relapsers. Future studies addressing whether these antibodies and/or other biomarkers show robust differences at earlier time points may provide practical tools for monitoring therapy.
Supplementary Material
Supplementary Figure 1. Anti-HCV antibody profiling for predicting response to HCV therapy. Patient antibody titers to the 6 HCV antigens are shown for pre-treatment samples from the NR (N=11), RELAP (n=9), and SVR (n=9) subgroups of HCV-HIV coinfected patients. Each symbol represents antibody titer values from individual samples from NR, RELAP and SVR subgroups. Antibody titers are plotted in LU on the Y-axis and the mean with 95% confidence interval are shown for each group. P values were calculated using the Mann Whitney U test and there were no statistically significant differences in antibody titers between the groups.
Supplementary Table I. Correlation of antibody titers to the different HCV proteins in pre-treatment samples.
Antibody titers for the 6 different HCV antigens were determined for each sample. Spearman rank correlation coefficients (rs) are shown and were calculated for each of the antibody titer pairs.
Acknowledgments
Financial support: This work was supported in part by the Division of Intramural Research, National Institute of Allergy and Infectious Diseases and National Institute of Dental and Craniofacial Research, National Institutes of Health and, in part, by a Bench to Bedside award from the NIH Clinical Research Center.
Footnotes
Potential conflicts of interest: none reported.
References
- 1.Alter MJ, Kruszon-Moran D, Nainan OV, et al. The prevalence of hepatitis C virus infection in the United States, 1988 through 1994. N Engl J Med. 1999;341:556–62. doi: 10.1056/NEJM199908193410802. [DOI] [PubMed] [Google Scholar]
- 2.Sherman KE, Rouster SD, Chung RT, Rajicic N. Hepatitis C Virus prevalence among patients infected with Human Immunodeficiency Virus: a cross-sectional analysis of the US adult AIDS Clinical Trials Group. Clin Infect Dis. 2002;34:831–7. doi: 10.1086/339042. [DOI] [PubMed] [Google Scholar]
- 3.Bonacini M, Louie S, Bzowej N, Wohl AR. Survival in patients with HIV infection and viral hepatitis B or C: a cohort study. Aids. 2004;18:2039–45. doi: 10.1097/00002030-200410210-00008. [DOI] [PubMed] [Google Scholar]
- 4.Selik RM, Byers RH, Jr., Dworkin MS. Trends in diseases reported on U.S. death certificates that mentioned HIV infection, 1987-1999. J Acquir Immune Defic Syndr. 2002;29:378–87. doi: 10.1097/00126334-200204010-00009. [DOI] [PubMed] [Google Scholar]
- 5.Chun S, Sherman KE. Treatment of hepatitis C virus/HIV coinfection. Clin Liver Dis. 2005;9:525–33. ix. doi: 10.1016/j.cld.2005.05.008. [DOI] [PubMed] [Google Scholar]
- 6.Thomas DL, Astemborski J, Vlahov D, et al. Determinants of the quantity of hepatitis C virus RNA. J Infect Dis. 2000;181:844–51. doi: 10.1086/315314. [DOI] [PubMed] [Google Scholar]
- 7.Benhamou Y, Bochet M, Di Martino V, et al. Liver fibrosis progression in human immunodeficiency virus and hepatitis C virus coinfected patients. The Multivirc Group. Hepatology. 1999;30:1054–8. doi: 10.1002/hep.510300409. [DOI] [PubMed] [Google Scholar]
- 8.Mallolas J, Laguno M. Pegylated IFN-alpha2b plus ribavirin for treatment-naive patients coinfected with HCV and HIV. Expert Rev Anti Infect Ther. 2008;6:281–9. doi: 10.1586/14787210.6.3.281. [DOI] [PubMed] [Google Scholar]
- 9.Lempicki RA, Polis MA, Yang J, et al. Gene expression profiles in hepatitis C virus (HCV) and HIV coinfection: class prediction analyses before treatment predict the outcome of anti-HCV therapy among HIV-coinfected persons. J Infect Dis. 2006;193:1172–7. doi: 10.1086/501365. [DOI] [PubMed] [Google Scholar]
- 10.Burbelo PD, Ching KH, Mattson TL, Light JS, Bishop LR, Kovacs JA. Rapid antibody quantification and generation of whole proteome antibody response profiles using LIPS (luciferase immunoprecipitation systems) Biochem Biophys Res Commun. 2007;352:889–95. doi: 10.1016/j.bbrc.2006.11.140. [DOI] [PubMed] [Google Scholar]
- 11.Burbelo PD, Meoli E, Leahy HP, et al. Anti-HTLV antibody profiling reveals an antibody signature for HTLV-I-associated myelopathy/tropical spastic paraparesis (HAM/TSP) Retrovirology. 2008;5:96. doi: 10.1186/1742-4690-5-96. [DOI] [PMC free article] [PubMed] [Google Scholar]
- 12.Desombere I, Van Vlierberghe H, Weiland O, et al. Serum levels of anti-NS4a and anti-NS5a predict treatment response of patients with chronic hepatitis C. J Med Virol. 2007;79:701–13. doi: 10.1002/jmv.20846. [DOI] [PubMed] [Google Scholar]
- 13.Moir S, Fauci AS. B cells in HIV infection and disease. Nat Rev Immunol. 2009;9:235–45. doi: 10.1038/nri2524. [DOI] [PMC free article] [PubMed] [Google Scholar]
- 14.Moir S, Ho J, Malaspina A, et al. Evidence for HIV-associated B cell exhaustion in a dysfunctional memory B cell compartment in HIV-infected viremic individuals. J Exp Med. 2008;205:1797–805. doi: 10.1084/jem.20072683. [DOI] [PMC free article] [PubMed] [Google Scholar]
Associated Data
This section collects any data citations, data availability statements, or supplementary materials included in this article.
Supplementary Materials
Supplementary Figure 1. Anti-HCV antibody profiling for predicting response to HCV therapy. Patient antibody titers to the 6 HCV antigens are shown for pre-treatment samples from the NR (N=11), RELAP (n=9), and SVR (n=9) subgroups of HCV-HIV coinfected patients. Each symbol represents antibody titer values from individual samples from NR, RELAP and SVR subgroups. Antibody titers are plotted in LU on the Y-axis and the mean with 95% confidence interval are shown for each group. P values were calculated using the Mann Whitney U test and there were no statistically significant differences in antibody titers between the groups.
Supplementary Table I. Correlation of antibody titers to the different HCV proteins in pre-treatment samples.
Antibody titers for the 6 different HCV antigens were determined for each sample. Spearman rank correlation coefficients (rs) are shown and were calculated for each of the antibody titer pairs.