Abstract
In a recent report we demonstrated efficient collection of emission by coupling to surface plasmons on a thin silver film, resulting in a directional signal in the glass substrate. We call the phenomenon surface plasmon coupled emission (SPCE). In the present report we examined sulforhodamine 101 (S101) in thin polymer films on 50 nm thick gold films on glass. We observed efficient SPCE through thin gold films. This result was surprising because metallic gold is typically an efficient quencher of fluorescence. The energy effectively coupled through the gold film into the glass at a sharply defined angle, but somewhat less sharp than for a comparable silver film. About 50% of the total emission appeared as SPCE, irrespective of direct excitation or excitation via the plasmon resonance evanescent wave. The emission was p-polarized with different wavelengths appearing at different angles. The lifetime of S101 was mostly unaffected by the gold film. These results indicate that SPCE occurs over long distances, larger than for quenching by energy transfer to the gold. We conclude highly efficient detection devices can be constructed by using fluorophores on gold-coated surfaces.
Introduction
In several reports we described the interactions of fluorophores with metallic silver particles and surfaces. We found that fluorophores within 100 Å of subwavelength-size silver particles displayed several useful spectral changes, including increases in intensity, quantum yield, photostability, distance for resonance energy transfer, and multiphoton excitation.1–5 These effects are the result of changes in the photonic mode density (PMD) near the fluorophore.6,7 More recently we reported the phenomenon of surface plasmon coupled emission (SPCE). This occurs when fluorophores are within about 100 nm of a continuous silver film.8–10 The energy from the excited fluorophores couples with surface plasmons with efficiencies near 50% and enters the glass substrate at a sharply defined angle.
The effects of silver particles or films on fluorophores are the result of the free electron metallic properties of silver. Gold has similar metallic properties but also displays a visible absorption. Gold is known to strongly quench fluorescence, more probably by resonance energy transfer to the absorption bands. For example, molecular beacons using gold particles as the acceptor display large on–off intensity ratios because of the highly efficient quenching by gold.11,12 Energy transfer to gold is known to occur over distances somewhat larger than the usual Forster distances.13,14 For this reason gold is an unlikely metal for enhancing fluorescence. For clarity we note that both silver and gold may act as quenchers for fluorophores in direct contact with the metal surface. Silver appears to enhance fluorescence for fluorophores 20 to 100 Å from its surface. Over this range of distances, gold acts mostly as a quencher due to energy transfer to its surface.
In our studies of SPCE8–10 we found this phenomenon to occur over distances up to 200 nm, which are much larger than the 5 nm distances for RET quenching.13,14 Hence we reasoned that SPCE may occur for gold because the fluorophores can be within the distance for coupling but outside the distance for quenching. Observation of SPCE with gold would be advantageous because of the long-term chemical stability of gold surfaces and the extensive literature on gold surface chemistry.15–18 Additionally, thin gold films are widely used in surface plasmon resonance (SPR), which provides both a technology base for preparation of suitable gold films and potentially new capabilities for SPR instruments.
Theory
The phenomenon of SPCE can be understood from the physics of surface plasmons19,20 and the phenomenon of surface plasmon resonance.21,22 SPCE appears to be the reverse process of SPR. Instead of absorption of the incident light by the metal film, SPCE is the emission of light by the metal film due to nearby excited fluorophores. SPR occurs under specific conditions where the wavevector of the incident light matches the wavevector of the surface plasmon. This occurs if the light is incident from the side of the metal film with higher refractive index, typically a glass prism (Scheme 1, top). Absorption occurs at a specific angle of incidence (θI) when this angle equals the SPR angle for the incident light (θSP). The reflectivity of the metal film is high at all angles except for a small range of angles around θSP. The occurrence of surface plasmon absorption depends on matching the wavevector of the incident light (k) with the wavevector of the surface plasmons (kSP). The wavevector of the incident light is given by
SCHEME 1.
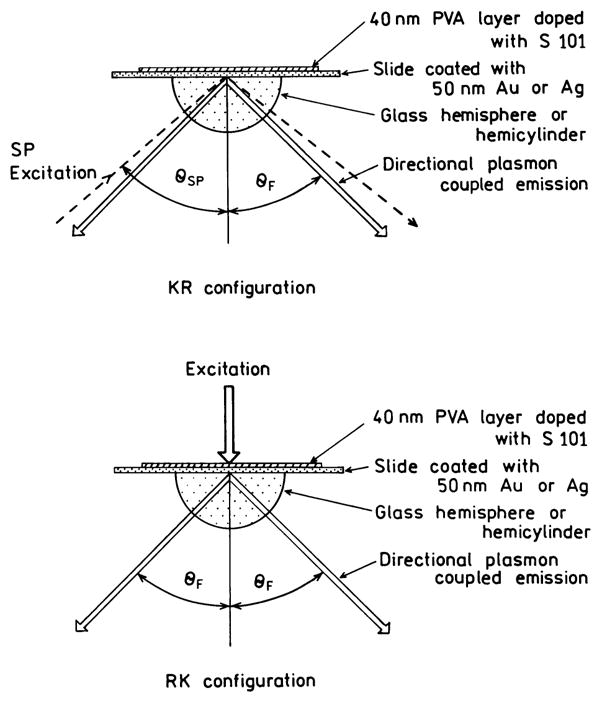
Geometry for SPCE Measurements with the KR Configuration (top) and for SPCE Measurements with the RK Configuration (bottom)
| (1) |
where n is the refractive index of the prism, λ is the wavelength in the prism, ω is the frequency in radians/s, and k0 is the wavevector in free space.
Calculation of the wavevector for the surface plasmon is more complex. The refractive index (n) and dielectric constant (ε) of a metal (m) in a complex quantity is given by
| (2) |
where and the subscripts indicate the real (r) and imaginary (im) components. For a metal the wavevector for the surface plasmon can be approximated by
| (3) |
where εr and εs are the real parts of the dielectric constants of the metal (m) and the sample (s) above the metal film distal from the prism, respectively.
The incident light interacts with the surface plasmon when its x-axis component equals the wavevector for the surface plasmon. The wavevector for the incident light in the prism is given by
| (4) |
and the component along the x-axis (projection of the wave-vector onto the interface9) is equal by
| (5) |
where θI is the incidence angle in the prism measured from an axis normal to the metal surface. The conditions for SPR absorption are satisfied when
| (6) |
Examination of eq 6 reveals an important property of SPR. For SPR to occur the electric vector of the incident light in the metal plane needs to be modified by the factor sin θI. This only occurs if the electric vector is parallel to the plane of incidence. Such light is said to be p-polarized. Light is s-polarized if the electric vector is perpendicular to the plane of incidence. Under the conditions used in this study s-polarized light does not display SPR. However, this restriction can be changed for certain thicknesses of the sample layer.
We found that the angular distribution of SPCE matches the reflectivity curves for the nearby silver surface.8–10 This effect appears to be due to a near-field interaction of excited state fluorophores with the metal surface, and not simply a result of decreased reflectivity of the film. The equations used to explain SPR (eqs 1–6) are thus useful for explaining SPCE.
In reality SPR and SPCE do not occur only at a single angle, but over a relatively narrow range of angles determined by the optical constants and resonance response of the metal. Calculation of the angle-dependent reflectivity curves requires moderately complex equations.10,23,24 Reflectivity curves can also be calculated with web-based software25 or commercial software used to design optical thin film filters.26
Materials and Methods
Sample Preparation
Glass microscope slides (plain, Corning) were coated by vapor deposition by EMF Corp., Ithaca, NY. A 50 nm thick layer of gold or silver was deposited on the glass, followed by a 5 nm layer of SiO2 to serve as a spacer and protect the silver surface. Fluorophores were deposited on the surface by spin coating at 3000 rpm a 2 wt % solution of low molecular weight poly(vinyl alcohol) (PVA) in water. The PVA solution contained sulforhodamine 101 (S101) from Aldrich. The thickness of the PVA films was estimated by measurement of optical densities at 587 nm of S101 in spin-coated film and in control 10 μm thick films obtained from the same stock solution by evaporation. The optical density of S101 in spin-coated film on glass was 0.006 and in control 10 μm film it was 1.43. We estimated the thickness of our spin-coated film to be 40 ± 5 nm. The thickness of gold and PVA films were further confirmed by the spectroscopic ellipsometry analysis done by Mr. Alan Kramer from the Jobin Yvon Horiba research group (Edison, NJ). The spectroscopic phase modulated ellipsometer determined the thickness of the gold to be 51.4 nm. The measured thicknesses of the PVA layer were 41.7 nm on gold and 39.8 nm on glass.
Fluorescence Measurements
The coated slides were attached to a hemicylindrical prism made of BK7 glass with index maching fluid. This combined sample was positioned on a precise rotary stage that allows excitation and observation at any desired angle relative to the vertical axis along the cylinder.10 Two modes of excitation were used (Scheme 1). The sample could be excited through the prism. In this case the incident light was completely reflected at all angles except when the incident angle θI equaled the surface plasmon angle θSP. For incident angles near θSP there exists an evanescent wave in the air-sample side, distal from the incident light. This evanescent field extends about 200 nm into the air or sample. This mode of illumination is called the Kretschmann (KR) configuration (Scheme 1, top). The sample can also be excited from the air or sample side, which has a refractive index lower than the prism. In this case it is not possible to excite surface plasmons. The angle of incidence does not matter but we used normal incidence. This is called the reverse Kretschmann (RK) configuration (Scheme 1, bottom). Observation of the emission was performed with a 3 mm diameter fiber bundle, covered with a 200 μm vertical slit, positioned about 15 cm from the sample. This corresponds to an acceptance angle below 0.1°.
For excitation we used the 514 nm output of a mode-locked argon ion laser, 76 MHz repetition rate, 120 ps half-width. Scattered light at 514 nm was suppressed by observation through a holographic supernotch-plus filter (Kaiser Optical System, Inc., Ann Arbor, MI). Emission intensities were observed through a long wave pass filter LWP 540 in addition to the notch filter. All emission spectra were recorded through the notch filter. Frequency-domain intensity decays were measured with the 10-GHz instrument described earlier.27 The phase and modulation measurements were performed over a range of modulation frequencies from 76 to 608 MHz. For the photographs we used 532 nm excitation from a solid-state laser (maximum output power 30 mW) and the samples were attached to a hemispherical prism rather than a hemicylinder.
The multifrequency phase and modulation data were analyzed in terms of the multiexponential model
| (7) |
where τi are the lifetimes with amplitudes αi and Σαi = 1.0. The parameters αi and τi were determined by nonlinear least squares, as described previously.28 The multiexponential model is used to describe the form of the intensity decay. We are not assigning molecular significance to the recovered parameters. The contribution of each component to the steady-state intensity is given by
| (8) |
The mean decay time is given by
| (9) |
The amplitude-weighted lifetime is given by
| (10) |
Results
SPCE with Reverse Kretschmann Configuration
The fluorophore S101 in PVA was coated on the gold films. We measured the emission intensities for all angles around the z-axis in the plane of the gold film. We used RK excitation since the incident light cannot excite surface plasmons. The angle-dependent emission intensities are shown in Figure 1 (top). The emission was sharply distributed at ±57.5°. By integration of the angle-dependent intensities we estimate that 64% of the emission couples through the gold film and radiates at this angle. We regard this estimate as only an approximation. Emission spectra recorded at the angle of maximum emission are shown in Figure 2. The emission spectra of the SPCE are equivalent to the free-space emission spectra of S101 observed with the same sample. The SPCE was almost completely polarized in the horizontal direction, which is p-polarized. The SPCE is p-polarized irrespective of the polarization of the incident light (Figure 2, top and bottom). The magnitude of the polarization (>0.9) is larger than possible for an isotropic distribution of fluorophores even when excited with polarized light. These unusual properties of angular distribution and polarization are characteristic of SPCE9,10 and demonstrate that this phenomenon occurs with gold films. The high polarization value demonstrates that SPCE dominates the signal at the SPCE observation angle. The high polarization indicates that the emission is probably due to surface plasmons which radiate into the prism.
Figure 1.
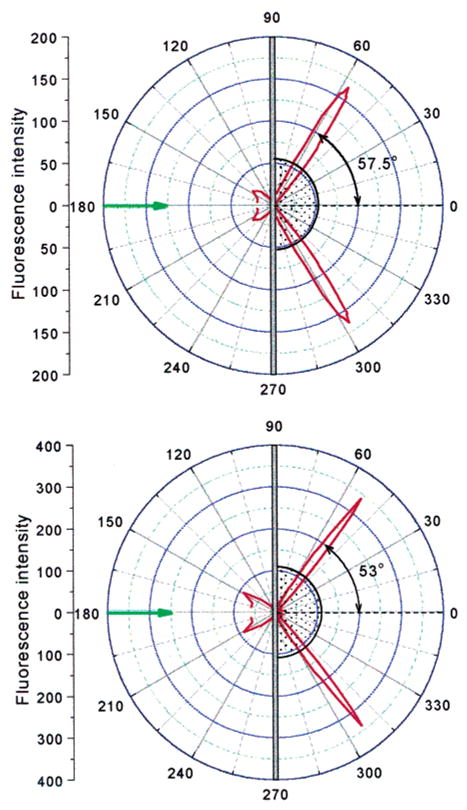
Angular distribution of the emission of S101 in PVA (40 nm thick) on a gold film (top) and a silver film (bottom). The excitation was horizontally polarized and the emission observed through a horizontal polarizer.
Figure 2.
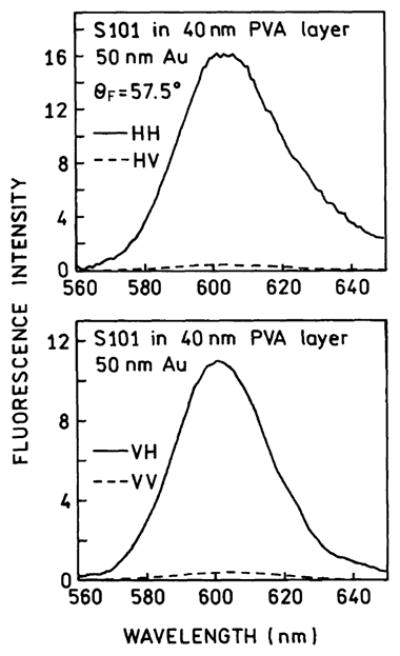
Emission spectra of S101 in PVA on a gold film measured with the RK configuration. V and H represent vertical and horizontal polarization in the order excitation–emission. Top panel: p-polarized excitation. Bottom panel: s-polarized excitation.
Since gold is known to quench fluorescence, and silver particles to enhance fluorescence, it was of interest to compare SPCE for the same samples on gold or sliver surfaces. The width of the angular distribution on the gold surface was about 2-fold larger than that for sliver (Figure 1, bottom), but with a lower peak intensity, which we attribute to the different plasmon resonances of these metals. Surprisingly, only a slightly lower total amount of SPCE was observed on the gold than on silver surfaces, which demonstrates the absence of significant quenching by gold. The extent of gold quenching was probably minimized by our use of a 5 nm layer of SiO2 to protect the metal surfaces. The comparable intensities of the SPCE on gold and silver demonstrate the coupling occurs over distances larger than Forster energy transfer to the gold surface.
It is of interest to compare the angular distributions for SPCE with the surface plasmon resonance for absorption. The angle-dependent reflectivity curves for gold and silver at the emission wavelength of 600 nm are shown in Figure 3. These curves were calculated by using optical constants appropriate for our experimental configurations and the emission maximum of S101. The reflectivity minima occurred at 57° and 50° for gold and silver, respectively (Figure 3). These values are in good agreement with the observed maxima of 57.5° and 53°, for gold and silver, respectively. Also, the reflectivity curve is wider for gold than for silver, which is consistent with the wider angular distribution of SPCE on gold (Figure 1).
Figure 3.
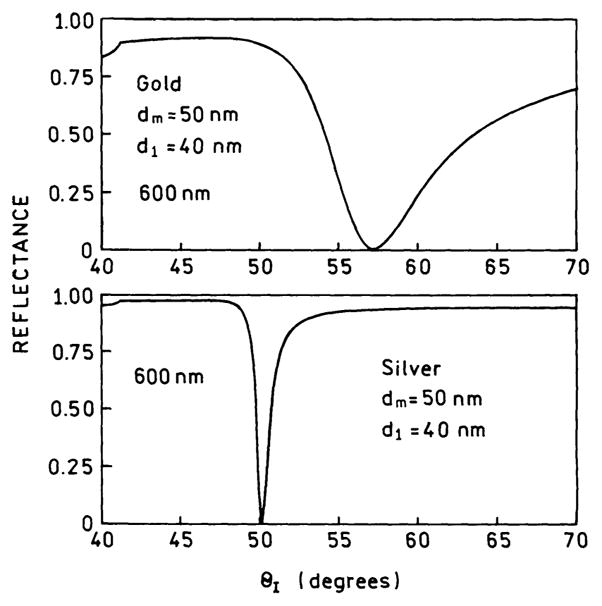
Calculated reflections for gold (top) and silver (bottom) mirrors. The coupling hemicylinder prism was from BK7 glass, n = 1.52; the d1 layer was PVA, n = 1.50. For silver we used ε = −17 + 0.6i and for gold we used −8.9 + 1.07i.
An important characteristic of SPCE is that the coupling angle depends on wavelength. This suggests that one can observe different parts of an emission spectrum with different observation angles. Figure 4 shows emission spectra for the gold SPCE of S101, recorded with the fiber input at different angular locations. As the observation angle is increased the emission spectra shift to shorter wavelengths, which is consistent with the dependence expected from eq 6. The spectral shifts seen in Figure 4 are not very large because of the narrow emission spectrum of S101. Nonetheless, the visual appearance of the emission changed from yellow to red upon changing the observation angle.
Figure 4.
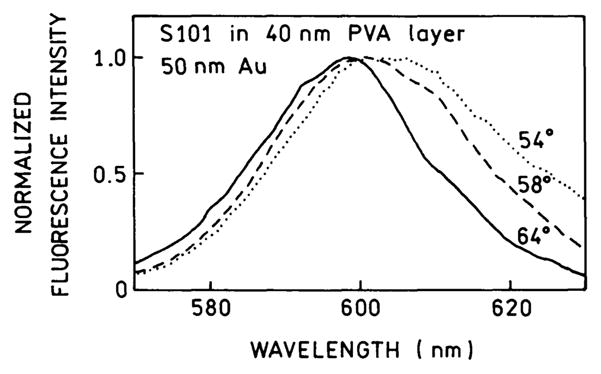
Emission spectra of S101 in PVA on gold recorded with different observation angles.
In Figure 1 we showed the angle-dependent intensities for S101 measured in a single plane. However, examination of Scheme 1 shows that for RK excitation the axis normal to the gold film is a symmetry axis. Hence the emission intensity should be the same for all azimuthal angles around the normal axis. This concept is shown in Scheme 2, where there is a cone of equal emission intensity for all angles θA.
SCHEME 2.
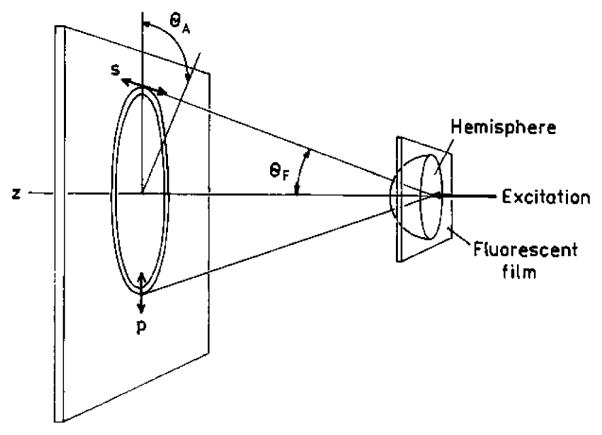
Schematic of the Cone of Emission in RK Configuration
We examined the cone-of-emission by projecting the light onto white tracing paper. Figure 5 shows real color photographs of the SPCE. A circular ring of emission is easily visible for S101 on the gold film (top panel). The lower two panels compare the cones for gold (middle) and silver (bottom) films. The cone is somewhat wider for gold than for silver, which is due to the wider range of decreased reflectivity for gold as compared to silver (Figure 3).
Figure 5.
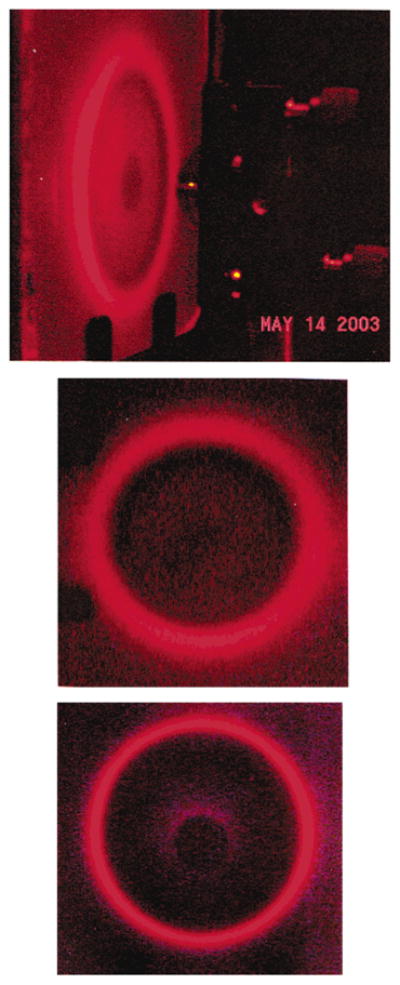
Photographs of the S101 directional emission in PVA on gold mirror side-view (top) and front view (middle). Bottom: emission cone from S101 on a silver film.
SPCE with the Kretschmann Configuration
In the preceding experiments we used the RK configuration and surface plasmons in the metal were not induced by the incident light. When a gold or silver film is illuminated through the prism, and the angle of incidence equals the surface plasmon angle, one creates surface plasmons at the interface between the gold and PVA films. The excited plasmons create an evanescent field above the metal. It is known that fluorescence can be excited by this evanescent wave, which exists above the gold distal from the glass. The evanescent field extends about 200 nm into the sample, and the intensity is enhanced about 20-fold relative to the incident light.29,30
We measured the free-space emission of S101 for a range of incident angles (Figure 6, insert). Emission from S101 is only seen at incident angles where there is a decreased reflectivity of the incident light. At other angles the gold and silver are highly reflective so little light penetrates the metal films (Figure 6). For the gold film (top) a wider range of incident angles result in S101 free-space emission than for the silver film (bottom).
Figure 6.
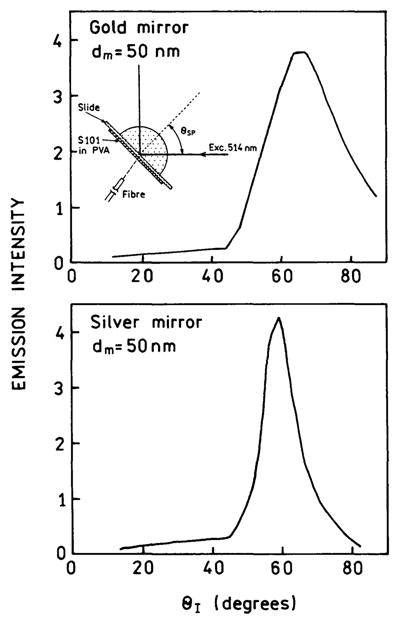
Effect of the excitation incidence angle for the free space emission intensity of S101 in PVA on gold (top) and silver (bottom).
We examined the angular distribution of the SPCE when excited by the evanescent field. The angular distributions of the S101 emission are nearly identical with those observed with reverse Kretschmann excitation (Figure 7). It is interesting to note the similarities between Figures 7 and 1. In Figure 7 we are observing the SPCE resulting from surface plasmon evanescent wave excitation. In Figure 1 we are observing the SPCE without excitation of surface plasmons in the metal. In Figure 7 the evanescent field excited the fluorescence. The similarity of the angular distributions shows the SPR and SPCE are separate events.
Figure 7.
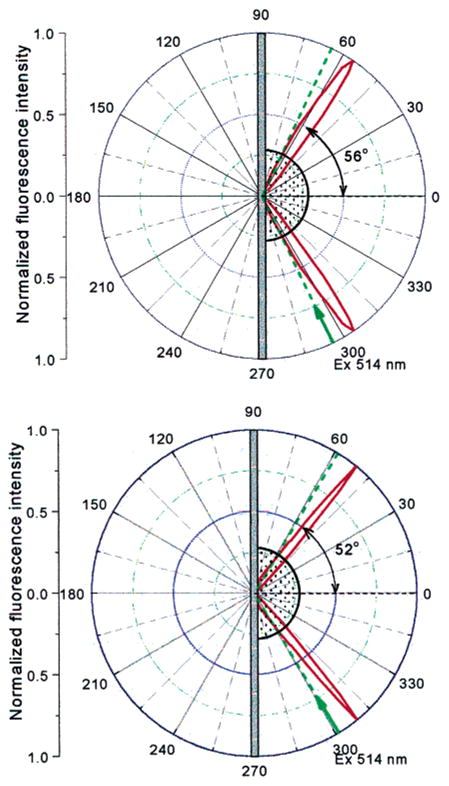
Angular distribution of the S101 emission in PVA on gold (top) and silver (bottom) observed with KR (SP) excitation.
We measured the polarization of the emission with surface plasmon evanescent wave excitation while observing the SPCE. Significant intensity was only observed when the emission polarizer was horizontal in the lab axis, which is p-polarized (Figure 8). The SPCE emission was almost completely p-polarized with both the gold (top) and silver (bottom) films. In contrast, the free space emission was much less polarized (p = 0.1). s-polarized light cannot excite the plasmons and does not penetrate the metals.
Figure 8.
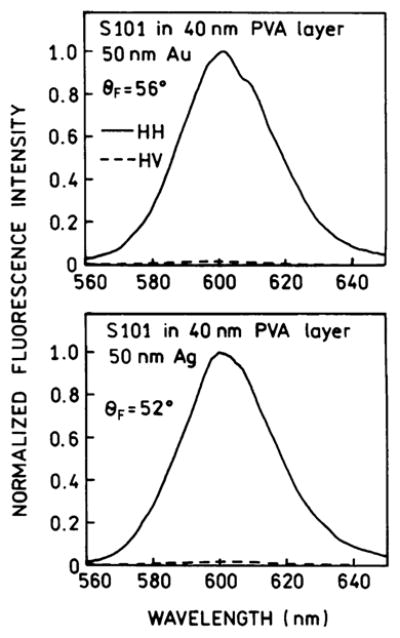
Emission spectra of S101 in PVA on gold (top) and silver (bottom) with p-polarized SP excitation observed through horizontally (−) or vertically (- - -) oriented polarizers.
Time-Resolved Intensity Decays Near Gold Films
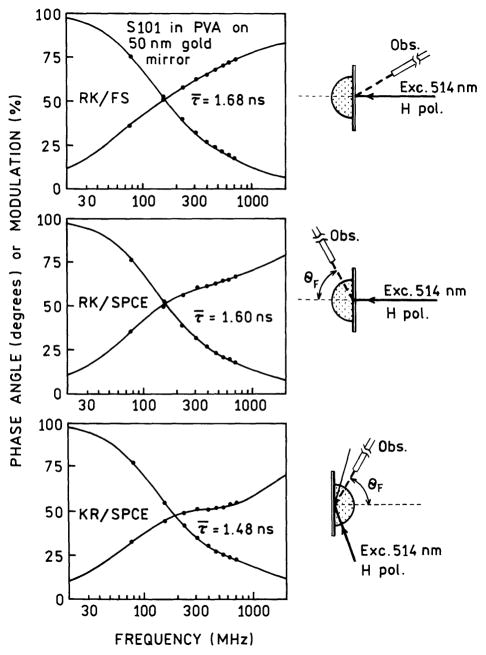
In our previous studies of the effects of silver particles we observed substantial decreases in the lifetimes of nearby fluorophores.2–4 We believe these decreases are due to increases in the radiative decay rates of fluorophores near metallic particles. In the present experiments a large fraction of the total emission appears at the plasmon angles. We expected this effect to be the result of a rapid decay of the fluorophores into the SPCE, occurring mostly before the radiative decay into free space. Thus we expected decreased lifetimes for the SPCE. Figure 9 shows the frequency-domain intensity decays of S101 measured under these conditions. The free space decay was measured with RK excitation, no surface plasmon evanescent wave (top), the SPCE with RK excitation (middle), and the SPCE with surface plasmon (KR) excitation (bottom). Table 1 summarizes the intensity decays under these three conditions for gold and silver. Surprisingly, the three decays are very similar, with only a small decrease in mean lifetimes observed for KR excitation and SPCE (Figure 9, bottom). We attribute this small lifetime decrease to quenching by the gold, which occurs more in this case because excitation by the SP evanescent wave results in excitation of those fluorophores closest to the gold film. In the case of silver there is less evidence of metal quenching with SP excitation. The most important conclusion from these intensity decay measurements is that the lifetimes of SPCE and the free space emission are essentially the same.
Figure 9.
Frequency-domain intensity decays of S101 in PVA on gold. Top and middle, RK excitation. Top: free-space emission. Middle: surface plasmon-coupled emission. Bottom: KR excitation and surface plasmon-coupled emission.
TABLE 1.
Multiexponential Analysis of S101 Intensity Decays on Metallic Mirrors
| sample/conditions | τ̄ (ns) | 〈τ〉 (ns) | αi | fi | τi (ns) | χR2 |
|---|---|---|---|---|---|---|
| gold, FSb | 1.21 | 1.68 | 0.458 | 0.150 | 0.40 | 1.3 (233)a |
| 0.542 | 0.850 | 1.90 | ||||
| gold, RK | 1.00 | 1.60 | 0.496 | 0.108 | 0.22 | 1.8 (472) |
| 0.504 | 0.892 | 1.77 | ||||
| gold, KR | 0.71 | 1.48 | 0.678 | 0.179 | 0.18 | 1.6 (1,033) |
| 0.322 | 0.821 | 1.77 | ||||
| silver, FS | 1.15 | 1.78 | 0.531 | 0.162 | 0.35 | 2.2 (418) |
| 0.469 | 0.838 | 2.05 | ||||
| silver, RK | 0.99 | 1.76 | 0.596 | 0.161 | 0.27 | 1.7 (718) |
| 0.404 | 0.839 | 2.05 | ||||
| silver, KR | 1.00 | 1.72 | 0.573 | 0.154 | 0.27 | 1.7 (632) |
| 0.427 | 0.846 | 1.99 |
The values in parentheses are for the single-exponential fit.
FS = free space.
Discussion
In our opinion, the existence of efficient surface plasmon-coupled emission with gold films will result in numerous applications to biomolecule detection. Surface plasmon resonance is widely utilized to measure a wide range of bioaffinity reactions,31–33 and SPR is being extended to electrophoresis34 and imaging.35 The instrumentation for SPR provides illumination of the gold film at the surface plasmon angle and detection of the reflected light. This configuration is similar to that required for measurements of SPCE. The only change needed would be incorporation of an emission filter and a small change in the observation angle due to the different wavelengths for reflection and SPCE.
The similarity of SPR and SPCE suggests that both methods can be used in the same device. The technology for SPR is well developed, as is the surface chemistry needed to localize biomolecules on gold. In the case of SPR the gold surfaces are frequently coated with dextran to provide for more binding sites within the evanescent field. Since SPCE occurs over similar distances a large number of labeled molecules can be located with the light collection volume. Because of these favorable properties and similarities we expect SPCE to become widely used for biomolecule detection.
SPCE has several advantages over total internal reflection (TIRF) measurements. The directional nature of SPCE offers easier detection and background rejection. Also, in the KR mode of excitation the incident light intensity can be significantly reduced.
Acknowledgments
This work was supported by the NIH, the National Center for Research Resources, RR-08119, and National Institute for Biomedical Imaging and Bioengineering, EB-000682.
References and Notes
- 1.Lakowicz JR. Radiative decay engineering: Biophysical and biomedical applications. Anal Biochem. 2001;298:1–24. doi: 10.1006/abio.2001.5377. [DOI] [PMC free article] [PubMed] [Google Scholar]
- 2.Lakowicz JR, Shen Y, D’Auria S, Malicka J, Gryczynski Z, Gryczynski I. Radiative decay engineering 2: Effects of silver island films on fluorescence intensity, lifetimes and resonance energy transfer. Anal Biochem. 2002;301:261–277. doi: 10.1006/abio.2001.5503. [DOI] [PMC free article] [PubMed] [Google Scholar]
- 3.Malicka J, Gryczynski I, Fang J, Lakowicz JR. Fluorescence spectral properties of cyanine dye-labeled DNA oligomers on surfaces coated with silver particles. Anal Biochem. 2003;317:136–146. doi: 10.1016/S0003-2697(03)00005-8. [DOI] [PMC free article] [PubMed] [Google Scholar]
- 4.Malicka J, Gryczynski I, Kusba J, Lakowicz JR. Effects of metallic silver island films on resonance energy transfer between Cy3 and Cy5- labeled DNA. Biopolymers. 2003;70:595–603. doi: 10.1002/bip.10507. [DOI] [PMC free article] [PubMed] [Google Scholar]
- 5.Gryczynski I, Malicka J, Shen Y, Gryczynski Z, Lakowicz JR. Multiphoton excitation of fluorescence near metallic particles: enhanced and localized excitation. J Phys Chem B. 2002;106:2191–2195. doi: 10.1021/jp013013n. [DOI] [PMC free article] [PubMed] [Google Scholar]
- 6.Lakowicz JR, Malicka J, Gryczynski I, Gryczynski Z, Geddes CD. Radiative Decay Engineering: The role of photonic mode density in biotechnology. J Phys D: Appl Phys. 2003;36:R240–R249. doi: 10.1088/0022-3727/36/14/203. [DOI] [PMC free article] [PubMed] [Google Scholar]
- 7.Barnes WL. Topical review. Fluorescence near interfaces: the role of photonic mode density. J Mod Opt. 1998;45(4):661–699. [Google Scholar]
- 8.Lakowicz JR, Malicka J, Gryczynski I, Gryczynski Z. Directional surface plasmon-coupled emission: a new method for high sensitivity detection. Biochem Biophys Res Commun. 2003;307:435–439. doi: 10.1016/S0006-291X(03)01214-2. [DOI] [PMC free article] [PubMed] [Google Scholar]
- 9.Lakowicz JR. Radiative decay engineering 3. Surface plasmon-coupled directional emission. Anal Biochem. 2004;324:153–169. doi: 10.1016/j.ab.2003.09.039. [DOI] [PMC free article] [PubMed] [Google Scholar]
- 10.Gryczynski I, Malicka J, Gryczynski Z, Lakowicz JR. Radiative decay engineering 4. Experimental studies of surface plasmon-coupled directional emission. Anal Biochem. 2004;324:170–182. doi: 10.1016/j.ab.2003.09.036. [DOI] [PMC free article] [PubMed] [Google Scholar]
- 11.Du H, Disney MD, Miller BL, Krauss TD. Hybridization-based unquenching of DNA hairpins on Au surfaces: prototypical “molecular beacon” biosensors. J Am Chem Soc. 2003;125:4012–4013. doi: 10.1021/ja0290781. [DOI] [PubMed] [Google Scholar]
- 12.Dubertret B, Calame M, Libchaber AJ. Single-mismatch detection using gold-quenched fluorescent oligonucleotides. Nat Biotechnol. 2001;19:365–370. doi: 10.1038/86762. [DOI] [PubMed] [Google Scholar]
- 13.Dulkeith E, Morteani AC, Niedereichholz T, Klar TA, Feldmann J, Levi SA, van Veggel FCJM, Reinhoudt DN. Fluorescence quenching of dye molecules near gold nanoparticles: Radiative and nonradiative effects. Phys Rev Lett. 2002;89(20):203002–1–203002–4. doi: 10.1103/PhysRevLett.89.203002. [DOI] [PubMed] [Google Scholar]
- 14.Liu L, Wang T, Li J, Guo ZX, Dai L, Zhang D, Zhu D. Self-assembly of gold nanoparticles to carbon monoxide using a thiol-terminated pyrene as interlinker. Chem Phys Lett. 2003;367:747–752. [Google Scholar]
- 15.Aslan K, Pérez-Luna VH. Surface modification of colloidal gold by chemisorption of alkanethiols in the presence of a nonionic surfactant. Langmuir. 2002;18:6059–6065. [Google Scholar]
- 16.Li Z, Jin R, Mirkin CA, Letsinger RL. Multiple thiol-anchor capped DNA-gold nanoparticle conjugates. Nucl Acid Res. 2002;30(7):1668–1562. doi: 10.1093/nar/30.7.1558. [DOI] [PMC free article] [PubMed] [Google Scholar]
- 17.Letsinger RL, Elghanian R, Viswanadham G, Mirkin CA. Use of a steroid cyclic disulfide anchor in constructing gold nanoparticle-oligonucleotide conjugates. Bioconj Chem. 2000;11:289–291. doi: 10.1021/bc990152n. [DOI] [PubMed] [Google Scholar]
- 18.Tsao MW, Pfeifer KH, Rabolt JF, Castner DG, Haussling L, Ringsdorf H. Formation and characterization of self-assembled films of thiol-derivatized poly(dimethylsiloxane) on gold. Macromolecules. 1997;30:5913–5919. [Google Scholar]
- 19.Raether H. Surface Plasmons on Smooth and Rough Surfaces and on Gratings. Springer-Verlag; New York: 1988. p. 136. [Google Scholar]
- 20.Forstmann F, Gerhardts RR. Metal Optics Near the Plasma Frequency. Vol. 109. Springer-Verlag; Berlin, Germany: 1986. p. 132. [Google Scholar]
- 21.Kurihara K, Suzuki K. Theoretical understanding of an absorption-based surface plasmon resonance sensor based on Kretschmann’s theory. Anal Chem. 2002;74:696–701. doi: 10.1021/ac010820+. [DOI] [PubMed] [Google Scholar]
- 22.Salamon Z, Macleod HA, Tollin G. Surface plasmon resonance spectroscopy as a tool for investigating the biochemical and biophysical properties of membrane protein systems. I: Theoretical principles. Biochim Biophys Acta. 1997;1331:117–129. doi: 10.1016/s0304-4157(97)00004-x. [DOI] [PubMed] [Google Scholar]
- 23.Raether H. Surface plasma oscillations and their applications. In: Hass G, Francombe MH, Hoffman RW, editors. Physics of Thin Films, Advances in Research and Development. Vol. 9. Academic Press; New York: 1977. pp. 145–261. [Google Scholar]
- 24.Pockrand I. Surface plasma oscillations at silver surfaces with thin transparent and absorbing coatings. Surf Sci. 1978;72:577–588. [Google Scholar]
- 25.Nelson BP, Frutos AG, Brockman JM, Corn RM. Near-infrared surface plasmon resonance measurements of ultrathin films. 1. Angle shift and SPR imaging experiments. Anal Chem. 1999;71:3928–3934. [Google Scholar]
- 26.TFCalc. Software Spectra; Portland, OR: [Google Scholar]
- 27.Laczko G, Lakowicz JR, Gryczynski I, Gryczynski Z, Malak K. A 10-GHz frequency domain fluorometer. Rev Sci Instrum. 1990;61:233–2337. [Google Scholar]
- 28.Lakowicz JR, Laczko G, Cherek H, Gratton E, Limkeman M. Analysis of fluorescence decay kinetics from variable frequency phase shift and modulation data. Biophys J. 1984;46:463–477. doi: 10.1016/S0006-3495(84)84043-6. [DOI] [PMC free article] [PubMed] [Google Scholar]
- 29.Neumann T, Johansson ML, Kambhampati D, Knoll W. Surface-plasmon fluorescence spectroscopy. Adv Funct Mater. 2002;12(9):575–586. [Google Scholar]
- 30.Liebermann T, Knoll W. Surface-plasmon field-enhanced fluorescence spectroscopy. Colloids Surf. 2000;171:115–130. [Google Scholar]
- 31.Meléndez J, Carr R, Bartholomew D, Taneja H, Yee S, Jung C, Furlong C. Development of a surface plasmon resonance sensor for commercial applications. Sens Actuator,s B. 1997;38–39:375–379. [Google Scholar]
- 32.Malmqvist M. BIACORE: An affinity biosensor system for characterization of biomolecular interactions. Biochem Soc Trans. 1999;27:335–340. doi: 10.1042/bst0270335. [DOI] [PubMed] [Google Scholar]
- 33.Cooper MA. Optical biosensors in drug discovery. Nat Rev. 2002;1:515–528. doi: 10.1038/nrd838. [DOI] [PubMed] [Google Scholar]
- 34.Whelan RJ, Zare RN. Surface plasmon resonance detection for capillary electrophoresis separations. Anal Chem. 2003;75:1542–1547. doi: 10.1021/ac0263521. [DOI] [PubMed] [Google Scholar]
- 35.Wegner GJ, Lee HJ, Corn RM. Characterization and optimization of peptide arrays for the study of epitope-antibody interactions using surface plasmon resonance imaging. Anal Chem. 2002;74:5161–5168. doi: 10.1021/ac025922u. [DOI] [PubMed] [Google Scholar]


