

Abstract
Background
Screening has become one of our best tools for early detection and prevention of cancer. The group-randomized trial is the most rigorous experimental design for evaluating multilevel interventions. However, identifying the proper sample size for a group-randomized trial requires reliable estimates of intraclass correlation (ICC) for screening outcomes, which are not available to researchers. We present crude and adjusted ICC estimates for cancer screening outcomes for various levels of aggregation (physician, clinic, and county) and provide an example of how these ICC estimates may be used in the design of a future trial.
Methods
Investigators working in the area of cancer screening were contacted and asked to provide crude and adjusted ICC estimates using the analysis of variance method estimator.
Results
Of the 29 investigators identified, estimates were obtained from 10 investigators who had relevant data. ICC estimates were calculated from 13 different studies, with more than half of the studies collecting information on colorectal screening. In the majority of cases, ICC estimates could be adjusted for age, education, and other demographic characteristics, leading to a reduction in the ICC. ICC estimates varied considerably by cancer site and level of aggregation of the groups.
Conclusions
Previously, only two articles had published ICCs for cancer screening outcomes. We have complied more than 130 crude and adjusted ICC estimates covering breast, cervical, colon, and prostate screening and have detailed them by level of aggregation, screening measure, and study characteristics. We have also demonstrated their use in planning a future trial and the need for the evaluation of the proposed interval estimator for binary outcomes under conditions typically seen in GRTs.
Screening has become one of our best tools for early detection and prevention of breast, cervical, and colorectal cancers. Despite periodic modifications of specific recommendations, these screening tests continue to include the following: mammography for breast cancer; prostate-specific antigen for prostate cancer; the Papanicolaou test and testing for high-risk types of human papillomavirus for cervical cancer, and fecal occult blood test, flexible sigmoidoscopy and colonoscopy for colorectal cancer screening (1,2). In spite of their efficacy, uptake of these screening tests is not optimal, and further outreach and dissemination efforts are needed to inform the community about screening test availability and recommended intervals, to reduce health service access barriers to obtaining screening, and to encourage positive decisions to seek screening (2). Specifically, these issues are particularly apparent in rural communities, such as Appalachia (3–6).
Public health interventions to increase screening include efforts focusing on individuals, the health-care providers, the health-care delivery systems, other organizational groups in the community (churches and work sites), or an entire community (2,4,6,7). When an intervention operates at a group level, when it cannot be delivered to individuals, or when it manipulates the social or physical environment, a cluster or group-randomized trial (GRT) may be employed to evaluate the intervention effects. GRTs are a natural extension of the usual randomized clinical trial; in GRTs, distinct groups rather than individuals are randomly assigned to the intervention or control condition (8,9).
Because the primary goal of a GRT is to compare the treatment conditions which are assigned to groups, not to individuals, the design and analysis of the trial must account for individuals being a member of a group. Group membership is expressed as the correlation among individuals in the same group. Individuals who see the same physician, who go to the same clinic, who work in the same place, or who live in the same community are expected to share some common characteristics creating a positive intraclass correlation (ICC). A positive ICC affects the estimated variance of the intervention effect by a factor of , where is the average number of individuals per group and ρ is the ICC between members of the group (10). For large , the inflation factor may substantially increase the variance, even when ρ is small, as it often is in GRTs.
Identifying the proper sample size for a GRT requires reliable estimates of ICC, which are often not published or easily available to researchers. An underestimated ICC will result in an underpowered study, whereas an inflated ICC will require too many groups to be randomized. Accurate sample size estimates are needed for the efficient and timely use of scarce research funding.
Gathering estimates of relevant ICCs is an important step in planning a GRT. We are aware of only two articles that have published ICCs for cancer screening outcomes (11,12). In this article, we present the results of a study to gather both crude and adjusted ICC estimates for different cancer screening outcomes for various levels of aggregation (physician, clinic, county, and region). Furthermore, we provide an example of how these ICC estimates may be used in the design of a future trial.
Methods
Data Sources
Twenty-nine investigators working in the area of cancer screening were identified based on our experience in cancer screening research and through discussions with officials at the National Cancer Institute; all were contacted via e-mail in February 2009. Each was asked if he or she had access to data on cancer screening outcomes (ever screened, yes/no; screened within guidelines, yes/no) and would be willing to work together to calculate crude and adjusted ICC estimates. Approximately, 2 weeks after the initial e-mail, regular follow-up phone calls began to address investigators’ concerns and to answer questions they had in calculating ICCs. Regular contact continued with each investigator to compile results and to ensure that all calculations were performed in a consistent fashion. All data were approved by the investigators’ local institutional review board.
Cancer Screening Outcomes
For each estimated ICC, collaborating investigators provided details on the study’s design, including the target cancer under study, the percentage of individuals ever screened or screened within guidelines, the type and number of groups, and the number of individuals for each group.
Analysis Methods
To calculate ICC estimates consistently, investigators were asked to estimate ρ via the analysis of variance or analysis of covariance method, which has been shown to perform well for continuous and binary outcomes (13). ICCs were calculated as follows:
where MSbetween is the mean square between groups and MSwithin is the mean square within group, and 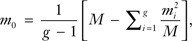 which is a weighted mean group size. The total number of subjects is given by M = ∑i = 1gmi, where mi is the number of subjects in the ith group and g is the number of groups. When possible, unadjusted/crude estimates of ICC, ICC adjusted for age and education, and ICC adjusted for other covariates were provided for each outcome and level of aggregation.
Results
Of the 29 investigators initially contacted, two referred us to their collaborators who were principal investigators of pertinent cancer screening studies; one investigator initially contacted was involved in a research project of a principal investigator already contacted by us. Of the 28 investigators of unique research projects, 10 agreed to collaborate, 11 indicated that they did not have any relevant data to share, three declined to participate because of time constraints, and four did not respond.
From the 10 participating investigators, we received 138 ICC estimates from 12 different studies. Characteristics of each data source are presented in Table 1. More than half of the studies collected information on colorectal and mammography screening, five of the 12 studies collected data on Papanicolaou test screening, whereas only two studies could provide information on prostate cancer screening (prostate-specific antigen). Outcomes were assessed via medical record abstraction/chart review for more than half of the studies, and the majority of studies enrolled participants more than 40 years old.
Table 1.
Study characteristics*
| Study (PI) | Screening outcomes | Study population description | Study population age ranges | Self-report or chart audit |
| V. Champion (14) | Mammography | Patients were recruited from one large HMO and general medicine clinics serving primarily African American indigent patients in the Midwest | 50–85 y | Chart audit |
| Women were eligible if they were overdue or had never received a mammogram | ||||
| Participants went on to be randomized to one of the six groups | ||||
| B. F. Crabtree (15) | Mammography, colonoscopy, PSA | Patients were recruited from 25 primary care practices in New Jersey | ≥50 y | Self-report and chart audit |
| Patients were recruited from each practice waiting room | ||||
| Baseline of the Supporting Colorectal Cancer Outcomes through Participatory Enhancements (SCOPE) study | ||||
| A. Dietrich (16) | Mammography, barium enema, home FOBT, colonoscopy, sigmoidoscopy, Papanicolaou test | Women who were overdue for one or more cancer screening were recruited from community and migrant health centers in New York City | 50–69 y | Chart audit |
| Participants were randomized to receive an intervention or usual care | ||||
| M. Dignan (unpublished data) | Colonoscopy | Primary care practices in rural Kentucky were recruited for the project and were randomized to early or delayed intervention. Patients aged 50 y and older with a recent visit to the practice were selected. At 6- and 18-mo postintervention, new samples of records were reviewed at each practice | ≥50 y | Chart audit |
| Baseline and follow-up data | ||||
| J. Fenton (17,18) | Mammography, barium enema, FOBT, colonoscopy, sigmoidoscopy, PSA | Subjects were enrolled in Group Health, a Washington State health plan Enrollees were included if they were eligible for colorectal, breast, or prostate cancer screening in 2002–2003 |
50–78 y | Chart audit |
| R. Hiatt (19,20) | Mammography, Papanicolaou test | As part of the Breast and Cervical Cancer Intervention Study (BACCIS), low-income women were recruited to participate in an intervention to increase breast and cervical screening to underserved multiethnic populations in the San Francisco Bay Area | 40–75 y | Self-report |
| Women were recruited from public health clinics | ||||
| E. Paskett (6) | Mammography, Papanicolaou test | From the Robeson Health Care Corporation in Robeson County, North Carolina, women were randomly selected to participate in an intervention to improve breast cancer screening | ≥40 y | Self-report |
| Women had to be in need of a mammogram | ||||
| E. Paskett (5) | Papanicolaou test | Participants in the cross-sectional study of Community Awareness, Resources and Education (CARE) project were recruited from four regions and 14 health clinics or private practices in Appalachia, OH | ≥18 y | Chart audit |
| Women were randomly selected from active participant lists for recruitment into the study | ||||
| E. Paskett (3) | Colonoscopy | Minority women in North and South Carolina who were residents of subsidized housing communities were targeted in an effort to improve colorectal cancer screening | ≥50 y | Self-report |
| Eleven cities were grouped into four regions in which a community-based intervention was implemented | ||||
| S. Shariff-Marco (unpublished data) | Modality and flexible sigmoidoscopy | Subjects were enrolled in the 2005 California Health Interviewer Survey | 50–84 y | Self-report |
| K. Stange (21,22) | Mammography, colonoscopy, Papanicolaou test | Primary care practices were recruited to the Enhancing Practice Outcomes through Community and Healthcare Systems (EPOCHS) study, a group-randomized trial to promote quality management through the delivery of evidence-based health care | ≥18 y | Chart audit |
| Practices were recruited from three health-care systems in northeast Ohio | ||||
| E. Yano (23) | Colonoscopy | Patient data from the US Department of Veterans Affairs health-care facilities were reviewed for colorectal screening outcomes | 52–85 y | Chart audit |
FOBT = fecal occult blood test; PSA = prostate-specific antigen.
Table 2 presents crude and adjusted ICCs and further study characteristics. We note that all ICC estimates are from baseline data, except when noted as coming from follow-up. Adjustment for basic demographics (age and education) as well as adjustment for other factors reduced the estimated ICCs in most cases. Adjustment of ICCs (models 2 and 3) most often occurred as a continuous covariate for age and a categorical covariate for education. Exceptions are noted in Table 2. Estimates of ICCs varied considerably by cancer site and by the size of the aggregated group, with larger sized groups tending to have smaller ICCs (24). Adjustment factors considered by investigators, other than age and education, included income, marital status, race, ethnicity, city, insurance status, smoking status, comorbidities, and the number of primary care visits recorded.
Table 2.
Study cancer screening rates and intraclass correlation estimates*
| Site | Group | Method | Outcome | Rate, % | Number of groups | Average No. of members per group | Model1† ICC | Model2† ICC | Model3† ICC | Study |
| Breast | Clinic | CA | Ever screened | 88.4 | 7 | 113 | .0009 | .0006 | — | (14) |
| Breast | Clinic | CA | Screened 6-mo post intervention | 43.9 | 7 | 113 | .0939 | .0912 | — | (14) |
| Breast | Clinic | CA | Screened within guidelines | 35.7 | 25 | 18 | .1444 | .1376 | .1418 | (15) |
| Breast | Clinic | CA | Ever screened | 67.4 | 25 | 18 | .2166 | .2139 | .2149 | (15) |
| Breast | Clinic | CA | Screened during 18-mo intervention period | 62.9 | 10 | 130 | .0047 | .0050‡ | .0034 | (16) |
| Breast | Clinic | CA | Screened within guidelines | 70.0 | 31 | 240 | .0359 | .0351‡ | — | (21,22) |
| Breast | Clinic | CA | Screened one or more times during 2-y period | 64.1 | 33 | 1093 | .0074 | — | .0065 | (17,18) |
| Breast | Clinic | SR | Screened within guidelines | 74.5 | 4 | 215 | .0011 | −.0039 | −.0009 | (6) |
| Breast | Clinic | SR | Screened within guidelines | 68.5 | 25 | 18 | .0449 | .0567 | .0623 | (15) |
| Breast | Clinic | SR | Ever screened | 95.1 | 25 | 18 | .0006 | −.0050 | −.0052 | (15) |
| Breast | Community | SR | Screened within guidelines | 65.0 | 8 | 200 | .0694 | .0518§ | .0053§ | (20) |
| Breast | Community | SR | Screened within guidelines (follow-up) | 66.5 | 8 | 202 | .0281 | .0236§ | −.0008§ | (20) |
| Breast | Community | SR | Ever screened | 75.5 | 8 | 200 | .1080 | .0798§ | .0019§ | (20) |
| Breast | Community | SR | Ever screened (follow-up) | 81.5 | 8 | 202 | .0607 | .0565§ | .0028§ | (20) |
| Breast | Community | SR | Screened three or more times in 5 y | 42.5 | 8 | 200 | .0744 | .0668§ | .0176§ | (20) |
| Breast | Community | SR | Screened three or more times in 5 y (follow-up) | 46.0 | 8 | 202 | .0292 | .0276§ | −.0009§ | (20) |
| Breast | Physician | CA | Screened one or more times during 2-y period | 64.1 | 373 | 100 | .0089 | — | .0077 | (17,18) |
| Cervical | Clinic | CA | Screened during 18-mo intervention period | 74.1 | 10 | 130 | .0253 | .0323‡ | .0253 | (16) |
| Cervical | Clinic | CA | Screened within guidelines | 53.0 | 31 | 240 | .0429 | .0417‡ | — | (21,22) |
| Cervical | Clinic | CA | Screened within guidelines | 67.6 | 14 | 41 | .0624 | .0426 | .0254 | (5) |
| Cervical | Clinic | SR | Screened within guidelines | 53.6 | 4 | 215 | .00001 | −.0023 | −.0011 | (6) |
| Cervical | Community | SR | Screened within guidelines | 76.4 | 8 | 200 | .1911 | .1528§ | .0136§ | (20) |
| Cervical | Community | SR | Screened within guidelines (follow-up) | 80.6 | 8 | 202 | .1001 | .0675§ | .0022§ | (20) |
| Cervical | Community | SR | Ever screened | 89.3 | 8 | 200 | .2920 | .2472§ | .0295§ | (20) |
| Cervical | Community | SR | Ever screened (follow-up) | 91.8 | 8 | 202 | .1772 | .1315§ | .0044§ | (20) |
| Cervical | Region | CA | Screened within guidelines | 67.6 | 4 | 143 | .0309 | .0203 | .0119 | (5) |
| Colon | City | CA | Screened within guidelines | 50.5 | 11 | 83 | .0349 | .0328 | .0195 | (3) |
| Colon | Clinic | CA | Screened within guidelines | 54.0 | 31 | 240 | .0449 | .0453‡ | — | (21,22) |
| Colon | Clinic | CA | Screened during 2-y period | 34.0 | 34 | 1383 | .0100 | — | .0075 | (17,18) |
| Colon | Clinic | CA | Screened within guidelines | 49.0 | 25 | 21 | .046 | .0415 | .0426 | (15) |
| Colon | Clinic | CA | Ever screened | 55.4 | 25 | 21 | .0961 | .0881 | .0911 | (15) |
| Colon | Clinic | CA | Screened up to date (follow-up) | 36.3 | 10 | 130 | .0157 | .0187‡ | .0141 | (16) |
| Colon | Clinic | SR | Screened within guidelines | 67.4 | 25 | 21 | .0005 | −.0055 | −.0038 | (15) |
| Colon | Clinic | SR | Ever screened | 77.3 | 25 | 21 | .0214 | .0132 | .0091 | (15) |
| Colon | County | SR | Screening within guidelines (any modality) | 62.4 | 58 | 339 | .0074 | .0052§ | .0031§ | S. Shariff-Marco‖ |
| Colon | County | SR | Screening within guidelines (flexible sigmoidoscopy) | 25.6 | 58 | 171 | .0314 | .0254§ | .0117§ | S. Shariff-Marco‖ |
| Colon | MSSA | SR | Screening within guidelines (any modality) | 62.4 | 534 | 39 | .0158 | .0113§ | .0058§ | S. Shariff-Marco‖ |
| Colon | MSSA | SR | Screening within guidelines (flexible sigmoidoscopy) | 25.6 | 525 | 20 | .0355 | .0268§ | .0212§ | S. Shariff-Marco‖ |
| Colon | Physician | CA | Screened within guidelines | 29.8 | 65 | 62 | .1814 | .1810‡ | — | M. Dignan‖ |
| Colon | Physician | CA | Screened within guidelines (follow-up) | 30.9 | 63 | 59 | .1254 | .1255‡ | — | M. Dignan‖ |
| Colon | Physician | CA | Ever screened | 28.9 | 65 | 60 | .1010 | .0979‡ | — | M. Dignan‖ |
| Colon | Physician | CA | Ever screened (follow-up) | 32.2 | 63 | 58 | .1339 | .1335‡ | — | M. Dignan‖ |
| Colon | Physician | CA | Screened during 2-y period | 34.0 | 392 | 124 | .0184 | — | .0172 | (17,18) |
| Colon | Region | CA | Screened within guidelines | 50.5 | 4 | 229 | .0265 | .0242 | .0147 | (3) |
| Colon | VA Station | CA | Screened within guidelines | 69.8 | 239 | 130 | .1166 | .1153‡ | .1175 | (23) |
| Prostate | Clinic | CA | Screened one or more times during 2-y period | 34.2 | 30 | 1131 | .0326 | — | .0329 | (17,18) |
| Prostate | Clinic | CA | Screened within guidelines | 35.5 | 25 | 12 | −.0151 | −.0132 | −.0134 | (15) |
| Prostate | Clinic | CA | Ever screened | 57.2 | 25 | 12 | .1181 | .1162 | .1061 | (15) |
| Prostate | Clinic | SR | Screened within guidelines | 59.9 | 25 | 12 | .0139 | −.0114 | −.0116 | (15) |
| Prostate | Clinic | SR | Ever screened | 78.4 | 25 | 12 | .0203 | .0077 | −.0035 | (15) |
| Prostate | Physician | CA | Screened one or more times during 2-y period | 34.2 | 345 | 101 | .0954 | — | .0967 | (17,18) |
All estimates are from baseline data unless otherwise noted. CA = chart audit; MSSA = Medical Service Study Area; SR = self-report; VA = Veterans Affairs.
Model 1: unadjusted ICC; model 2: ICC adjusted for age and education; model 3: ICC adjusted for age, education, and other covariates.
Only age adjusted.
Age adjusted as a categorical covariate.
Unpublished data.
Application of Findings for Trial Design
Details of how to use ICC estimates in sample size calculations for GRTs have been described elsewhere (8,9). Here, we provide a relevant example for potential GRTs in cancer screening. We consider a nested cohort design to examine the effect of a new intervention program to increase colon cancer screening in a diverse urban population of men and women. We plan to implement our intervention in community health clinics and will verify up-to-date colorectal cancer screening via chart review. We expect that approximately 40% of adults in our population are already appropriately screened, and we believe that an increase in this rate by 30%, to 52% screened, would be a reasonable and scientifically meaningful increase. Moreover, we believe that we can recruit at least 25 patients on average from each clinic. The planned analysis of this trial will be via a mixed model analysis of covariance, adjusting for baseline covariates. The sample size formula for this type of trial can be written as follows (8):
Here, gc is the number of clinics per condition, is the average number of individuals per group (clinic), and is the variance of the primary endpoint. The critical values, and will reflect the acceptable Type I and II error rates for this trial, and and reflects one minus the percent of variance reduction expected through regression adjustment for member-level and group-level covariates, respectively.
For example, we may expect that regression adjustment for member-level covariates to reduce variance in our outcome by 10%, and therefore, would be set to .9. Note that conservative estimates of and would be 1. Sample size calculation begins with critical values and set for infinite df. Next, we use the calculated sample size to determine an updated estimate of df and iterate through the calculation updating the critical values appropriately. Given the proposed study's target population and outcome, we will use the ICC estimates from Ferrante et al. (15) for this example (cf Table 2). We calculate sample size as follows allowing the estimated ICC to be .05, , , and a Type I error of 5% and 80% power:
In the above calculation, we began by using the critical values with infinite df. We can recalculate sample size, assuming df equal to 2(21 − 1) = 40.
Once again, we iterate through the sample size calculation updating the df = 2(22 − 1) = 42.
Therefore, we can suggest that with 22 clinics per condition and 25 patients per clinic, we will have 80% power to detect a 12% absolute increase in screening from a baseline of 40% given the above assumptions. To gauge the sensitivity of the calculated sample size to the study assumptions, we vary both the number of patients to be recruited per clinic and the estimated ICC. Because we expect to be able to recruit at least 25 patients per clinic, a reasonable upper value may be 75 patients per clinic. To obtain a range of ICC values, we calculate the one-sided upper 80% confidence interval for the ICC based on the method described by Searle (25) and by Snedecor and Cochran (26). This method was developed for continuous outcomes, and it is unknown if the nominal coverage level is maintained for binary outcomes (27,28). Even so, we use this method here only to provide an approximate range of values for sample size calculation. Further investigation of the properties of this confidence interval method for binary outcomes is needed under conditions typically seen in GRTs. Kieser and Wassmer (29) discuss the use of confidence limits for estimates used in sample size calculation to take into account uncertainty of sample estimates. They confirm that using the upper one-sided 80% confidence limit should guarantee that the planned power be 1 − β, with probability of at least 1 − α. Table 2 provides ICC estimates and their associated number of groups and average number of members per group needed to calculate confidence limits as outlined above. Using the ICC estimate, the associated number of groups, and members from Ferrante et al. (15), we calculate the upper 80% one-sided confidence limit for the ICC to be approximately .08.
Varying these values, Table 3 outlines the required study sample size per condition. In the range specified, increasing the number of individuals enrolled per clinic reduces the number of groups required, although the decrease appears to be less after increasing to 50 patients per clinic (8). In contrast, any increase in ICC contributes substantially to the number of groups per condition needed to detect our hypothesized treatment effect, with 80% power and 5% two-sided probability of Type I error.
Table 3.
Estimated number of groups needed per condition by intraclass correlation (ICC) and average number of subjects per group
| Average No. of subjects per group | ICC |
||
| .05 | .06 | .08 | |
| 25 | 22 | 24 | 28 |
| 50 | 17 | 19 | 23 |
| 75 | 15 | 18 | 22 |
We note that others have suggested varying approaches to account for uncertainty in estimation of the ICC (30–32). Turner et al. use a Bayesian approach that can be extended to combining multiple prior estimates of the ICC. Blitstein et al. (32) developed a method to combine ICC estimates based on techniques common in meta-analysis. Both methods attempt to provide a means to incorporate interstudy heterogeneity and provide investigators the ability to use all data available. Moreover, both authors provide guidance that we find useful for the selection of external ICC estimates (30,32). Available ICCs should be collected from studies that are as similar as possible to the study to be designed. Specifically, it is preferred that the ICC estimates come from studies with a similar endpoint, which use a comparable method of measurement, and are calculated from measurements taken on the same general target population. Furthermore, it is preferable if the design and analysis of the trial from which the ICCs are derived are similar to those of the study being planned (32). Turner et al. (30) relax some of these criteria to incorporate other relevant data sources but allow these to have less influence when combining ICC estimates.
Conclusions
Previously, we had found only two articles with published ICCs for cancer screening outcomes; one of which discussed cervical screening, whereas the other investigated breast cancer screening (11,12). Their reported ICCs fall in line with those presented here (.02–.07) for breast and cervical cancer screening.
Our work makes at least three relevant contributions to the literature. First, we have compiled and described crude and adjusted ICC estimates from 13 studies covering breast, cervical, colon, and prostate screening estimates. Estimates are detailed by level of aggregation, screening measure, and study characteristics. Second, all ICC estimates in Table 2 were calculated in the same manner for consistency. Finally, we have provided an illustration of how these estimates can be used to plan future trials.
There is considerable variation in the ICC estimates both between and within screening types. This is a function of the screening outcome measure, level of aggregation, and overall study design. We note that adjustment for basic demographic characteristics beyond age and education, which are likely available in almost any study, generally aids in reducing the ICC estimate. In fact, in several instances, the point estimate for an ICC fell below zero. In practice, we would recommend using a small positive value for sample size calculation instead of a negative value or zero. As we have done in the above example, investigators can consider calculating the one-sided upper 80% confidence interval for the ICC estimate, which would likely correspond to a small positive number.
We also note that adjustment for covariates can increase the ICC estimate, as it did in a few cases in Table 1. Group-level ICCs can increase as a result of covariate adjustment (8). This can occur when the uneven distribution of a covariate across groups masks what is otherwise a higher level of within-group correlation. When we adjust for the covariate, we remove the mask and the ICC estimate increases.
Although the studies presented should provide a starting point for investigators in planning future studies, it is likely that they will have to do some of their own pilot work to determine the most accurate ICCs for their studies. These pilot ICCs can be combined with published estimates using either of the methods mentioned above to determine a more robust estimate of ICC for sample size determination.
Funding
National Cancer Institute (P50CA105632), the Department of Veterans Affairs (VA) Health Services Research and Development (HSR&D) Service and National Cancer Institute (NCI) Colorectal Cancer (CRC) Quality Enhancement Research Initiative (QUERI) Service–Directed Research (project CRS 02-163) and the HSR&D Service (project IIR 06-087).
Footnotes
The study sponsors had no role in the design of the study, the collection of the data, the analysis or interpretation of the data, the decision to submit the manuscript for publication, or the writing of the manuscript.
References
- 1.Cuzick J. Screening for cancer: future potential. Eur J Cancer. 1999;35(5):685–692. doi: 10.1016/s0959-8049(99)00070-2. [DOI] [PubMed] [Google Scholar]
- 2.Meissner HI, Smith RA, Rimer BK, et al. Promoting cancer screening: learning from experience. Cancer. 2004;101(suppl 5):1107–1117. doi: 10.1002/cncr.20507. [DOI] [PubMed] [Google Scholar]
- 3.Katz ML, Tatum C, Dickinson SL, et al. Improving colorectal cancer screening by using community volunteers: results of the Carolinas cancer education and screening (CARES) project. Cancer. 2007;110(7):1602–1610. doi: 10.1002/cncr.22930. [DOI] [PMC free article] [PubMed] [Google Scholar]
- 4.Pasick RJ, Hiatt RA, Paskett ED. Lessons learned from community-based cancer screening intervention research. Cancer. 2004;101(suppl 5):1146–1164. doi: 10.1002/cncr.20508. [DOI] [PubMed] [Google Scholar]
- 5.Paskett ED, McLaughlin JM, Reiter PL, et al. Psychosocial predictors of adherence to risk-appropriate cervical cancer screening guidelines: a cross sectional study of women in Ohio Appalachia participating in the Community Awareness Resources and Education (CARE) project. Prev Med. 2010;50(1–2):74–80. doi: 10.1016/j.ypmed.2009.09.001. [DOI] [PMC free article] [PubMed] [Google Scholar]
- 6.Paskett ED, Tatum C, Rushing J, et al. Racial differences in knowledge, attitudes, and cancer screening practices among a triracial rural population. Cancer. 2004;101(11):2650–2659. doi: 10.1002/cncr.20671. [DOI] [PMC free article] [PubMed] [Google Scholar]
- 7.Zapka JG, Lemon SC. Interventions for patients, providers, and health care organizations. Cancer. 2004;101(suppl 5):1165–1187. doi: 10.1002/cncr.20504. [DOI] [PubMed] [Google Scholar]
- 8.Murray D. Design and Analysis of Group-Randomized Trials. New York, NY: Oxford University Press; 1998. [Google Scholar]
- 9.Donner A, Klar NS. Design and Analysis of Cluster Randomisation Trials in Health Research. London, United Kingdom: Arnold; 2000. [Google Scholar]
- 10.Kish L. Survey Sampling. New York, NY: J. Wiley; 1965. [Google Scholar]
- 11.Woltman KJ, Newbold KB. Immigrant women and cervical cancer screening uptake: a multilevel analysis. Can J Public Health. 2007;98(6):470–475. doi: 10.1007/BF03405441. [DOI] [PMC free article] [PubMed] [Google Scholar]
- 12.Richards SH, Bankhead C, Peters TJ, et al. Cluster randomised controlled trial comparing the effectiveness and cost-effectiveness of two primary care interventions aimed at improving attendance for breast screening. J Med Screen. 2001;8(2):91–98. doi: 10.1136/jms.8.2.91. [DOI] [PubMed] [Google Scholar]
- 13.Ridout MS, Demetrio CG, Firth D. Estimating intraclass correlation for binary data. Biometrics. 1999;55(1):137–148. doi: 10.1111/j.0006-341x.1999.00137.x. [DOI] [PubMed] [Google Scholar]
- 14.Champion V, Maraj M, Hui S, et al. Comparison of tailored interventions to increase mammography screening in nonadherent older women. Prev Med. 2003;36(2):150–158. doi: 10.1016/s0091-7435(02)00038-5. [DOI] [PubMed] [Google Scholar]
- 15.Ferrante JM, Ohman-Strickland P, Hahn KA, et al. Self-report versus medical records for assessing cancer-preventive services delivery. Cancer Epidemiol Biomarkers Prev. 2008;17(11):2987–2994. doi: 10.1158/1055-9965.EPI-08-0177. [DOI] [PMC free article] [PubMed] [Google Scholar]
- 16.Dietrich AJ, Tobin JN, Cassells A, et al. Telephone care management to improve cancer screening among low-income women: a randomized, controlled trial. Ann Intern Med. 2006;144(8):563–571. doi: 10.7326/0003-4819-144-8-200604180-00006. [DOI] [PMC free article] [PubMed] [Google Scholar]
- 17.Fenton JJ, Cai Y, Weiss NS, et al. Delivery of cancer screening: how important is the preventive health examination? Arch Intern Med. 2007;167(6):580–585. doi: 10.1001/archinte.167.6.580. [DOI] [PMC free article] [PubMed] [Google Scholar]
- 18.Fenton JJ, Franks P, Reid RJ, Elmore JG, Baldwin LM. Continuity of care and cancer screening among health plan enrollees. Med Care. 2008;46(1):58–62. doi: 10.1097/MLR.0b013e318148493a. [DOI] [PubMed] [Google Scholar]
- 19.Hiatt RA, Pasick RJ, Stewart S, et al. Community-based cancer screening for underserved women: design and baseline findings from the breast and cervical cancer intervention study. Prev Med. 2001;33(3):190. doi: 10.1006/pmed.2001.0871. [DOI] [PubMed] [Google Scholar]
- 20.Hiatt RA, Pasick RJ, Stewart S, et al. Cancer screening for underserved women: the breast and cervical cancer intervention study. Cancer Epidemiology, Biomarkers & Prevention: A Publication Of The American Association For Cancer Research, Cosponsored By The American Society Of Preventive Oncology. 2008;17(8):1945–1949. doi: 10.1158/1055-9965.EPI-08-0172. [DOI] [PubMed] [Google Scholar]
- 21.Bobiak SN, Zyzanski SJ, Ruhe MC, et al. Measuring practice capacity for change: a tool for guiding quality improvement in primary care settings. Qual Manag Health Care. 2009;18(4):278–284. doi: 10.1097/QMH.0b013e3181bee2f5. [DOI] [PubMed] [Google Scholar]
- 22.Ruhe MC, Carter C, Litaker D, Stange KC. A Systematic Approach to Practice Assessment and Quality Improvement Intervention Tailoring. Qual Manag Health Care. 2009;18(4):268–277. doi: 10.1097/QMH.0b013e3181bee268. [DOI] [PubMed] [Google Scholar]
- 23.Yano EM, Soban LM, Parkerton PH, Etzioni DA. Primary care practice organization influences colorectal cancer screening performance. Health Serv Res. 2007;42(3 Pt 1):1130–1149. doi: 10.1111/j.1475-6773.2006.00643.x. [DOI] [PMC free article] [PubMed] [Google Scholar]
- 24.Donner A, Koval JJ. Design considerations in the estimation of intraclass correlation. Ann Hum Genet. 1982;46(pt 3):271–277. doi: 10.1111/j.1469-1809.1982.tb00718.x. [DOI] [PubMed] [Google Scholar]
- 25.Searle S. Linear Models. Wiley Series in Probability and Mathematical Statistics. New York, NY: Wiley; 1971. [Google Scholar]
- 26.Snedecor G, Cochran W. Statistical Methods. 8th ed. Ames, IA: The Iowa State University Press; 1989. [Google Scholar]
- 27.Ukoumunne OC. A comparison of confidence interval methods for the intraclass correlation coefficient in cluster randomized trials. Stat Med. 2002;21(24):3757–3774. doi: 10.1002/sim.1330. [DOI] [PubMed] [Google Scholar]
- 28.Donner A. A review of inference procedures for the intraclass correlation coefficient in the one-way random effects model. Int Stat Rev. 1986;54(1):67–82. [Google Scholar]
- 29.Kieser M, Wassmer G. On the use of the upper confidence limit for the variance from a pilot sample for sample size determination. Biom J. 1996;38(8):941–949. [Google Scholar]
- 30.Turner RM, Thompson SG, Spiegelhalter DJ. Prior distributions for the intracluster correlation coefficient, based on multiple previous estimates, and their application in cluster randomized trials. Clin Trials. 2005;2(2):108–118. doi: 10.1191/1740774505cn072oa. [DOI] [PubMed] [Google Scholar]
- 31.Turner RM, Prevost AT, Thompson SG. Allowing for imprecision of the intracluster correlation coefficient in the design of cluster randomized trials. Stat Med. 2004;23(8):1195–1214. doi: 10.1002/sim.1721. [DOI] [PubMed] [Google Scholar]
- 32.Blitstein JL, Hannan PJ, Murray DM, Shadish WR. Increasing the degrees of freedom in existing group randomized trials. Eval Rev. 2005;29(3):241–267. doi: 10.1177/0193841X04273257. [DOI] [PubMed] [Google Scholar]