

Abstract
The oxygen activating mononuclear non-heme ferrous enzymes catalyze a diverse range of chemistry yet typically maintain a common structural motif: two histidines and a carboxylate coordinating the iron center in a facial triad. A new FeII coordinating triad has been observed in two enzymes, diketone cleaving dioxygenase, Dke1, and cysteine dioxygenase (CDO) and is composed of three histidine residues. The effect of this 3 His motif in Dke1 on the geometric and electronic structure of the FeII center is explored via a combination of absorption, CD, MCD and VTVH MCD spectroscopies and DFT calculations. This geometric and electronic structure of the 3 His triad is compared to that of the classical (2-His-1-carboxylate) facial triad in the α-ketoglutarate (αKG) dependent dioxygenases clavaminate synthase 2 (CS2) and hydroxyphenylpyruvate dioxygenase (HPPD). Comparison of the ligand fields at the FeII shows little difference between the 3 His and 2-His-1-carboxylate facial triad sites. Acac, the substrate for Dke1, will also bind to HPPD and is determined to be a strong donor, similar to αKG. The major difference between the 3 His and 2-His-1-carboxylate facial triad sites is in MLCT transitions observed for both types of triads and reflects their difference in charge. These studies provide insight into the effects of perturbation of the facial triad ligation of the non-heme ferrous enzymes on their geometric and electronic structure and their possible contributions to reactivity.
Mononuclear nonheme iron enzymes (MNHFe’s) are an important class that are involved with a wide range of medical, pharmaceutical, and environmental applications. They catalyze a diverse range of chemical reactions, most commonly hydroxylation, but also oxidative ring closure, desaturation, carbon-carbon bond and aromatic ring cleavage, hydrogen atom abstraction and halogenation.(1, 3) The oxygen activating enzymes – that include the extradiol dioxygenases, pterin-dependent dioxygenases, Rieske dioxygenases and α-keto acid dependent dioxygenases – use FeII to activate O2 for attack on the substrate.(1) They usually share a common structural motif for FeII coordination: a protein-derived facial triad composed of two histidine residues and one carboxylate moiety (hereafter referred to as the facial triad).(4, 5) Additionally, along with the substrate, most of these enzymes require a cofactor to deliver the reducing equivalents necessary for reactivity.
Recently, a few exceptions to this facial triad motif have been observed. In the halogenases, the carboxylate is absent and a halogen ion takes its place in the coordination sphere. Diketone-cleaving dioxygenase, Dke1,(6) and cysteine dioxygenase, CDO,(7–9) contain a 3 histidine triad, while carotenoid oxygenase contains a 4 histidine motif. These His-only active site enzymes act directly on their substrates, without the need for a cofactor. Recent work on the NO complex of cys-bound CDO (10) found an S=1/2 site while the facial triad enzyme ES-NO complexes generally have high spin, S=3/2 ground states.(11–13) Thus there can be a ligand field (LF) difference between 3His and facial triad sites and, of course, there are differences between carboxylate and histidine as a ligand. The diketone-cleaving dioxygenase Dke1 from A. johnsonii cleaves acetylacetone (acac) with incorporation of molecular oxygen to yield methyl glyoxal and acetate (Scheme 1).(6) Dke1 will turnover a variety of diketone substrates and their reaction rates correlate with the energy of the HOMO. The substrate binds directly to the FeII site in Dke1 which accelerates the rate of reaction with O2 by ~106-fold. These results indicate the importance of the presence of the FeII-β-diketone complex in O2 reactivity.(14, 15)
Scheme 1.
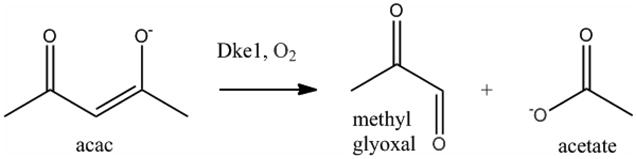
Breakdown of acetylacetone via Dke1
This study elucidates the geometric and electronic structure of the 3 His triad in Dke1 and the effects of the acac ligand in binding to the FeII site. Additionally, the differences between the canonical facial triad motif and the 3 His triad are evaluated with comparisons to two well studied facial triad enzymes, clavaminate synthase (CS2)(16) and hydroxyphenylpyruvate dioxygenase (HPPD)(17, 18). In particular, HPPD was chosen for comparison as previous study has shown that it binds β-diketones.(19)
A combination of spectroscopic techniques and density functional theory (DFT) calculations are used to quantitatively evaluate differences between the 3 His triad and the facial triad. Near IR (NIR) circular dichroism (CD), magnetic circular dichroism (MCD) and variable-temperature, variable field (VTVH) MCD probe the coordination environment and LF at the FeII site as explained in the first section of the results. UV-vis absorption, CD and MCD probe the metal-to-ligand charge transfer (MLCT) transition (of FeII to acac) and give insight into the FeII-acac bond. These studies provide an understanding of the geometric and electronic structure of the 3 His triad in Dke1 and the binding of acac to this FeII site. They also give insight into the utility of the commonly observed facial triad motif in reactivity.7
2. Materials and Methods
2.1 Sample Preparation
Dke1 and HPPD were purified according to previously published procedures.(6, 20, 21) Apo-dke1 and apo-HPPD were exchanged into deuterated buffer (100 mM Tris-HCl or 100 mM HEPES, respectively) at a pD = 7.0 using an Ultrafree-4 filter with a 10kDa cutoff membrane (Millipore) to a concentration of 2–4 mM. All reagents were used as received without further purification. Buffer, acetylacetone, ferrous ammonium sulfate, glycerol-d3 and sucrose were made anaerobic by purging with Ar on a schlenk line. Dke1 and HPPD were made anaerobic by alternating cycles of vacuum and purging with Ar at 273K. All samples were prepared in an inert atmosphere, N2 purged “wet box” to maintain an O2 free environment. Ferrous ammonium sulfate was dissolved in buffer and added to Dke1 or HPPD in microliter quantities to a concentration of 90% of the enzyme (monomer) concentration to avoid free iron in the sample. Acetylacetone was added in microliter quantities to a concentration of 10–25 fold excess over the protein concentration. Glycerol-d3 (~60% v/v) or sucrose (175% w/v) was added to the sample as a glassing agent for MCD measurements, giving a final sample concentration of 1–2 mM. Sucrose was partially deuterated by dissolving in D2O (1:10 w/v) and incubated overnight allowing for proton/deuteron exchange, then lyophilized to remove excess water. CD measurements were taken without and with the presence of the glassing agent to determine if the glassing agent affects the iron site. For Dke1, a small change in the NIR CD signal was observed with glycerol but not with sucrose. However MCD measurements on Dke1 with both glycerol and sucrose were identical, indicating that this conformational change does not reflect a change at the iron site. Furthermore, increasing the concentration of acetylacetone in the sample prevented this change in CD without affecting the MCD data. Data presented for Dke1 are with glycerol as the glassing agent because the resulting data have a better signal to noise ratio than the partially deuterated sucrose. HPPD was not affected by glycerol and all HPPD MCD samples were made with glycerol-d3.
2.2 Spectroscopic studies
NIR (600–2000 nm) CD and MCD spectra were taken on either a Jasco J-200D or Jasco J-730 spectropolarimeter with a liquid N2 cooled InSb detector (Teledyne Judson Technologies) and an Oxford Instruments SM-4000-7T superconducting magnet. UV-vis (300–900 nm) CD and MCD spectra were taken on a Jasco J-810D spectropolarimeter equipped with an extended S20 photomultiplier tube and a SM-4000-7T superconducting magnet. UV-vis Abs spectra were taken on an Agilent 8453 diode array spectrometer. CD and Abs spectra were taken at 278K in an anaerobic cuvette and were corrected for buffer and protein baseline effects by subtraction. Natural CD features and baseline effects were excluded from the MCD spectra by taking the average of the magnitudes of the positive and negative field data. For VTVH MCD, a calibrated Cernox resistor (Lakeshore Cryogenics, calibrated 1.5 – 300 K), inserted into the sample cell, was used for accurate temperature measurement. The VTVH MCD data obtained were normalized to the intensity maximum, and ground state parameters were obtained using previously published procedures.(22, 23)
2.3 Computational methods
The Dke1 active site was modeled using the crystal structure (PDB ID: 3bal) as a starting point. The δ-coordination of one of the histidine residues observed in the crystal structure was preserved. The HPPD active site was modeled using the HPPD-NTBC crystal structure as a starting point (PDB ID: 1t47). Histidine residues were truncated to methyl imidazole and aspartate was truncated to propionate for the models. Constraints imposed by the protein backbone were simulated in both cases by fixing the relative positions of the β-carbons of the backbone. The coordination at the active site was completed with either coordinated water or a monoanionic, bidentately coordinated acetylacetone ligand.
Density functional theory (DFT) calculations were performed using the Gaussian 03 program(24, 25) with the spin unrestricted functional BP86(26) with 10% Hartree-Fock Exchange and under tight convergence criteria. The triple-ξ basis set, 6-311G*, was used to describe the Fe and the conjugated O-C-C-C-O moiety of acetylacetone; the double-ξ basis set, 6-31G*, was used to describe all other atoms. The structures were optimized and found to be stable with no imaginary frequencies > 30 cm−1 (which are associated with the constraints placed on the β-carbons). Effects of the protein environment were included by applying the polarized continuum model (PCM)(27) with a dielectric constant, ε = 4.0, to calculate solvated energies for the complexes. These solvated single point calculations were done with the 6-311+G(2d,p) basis set. The energies given include thermal and Zero-point corrections. Orbital compositions were determined with QMForge(28), and molecular orbitals were visualized with Molden version 4.1(29). Time-dependent DFT (TD-DFT) calculations were performed to compare to the FeII-acac CT spectra and SWizard(30, 31) was used to parse the results.
3. Results
NIR CD and MCD spectroscopy probe the energy splitting of the five d orbitals by the ligand environment.(1) In a symmetric six-coordinate (6C), site the d orbitals split into a ground t2g set and excited eg set separated by ~ 10,000 cm−1 for non-heme ligands. The eg set is further split in energy by the low symmetry protein environment. 6C FeII sites exhibit two transitions in the 10,000 cm−1 region split by ~ 2,000 cm−1. For a five-coordinate site (5C), the splitting is larger leading to transitions in the ~ 10,000 cm−1 and 5,000 cm−1 region. For four-coordinate (4C) sites, the ligand field (LF) is weak leading to transitions in the 5,000 – 7,000 cm−1 region. For the high spin d6 center in Oh symmetry, the extra electron in the t2g orbitals gives a 5T2g ground state. This is also energy split due to the low symmetry of the protein environment leading to a non-Kramers doublet ground state defined by its zero field splitting (ZFS) δ and g|| values. These can be obtained from VTVH MCD data and related to the splitting of the t2g set of d orbitals (Δ, the axial splitting, and V, the rhombic splitting) as described in Ref 23.
3.1 Resting Dke1
The 278 K CD spectrum of apoDke1 is featureless. Upon addition of 0.9 equivalents of FeII, two transitions are observed in the CD spectrum, a positive feature at 8,000 cm−1 and a negative feature at 10,500 cm−1. When cooled to 5K, these features sharpen and shift up in energy to ~9,000 cm−1 and ~11,000 cm−1 (Fig 1A). The 7T, 5K MCD spectrum shows two transitions (Fig 1B, green), centered at 10,100 cm−1, split by 1600 cm−1 These can be resolved into transitions at 9,100 cm−1 and 10,900 cm−1 consistent with the low temperature CD and indicative of a distorted 6C iron center. To characterize the ground state of this 6C site, VTVH MCD data were taken at 8850 cm−1 (arrow in Fig 1B and plotted in Fig 1C). The data fit to a negative zero field splitting with δ = 4.6 ± 0.2 cm−1 and g|| = 9.1 ± 0.3 which leads to Δ = −300 ± 100 cm−1 and |V| = 140 ± 40 cm−1.
Figure 1.

CD/MCD/VTVH MCD of Resting FeII-Dke1. (A) 278K and 5K CD spectra; (B) the 7T, 5K MCD spectrum of Resting FeII Dke1 (green) and CS2 (red); (C) VTVH MCD isotherms taken at 8850 cm−1
A comparison of the MCD spectrum of Dke1 to the MCD spectrum of a ‘typical’ facial triad enzyme, clavaminate synthase (CS2)(16), shows no significant spectral difference (Fig 1B, red). The ground state of Fe-loaded Dke1 also does not show significant differences from the ground state of CS2 (δ = 4.5 ± 0.15 cm−1 and g|| = 9.2 ± 0.1 giving Δ = −400 ± 100 cm−1 and |V| = 190 ± 50 cm−1). These similarities of the resting sites are shown quantitatively in the experimentally-derived ligand field energy level diagram given in Scheme 2 (left).
Scheme 2.

Experimentally derived Ligand Field Diagrams for resting Dke1 and CS2 (left) and acac-bound Dke1 and HPPD (right). For resting Dke1 and CS2, the 5Eg and 5T2g states and splittings are marked in blue. For acac-bound Dke1 and HPPD, the 5Eg and 5T2g states and splittings for the 6C site are marked in green. The 5Eg splitting for the 5C sites is indicated in orange. (The 5T2g splittings for 5C acac-bound Dke1 and HPPD are not shown because the 5T2g splittings for Dke1-acac (5C) could not be obtained as described in the text.)
3.2 Acac-bound Dke1 and HPPD
3.2.1 NIR studies of acac-bound Dke1 and HPPD
Addition of acetylacetone (acac) to FeII-Dke1 leads to a large change in the NIR CD and MCD spectra, most notably, the presence of a LF transition at low energy. The 278K NIR CD spectrum of acac-bound Dke1 (Fig 2A) shows transitions at < 6,000 cm−1 and 13,000 cm−1 with the 13,000 cm−1 peak exhibiting a tail to lower energy. In the corresponding MCD spectrum (Fig 2B), three transitions are clearly observed: a low energy transition at < 6,000 cm−1 and two transitions at 9,300 cm−1 and 11,000 cm−1 with additional asymmetry at the high energy side of the 11,000 cm−1 peak. From this asymmetry and the presence of a strong peak in the CD spectrum on the higher energy side of this band, it can be inferred that there are three transitions in this 8,000 – 13,000 cm−1 energy region. As a single FeII center can have no more than two transitions in the NIR region, the presence of a total of four transitions indicates that more than one species is present. From the low energy band and three transitions in the higher energy region, a 5C and a 6C site are present. The 6C component has two transitions in the 10,000 cm−1 region, and the 5C component has one transition in the ~10,000 cm−1 region and the one transition at < 6,000 cm−1. VTVH MCD data taken at 9025 cm−1 (arrow in Fig 2B and plotted in Figure 2C) fit to a negative zero field split system with ground state splitting parameters of δ = 2.6 ± 0.1 cm−1 and g|| = 9.0 ± 0.1 giving Δ = −850 ± 100 cm−1 and |V| = 400 ± 58 cm−1, consistent with a 6C site but with a weak axial water ligand.2 VTVH MCD data taken at 11,100 cm−1 fit to the same parameters as obtained for the 9025 cm−1 transition (Supporting Figure S1) indicating that these are the two LF transitions of the 6C component. The difference in the ground state splitting parameters between resting Dke1 and the 6C component of Dke1-acac indicates that this 6C component results from having acac-bound and does not reflect unligated resting enzyme. Furthermore, assignment of the two middle transitions to a 6C site allows assignment of the transitions at < 6,000 cm−1 and ~ 13,000 cm−1 to a 5C square pyramidal site. Ground state splitting parameters could not be obtained from VTVH MCD data for the 5C species due to noise in the low energy region and overlap with the 6C site for the higher energy transition.
Figure 2.

CD/MCD/VTVH MCD of acac-bound complexes. (A) and (D) the 278K CD spectra of FeII-Dke1-acac (A) and FeII-HPPD-acac (D); (B) and (E) the 7T, 5K MCD spectra of FeII-Dke1-acac (B) and FeII-HPPD-acac (E); (C) and (F) VTVH MCD isotherms taken at 9025 cm−1 and 8600 cm−1 for Dke1 (C) and HPPD (F), respectively.
To evaluate the effect of the 3His triad relative to the facial triad, spectroscopic studies on an acac-bound facial triad FeII enzyme were also performed. Hydroxyphenylpyruvate dioxygenase (HPPD) was chosen for these studies because the diketone herbicide NTBC, an inhibitor of HPPD, has been shown to bind to its FeII center.(32, 33) The 278K CD spectrum of acac-bound HPPD (Fig 2D) is different from the spectrum of the resting enzyme (Supporting Figure S2)(18) showing one predominant, asymmetric transition at ~ 12,000 cm−1. The 5K, 7T MCD spectrum shows three transitions (Fig 2E): two positive features, at < 5,000 cm−1 and ~ 9,000 cm−1, and a negative feature at ~ 12,000 cm−1. Note that the positive intensity to higher energy is an intense CT transition in the MCD spectrum further described in the next section. Again, the presence of more than two transitions indicates that a mixture of two different FeII sites is present with the low energy positive-high energy negative bands characteristic of a 5C square pyramidal site.3 The middle transition is assigned to a 6C, distorted octahedral component where the second transition is likely masked by the large negative feature from the 5C site. VTVH MCD data for the 6C site taken at ~ 8,600 cm−1 (arrow in Fig 2E and plotted in Fig 2F) are best fit to a positive zero field split system (D = 14 ± 0.5 cm−1 and |E| = 2.7 ± 0.1 cm−1 giving Δ = 300 ± 100 cm−1 and |V| = 192 ± 64 cm−1). These splittings are different from those obtained for the 6C component of resting HPPD(18) indicating that the 6C component of acac-bound HPPD is an acac-bound species and not unreacted resting. VTVH MCD saturation magnetization curves could not be obtained for the low energy band, however, data taken on the negative band at ~ 12,300 cm−1 (Supporting Figure S1) are best fit to a negative zero field split system characteristic of a 5C site (δ = 2.3 ± 0.2 cm−1 and g|| = 8.9 ± 0.1 giving Δ = −1000 ± 100 cm−1 and |V| = 540 ± 60 cm−1). The experimental ligand field energy splittings obtained from the above analysis for both Dke1-acac and HPPD-acac are shown in Scheme 2 (right side).
3.2.2 UV-vis spectra of acac-bound Dke1 and HPPD
The acac-FeII complex of Dke1 has a MLCT transition in the UV-vis region. The UV-vis absorption, CD and MCD spectra (Figure 3) of Dke1-acac and HPPD-acac were obtained to probe this MLCT transition for both classes of NH Fe enzymes with the same substrate. A single, broad transition assigned to this MLCT is observed at ~ 24,000 cm−1 in all three spectra of Dke1-acac. In HPPD-acac, this transition is shifted to lower energy by ~ 1,000 cm−1 and is less intense than the transition in Dke1-acac. A second transition is observed at higher energy (~ 28,000 cm−1) for the acac complexes of both enzymes which is assigned as an intra-ligand transition (vide infra).
Figure 3.

UV-vis absorption/CD/MCD spectra of acac-bound complexes. (A) room temperature absorption spectra, (B) room temperature CD spectra, (C) 7T, 5K MCD spectra of FeII-Dke1-acac (maroon) and FeII-HPPD-acac (teal, x2).
3.3 Nature of the acac-FeII bond
The HOMO of the acac ligand is an out of plane π orbital with maximum density at the central carbon. The LUMO is an out of plane π*orbital with significant carbonyl character (Supporting Figure S3). These orbitals are positioned for good overlap with the FeII center similar to the bonding defined for the α-keto acid moiety in ref 33.
DFT studies of the 3His-acac (Dke1 model) and facial triad-acac (HPPD model) complexes were performed to aid in the assignment of the transitions and the description of bonding. Molecular orbital energy level diagrams (Figure 4, spin unrestricted, α orbitals on left, β orbitals on left) of the 3His- and facial triad-acac complexes show that the acac HOMO and LUMO orbitals are close in energy to the Fe d orbitals. The contours in Figure 5 show that these are oriented to interact with the FeII d orbitals. The amount of acceptor π* LUMO character in the donor dxz orbital reflects the amount of FeII backbonding into the acac ligand, and this backbonding determines the strength of the MCLT transition. From the calculations, the amount of π* character in the donor dxz orbital is similar for both the 3His- and facial triad-acac bound structures (~ 5–6%); however, the experimentally observed MLCT transition of acac-bound Dke1 is more intense than that of acac-bound HPPD (Figure 3). This intensity difference suggests that there is more FeII backbonding with the 3His triad and that the calculations slightly underestimate the overlap in the 3His compared to the facial triad-acac complex.
Figure 4.

Molecular orbital energy level diagrams for 5C 3His-acac and facial triad-acac.
Figure 5.
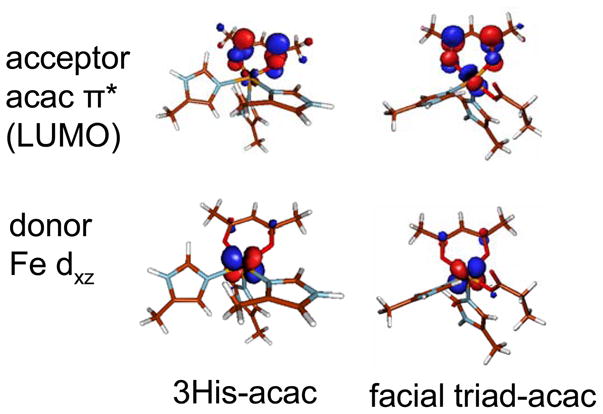
Molecular orbital contours for the donor and acceptor orbitals for MCLT.
Time-dependent DFT (TD-DFT) calculations were performed to correlate to the MLCT transition in the UV-vis absorption spectrum. As both the 5C and 6C sites will contribute to the MLCT transition, spectra were calculated for both coordination numbers in both the 3His- and facial triad-acac models. (All four predicted spectra and the Gaussian resolution of the major bands are in the Supporting Information, Figure S4.) The TD-DFT calculations predict the observed dπ → acac π* MLCT transition and an intraligand (π to π*, acac HOMO → LUMO) transition for the acac-bound models. Additionally, the TD-DFT calculations predict the energy shift observed experimentally with the MLCT transition for the 3His(Dke1)-acac complex higher in energy than this transition in the facial triad(HPPD)-acac complex by ~3,000 cm−1.
Discussion
4.1 The 3His Ligand Field
As imidazole is a stronger field ligand than carboxylate, a change in the FeII coordinating ligand set from a carboxylate oxygen to histidine nitrogen could suggest that the ligand field would change as well. Additionally, the low spin, S=1/2, state that is observed in the cysteine-bound CDO-NO(10) complex potentially also suggests that the ligand field of the 3His may be higher than in the facial triad. However, this in fact is not observed for Dke1 as the experimentally derived ligand field splitting of the d orbitals in Scheme 2 is very similar to that of the ‘typical’ 6C facial triad/H2O coordination observed experimentally in CS2. This reflects that only 1 out of 6 ligand positions is perturbed. Furthermore, DFT calculations with a facial triad-NO complex with cysteine bound in the orientation proposed previously for CDO (coordination through the thiolate and the amine) indicate that the facial triad-cysteine-NO complex would also be low spin. This supports the previous assertion that it is the cysteine ligand that drives the CDO-NO complex to a low spin state.(10) Thus it is unlikely that the ligand field of the 3His triad would significantly affect the spin state energetics along the reaction coordinate relative to the facial triad.4
4.2 The Acac-FeII Bond
Many of the resting facial triad sites are 6C. Comparing a 3 His triad and a facial triad, a 3 His triad is a poorer donor. Thus it is not surprising that the resting site of Dke1 is also found to be 6C (Figure 1). When acac binds, the affinity for water is decreased due to the strong π donation from the acac ligand. Indeed, from the calculated structures, the energy required to remove a H2O ligand (water affinity) for acac-bound Dke1 is lower than for water bound to resting Dke1 by ~2.8kcal/mol (see Supporting Information, Figure S5A–B). So, a 6C to 5C conversion occurs in Dke1 upon acac substrate binding and opens up a coordination position for reaction with O2.
The parallel comparison can be made for the facial triad and αKG. Acac is a similar anionic π donor to αKG, and thus it might be expected that the water affinity in an αKG-bound facial triad would be low. Indeed, calculations predict loss of H2O and the formation of a 5C site with αKG bound (ΔG = −13 kcal/mol, see Supporting Information, Figure S5C). However, from previous spectroscopic and crystallographic studies on αKG dependent enzymes, a 6C site is commonly found for the αKG-bound site. However, in these enzymes, the coordinated water hydrogen bonds to the non-coordinated oxygen of the carboxylate. The calculated water affinity for a hydrogen bonded structure increases 8–9 kcal/mol (ΔG; Figure S5D), in agreement with previously calculated values.(34) This is important for enzymes such as CS2 where uncoupled reactivity would occur if a 5C site is formed with αKG bound before substrate is present. Addition of substrate provides the sterics to eliminate the coordinated water and allow the reaction with O2 in these substrate plus cofactor dependent enzymes. It should be noted that HPPD is a special case because in HPP the α-keto acid is covalently tethered to the substrate and therefore it binds as both the cofactor and substrate. Interestingly, the resting site of HPPD is already partially 5C and it was suggested that the carboxylate of the facial triad in HPPD is poorly oriented for hydrogen bonding with the coordinated water due to interactions from a conserved phenylalanine residue.(18) Thus in HPPD, the site is prearranged to disrupt hydrogen bonding between the facial triad carboxylate and coordinated water allowing HPP and, in the present study, acac to drive the site to go 5C.
4.3 Charge
The dominant difference in the spectra of the 3His relative to the facial triad is in the energy of the MLCT transition, which reflects the charge difference of these two sites. The higher positive charge at the 3His center decreases the energy of the d manifold resulting in the shift to higher energy of its FeII-to-acac MLCT transition (Figure 3). Consistent with a higher positive charge on the FeII of the 3 His triad, studies on the effect of pH on Dke1 showed a depressed pKa for bound water (~8.2) (35) relative to the facial triad which does not show deprotonation in the accessible pH range.
Mechanistic implications can be posited from this difference in charge. First, the differences in charge between the 3His and facial triads could affect the nature of substrate binding in particular for α-keto acid where both mono and dianions are accessible. The facial triad found in the α-keto acid enzymes binds this cofactor as the monoanion. Studies on model complexes by Que and coworkers (36) suggest that a dianionic, enolized α-keto acid would react with O2 to give different cleavage products than the keto form. The proposed mechanism for this reaction would not generate an FeIV=O. However this intermediate is observed and is required in the α-keto acid dependent non-heme Fe enzyme reactivity. The lower positive charge at the active site with a facial triad likely helps stabilize the keto form of this cofactor leading to the required FeIV=O intermediate and subsequent H atom abstraction reactivity.
In summary, the facial triad, as a ligand set for FeII, is conserved throughout most of the oxygen activating class of mononuclear non-heme iron enzymes. The 3His triad in Dke1 presents an opportunity to study, not only the role of the FeII-3His active site in the cleavage of β-diketones, but also to make comparisons to the facial triad ligand set in a functional environment. It has a similar ligand field to the facial triad. While most of the facial triad enzymes require both cofactor and substrate to bind for 6C to 5C conversion, acac binding to the 3His site alone eliminates a coordinated water generating a 5C site and opens a position for O2 reactivity. Finally, the difference in charge between the 3His and facial triad ligand sets, which leads to the major spectral difference observed, could play a key mechanistic role in promoting the proper form of αKG binding and thus O2 reactivity in the facial triad. Future studies will explore the effects of this difference in charge on reactivity.
Supplementary Material
Acknowledgments
This research was supported by NIH Grant GM40392 (EIS) and FWF Grant P18828 (GDS).
- MNHFe
mononuclear non-heme iron enzyme
- Dke1
diketone-cleaving dioxygenase
- CDO
cysteine dioxygenase
- LF
ligand field
- acac
acetylacetone
- CS2
clavaminate synthase 2
- HPPD
hydroxyphenylpyruvate dioxygenase
- DFT
density functional theory
- NIR
near IR
- CD
circular dichroism
- (VTVH) MCD
(variable-temperature, variable-field) magnetic circular dichroism
- MLCT
metal-to-ligand charge transfer
- TD-DFT
time-dependent density functional theory
- ZFS
zero field splitting
Footnotes
The observed splitting of the 5E excited state indicates that the site is 6C. The ground state, however, shows a fairly large axial splitting indicative of an elongation of the axial FeII-H2O bond.(1)
Although most of the ferrous proteins that have been studied only show positively signed d-d transitions in MCD (due to ground state spin orbit coupling, see ref 22), in a few cases a negative higher energy transition is observed. The negative transition arises from spin orbit coupling between the components of the split E excited state due to a distortion of the LF which results in dπ/dσ mixing and occurs in distorted 5C, square pyramidal sites.(2)
The effect of δ versus ε coordination by the His ligand was also examined. No significant geometric, electronic or energetic effects resulted from this change.
Supporting Information Available
Full reference for reference 24; VTVH MCD isotherms for Dke1-acac at 11,100 cm−1 and HPPD-acac at 12,300 cm−1; CD and MCD of resting FeII-HPPD; HOMO and LUMO of free acac; TD-DFT predicted spectra for acac-bound complexes; structures used to calculate water affinity. This material is available free of charge via the Internet at http://pubs.acs.org.
References
- 1.Solomon EI, Brunold TC, Davis MI, Kemsley JN, Lee SK, Lehnert N, Neese F, Skulan AJ, Yang YS, Zhou J. Geometric and electronic structure/function correlations in non-heme iron enzymes. Chem Rev. 2000;100:235–349. doi: 10.1021/cr9900275. [DOI] [PubMed] [Google Scholar]
- 2.Davis MI, Wasinger EC, Decker A, Pau MYM, Vaillancourt FH, Bolin JT, Eltis LD, Hedman B, Hodgson KO, Solomon EI. Spectroscopic and electronic structure studies of 2,3-dihydroxybiphenyl 1,2-dioxygenase: O-2 reactivity of the non-heme ferrous site in extradiol dioxygenases. J Am Chem Soc. 2003;125:11214–11227. doi: 10.1021/ja029746i. [DOI] [PubMed] [Google Scholar]
- 3.Neidig ML, Solomon EI. Structure-function correlations in oxygen activating non-heme iron enzymes. Chem Commun. 2005:5843–5863. doi: 10.1039/b510233m. [DOI] [PubMed] [Google Scholar]
- 4.Koehntop KD, Emerson JP, Que L. The 2-His-1-carboxylate facial triad: a versatile platform for dioxygen activation by mononuclear non-heme iron(II) enzymes. J Biol Inorg Chem. 2005;10:87–93. doi: 10.1007/s00775-005-0624-x. [DOI] [PubMed] [Google Scholar]
- 5.Hegg EL, Que L. The 2-His-1-carboxylate facial triad - An emerging structural motif in mononuclear non-heme iron(II) enzymes. Eur J Biochem. 1997;250:625–629. doi: 10.1111/j.1432-1033.1997.t01-1-00625.x. [DOI] [PubMed] [Google Scholar]
- 6.Straganz GD, Glieder A, Brecker L, Ribbons DW, Steiner W. Acetylacetone-cleaving enzyme Dke1: a novel C-C-bond-cleaving enzyme from Acinetobacter johnsonii. Biochem J. 2003;369:573–581. doi: 10.1042/BJ20021047. [DOI] [PMC free article] [PubMed] [Google Scholar]
- 7.McCoy JG, Bailey LJ, Bitto E, Bingman CA, Aceti DJ, Fox BG, Phillips GN. Structure and mechanism of mouse cysteine dioxygenase. Proc Natl Acad USA. 2006;103:3084–3089. doi: 10.1073/pnas.0509262103. [DOI] [PMC free article] [PubMed] [Google Scholar]
- 8.Yamaguchi K, Hosokawa Y, Kohashi N, Kori Y, Sakakibara S, Ueda I. Rat-Liver Cysteine Dioxygenase (Cysteine Oxidase) - Further Purification, Characterization, and Analysis of Activation and Inactivation. J Biochem. 1978;83:479–491. doi: 10.1093/oxfordjournals.jbchem.a131935. [DOI] [PubMed] [Google Scholar]
- 9.Gardner JD, Pierce BS, Fox BG, Brunold TC. Spectroscopic and Computational Characterization of Substrate-Bound Mouse Cysteine Dioxygenase: Nature of the Ferrous and Ferric Cysteine Adducts and Mechanistic Implications. Biochemistry. 2010 doi: 10.1021/bi100189h. ASAP. [DOI] [PMC free article] [PubMed] [Google Scholar]
- 10.Pierce BS, Gardner JD, Bailey LJ, Brunold TC, Fox BG. Characterization of the nitrosyl adduct of substrate-bound mouse cysteine dioxygenase by electron paramagnetic resonance: Electronic structure of the active site and mechanistic implications. Biochemistry. 2007;46:8569–8578. doi: 10.1021/bi700662d. [DOI] [PubMed] [Google Scholar]
- 11.Brown CA, Pavlosky MA, Westre TE, Zhang Y, Hedman B, Hodgson KO, Solomon EI. Spectroscopic and Theoretical Description of the Electronic-Structure of S=3/2 Iron-Nitrosyl Complexes and Their Relation to O-2 Activation by Nonheme Tron Enzyme Active-Sites. J Am Chem Soc. 1995;117:715–732. [Google Scholar]
- 12.Brown CD, Neidig ML, Neibergall MB, Lipscomb JD, Solomon EI. VTVH-MCD and DFT studies of thiolate bonding to {FeNO}(7)/{FeO2}(8) complexes of isopenicillin N synthase: Substrate determination of oxidase versus oxygenase activity in nonheme Fe enzymes. J Am Chem Soc. 2007;129:7427–7438. doi: 10.1021/ja071364v. [DOI] [PMC free article] [PubMed] [Google Scholar]
- 13.Ye S, Price JC, Barr EW, Green MT, Bollinger JM, Krebs C, Neese F. Cryoreduction of the NO-Adduct of Taurine:α-Ketoglutarate Dioxygenase (TauD) Yields an Elusive {FeNO}8 Species. J Am Chem Soc. 2010;132:4739–4751. doi: 10.1021/ja909715g. [DOI] [PMC free article] [PubMed] [Google Scholar]
- 14.Straganz GD, Hofer H, Steiner W, Nidetzky B. Electronic substituent effects on the cleavage specificity of a non-heme Fe2+-dependent beta-diketone dioxygenase and their mechanistic implications. J Am Chem Soc. 2004;126:12202–12203. doi: 10.1021/ja0460918. [DOI] [PubMed] [Google Scholar]
- 15.Straganz GD, Nidetzky B. Reaction coordinate analysis for beta-diketone cleavage by the non-heme Fe2+-dependent dioxygenase Dke1. J Am Chem Soc. 2005;127:12306–12314. doi: 10.1021/ja042313q. [DOI] [PubMed] [Google Scholar]
- 16.Pavel EG, Zhou J, Busby RW, Gunsior M, Townsend CA, Solomon EI. Circular dichroism and magnetic circular dichroism spectroscopic studies of the non-heme ferrous active site in clavaminate synthase and its interaction with alpha-ketoglutarate cosubstrate. J Am Chem Soc. 1998;120:743–753. [Google Scholar]
- 17.Neidig ML, Decker A, Choroba OW, Huang F, Kavana M, Moran GR, Spencer JB, Solomon EI. Spectroscopic and electronic structure studies of aromatic electrophilic attack and hydrogen-atom abstraction by non-heme iron enzymes. Proc Natl Acad USA. 2006;103:12966–12973. doi: 10.1073/pnas.0605067103. [DOI] [PMC free article] [PubMed] [Google Scholar]
- 18.Neidig ML, Kavana M, Moran GR, Solomon EI. CD and MCD studies of the non-heme ferrous active site in (4-hydroxyphenyl)pyruvate dioxygenase: Correlation between oxygen activation in the extradiol and alpha-KG-dependent dioxygenases. J Am Chem Soc. 2004;126:4486–4487. doi: 10.1021/ja0316521. [DOI] [PubMed] [Google Scholar]
- 19.Brownlee JM, Johnson-Winters K, Harrison DHT, Moran GR. Structure of the ferrous form of (4-hydroxyphenyl)pyruvate dioxygenase from Streptomyces avermitilis in complex with the therapeutic herbicide, NTBC. Biochemistry. 2004;43:6370–6377. doi: 10.1021/bi049317s. [DOI] [PubMed] [Google Scholar]
- 20.Straganz G, Brecker L, Weber HJ, Steiner W, Ribbons DW. A novel beta-diketone-cleaving enzyme from Acinetobacter johnsonii: acetylacetone 2,3-oxygenase. Biochem Biophys Res Comm. 2002;297:232–236. doi: 10.1016/s0006-291x(02)02182-4. [DOI] [PubMed] [Google Scholar]
- 21.Johnson-Winters K, Purpero VM, Kavana M, Nelson T, Moran GR. (4-hydroxyphenyl)pyruvate dioxygenase from Streptomyces avermitilis: The basis for ordered substrate addition. Biochemistry. 2003;42:2072–2080. doi: 10.1021/bi026499m. [DOI] [PubMed] [Google Scholar]
- 22.Pavel EG, Kitajima N, Solomon EI. Magnetic circular dichroism spectroscopic studies of mononuclear non-heme ferrous model complexes. Correlation of excited- and ground-state electronic structure with geometry. Journal of the American Chemical Society. 1998;120:3949–3962. [Google Scholar]
- 23.Solomon EI, Pavel EG, Loeb KE, Campochiaro C. Magnetic Circular-Dichroism Spectroscopy as a Probe of the Geometric and Electronic-Structure of Nonheme Ferrous Enzymes. Coord Chem Rev. 1995;144:369–460. [Google Scholar]
- 24.Frisch MJ, et al. Gaussian03, revision E.01. 2007. [Google Scholar]
- 25.Perdew JP. Density-Functional Approximation for the Correlation-Energy of the Inhomogeneous Electron-Gas. Physical Review B. 1986;33:8822–8824. doi: 10.1103/physrevb.33.8822. [DOI] [PubMed] [Google Scholar]
- 26.Becke AD. Density-Functional Exchange-Energy Approximation with Correct Asymptotic-Behavior. Physical Review A. 1988;38:3098–3100. doi: 10.1103/physreva.38.3098. [DOI] [PubMed] [Google Scholar]
- 27.Cramer CJ, Truhlar DG. Implicit solvation models: Equilibria, structure, spectra, and dynamics. Chem Rev. 1999;99:2161–2200. doi: 10.1021/cr960149m. [DOI] [PubMed] [Google Scholar]
- 28.Tenderholt AL. QMForge, Version 21. [Google Scholar]
- 29.Schaftenaar G, Noordik JH. Molden: a pre- and post-processing program for molecular and electronic structures. J Comput-Aided Mol Des. 2000;14:123–134. doi: 10.1023/a:1008193805436. [DOI] [PubMed] [Google Scholar]
- 30.Gorelsky SI. SWizard program. 2010. [Google Scholar]
- 31.Gorelsky SI, Lever ABP. Electronic structure and spectral, of ruthenium diimine complexes by density functional theory and INDO/S. Comparison of the two methods. J Organomet Chem. 2001;635:187–196. [Google Scholar]
- 32.Kavana M, Purpero VM, Moran GR. Studies of the interaction of streptomyces avermitilis (4-hydroxyphenyl)pyruvate dioxygenase with the specific inhibitor NTBC. J Inorg Biochem. 2003;96:166–166. [Google Scholar]
- 33.Neidig ML, Decker A, Kavana M, Moran GR, Solomon EI. Spectroscopic and computational studies of NTBC bound to the non-heme iron enzyme (4-hydroxyphenyl)pyruvate dioxygenase: Active site contributions to drug inhibition. Biochem Biophys Res Comm. 2005;338:206–214. doi: 10.1016/j.bbrc.2005.08.242. [DOI] [PubMed] [Google Scholar]
- 34.Neidig ML, Brown CD, Light KM, Fujimori DG, Nolan EM, Price JC, Barr EW, Bollinger JM, Krebs C, Walsh CT, Solomon EI. CD and MCD of CytC3 and taurine dioxygenase: Role of the facial triad in alpha-KG-dependent oxygenases. J Am Chem Soc. 2007;129:14224–14231. doi: 10.1021/ja074557r. [DOI] [PMC free article] [PubMed] [Google Scholar]
- 35.Straganz GD, Diebold AR, Egger S, Nidetzky B, Solomon EI. Kinetic and CD/MCD Spectroscopic Studies of the Atypical, Three-His-Ligated, Non-Heme Fe2+ Center in Diketone Dioxygenase: The Role of Hydrophilic Outer Shell Residues in Catalysis. Biochemistry. 2010;49:996–1004. doi: 10.1021/bi901339n. [DOI] [PMC free article] [PubMed] [Google Scholar]
- 36.Paine TK, England J, Que L. Iron-catalyzed C2-C3 bond cleavage of phenylpyruvate with O-2: Insight into aliphatic C-C bond-cleaving dioxygenases. Chem -- Eur J. 2007;13:6073–6081. doi: 10.1002/chem.200601844. [DOI] [PubMed] [Google Scholar]
Associated Data
This section collects any data citations, data availability statements, or supplementary materials included in this article.