Abstract
The perception of object structure in the natural environment is remarkably stable under large variation in image size and projection, especially given our insensitivity to spatial position outside the fovea. Sensitivity to periodic spatial distortions that were introduced into one quadrant of gray-scale natural images was measured in a 4AFC task. Observers were able to detect the presence of distortions in unfamiliar images even though they did not significantly affect the amplitude spectrum. Sensitivity depended on the spatial period of the distortion and on the image structure at the location of the distortion. The results suggest that the detection of distortion involves decisions made in the late stages of image perception and is based on an expectation of the typical structure of natural scenes.
Keywords: structure of natural images, spatial vision, space and scene perception
Introduction
Our ability to recognize objects is remarkably stable even under significant changes in viewing conditions. For example, object recognition is invariant over large changes in the intensity (Jacobsen & Gilchrist, 1988) or color (Rutherford & Brainard, 2002) of illumination. Object (Cutting, 1987) and face (Busey, Brady, & Cutting, 1990) recognition is unimpaired by image slant and we can “mentally rotate” unfamiliar 3D objects and recognize them from novel viewpoints (Shepard & Metzler, 1971; Tarr & Pinker, 1989). Similarly, visual priming (Biederman & Cooper, 1991; Cooper, Biederman, & Hummel, 1992) and perceptual learning (Furmanski & Engel, 2000) experiments show that object recognition is relatively unaffected by large changes in image location, rotation and size. Some forms of random dot abstract pattern recognition however, can be degraded by changes in position of the learned and test images (Dill & Fahle, 1998; Nazir & O’Regan, 1990). Recently, Kingdom, Field, and Olmos (2007) used a Euclidean measure (the total pixel-by-pixel difference between source and distorted images) to quantify human sensitivity to image manipulations. With this metric, they showed that sensitivity to luminance change (the addition of random luminance deviation) was much higher than sensitivity to affine spatial transformations (translation, expansion/contraction, rotation, shear). Collectively, these results suggest that visual objects are represented abstractly within projective geometry that tolerates high levels of representational noise on the dimensions along which real scenes vary most.
A number of multi-scale network models have been proposed that can simulate positional and scale invariance (Hummel & Biederman, 1992; Olshausen, Anderson, & Van Essen, 1995; Wang & Simoncelli, 2005). Electrophysiological recordings from primate brains have identified a proportion of neurons in the inferotemporal cortex with large receptive fields (up to 50°) whose response rates are unaffected by the position or projection of faces or objects presented within their receptive fields (Ito, Tamura, Fujita, & Tanaka, 1995; Logothetis, Pauls, & Poggio, 1995; Tovee, Rolls, & Azzopardi, 1994; Wallis & Rolls, 1997). While the processing that supports such invariance remains unknown, it may not require intensive computational resources because visual pattern recognition is invariant of retinal position even in Drosophila (Tang, Wolf, Xu, & Heisenberg, 2004).
Visual distortions frequently occur in people with visual impairment, and are termed metamorphopsia. Distortions often occur around scotomas in patients with retinal degenerations (Bouwens & Meurs, 2003; Burke, 1999; Cohen et al., 2003; Jensen & Larsen, 1998; Zur & Ullman, 2003) where they are usually associated with physical displacement of photoreceptors that can occur with macular degeneration, epiretinal membranes and macular edema. Visual distortions are also commonly reported in the impaired eye of people with amblyopia (Barrett, Pacey, Bradley, Thibos, & Morrill, 2003; Bedell & Flom, 1981; Bedell, Flom, & Barbeito, 1985; Lagreze & Sireteanu, 1991). Metamorphopsia is typically measured qualitatively with Amsler charts (Amsler, 1947) or their modern variants (Bouwens & Meurs, 2003; Matsumoto et al., 2003; Saito et al., 2000). Where the distortion is monocular, it can be measured with dichoptic pointing tasks that compare the perceived locations of probes presented separately to either eye (Mansouri, Hansen, & Hess, 2009). For progressive diseases, distortions are often self-monitored by asking patients to inspect a printed Amsler grid on a regular basis and to seek attention as soon as a change in its appearance is noticed. Although fewer than 60% of people with macular disease are able to discern their scotoma on an Amsler grid (Crossland & Rubin, 2007; Schuchard, 1993), their widespread clinical use suggests that visual distortions may easier to detect on some backgrounds, (such as the periodic lines of an Amsler grid) than others—notably the natural scenes that are viewed at other times.
A number of research groups have employed radial frequency patterns (Wilkinson, Wilson, & Habak, 1998) to study the perception of periodic structure in experimental images. Complex-shaped closed figures can be synthesized from the sum of a set of simple radial frequency patterns of differing cyclical period, amplitude and phase. Adaptation (Anderson, Habak, Wilkinson, & Wilson, 2007; Bell, Wilkinson, Wilson, Loffler, & Badcock, 2009), masking (Bell, Badcock, Wilson, & Wilkinson, 2007) and sub-threshold summation (Bell & Badcock, 2009) studies suggest that the perception of spatial structure in these patterns is based on the outputs of a set of channels, each of which is selective for a narrow range of radial modulation frequencies. In this paper, visual sensitivity to spatial distortions in natural scenes was examined systematically. Image distortions were introduced into natural scenes with a pixel-remapping algorithm in which the positions of pixels in an undistorted source image were remapped to new locations in a distorted target image, with linear interpolation between pixels. The transform that controls the pixel shifts is represented as a pair of 2D images whose pixel-by-pixel values represent the spatial shift of each source image pixel. One image contains the horizontal shift of each pixel, the second independent image contains the vertical pixel shifts. The transform images have zero mean so that there is no shift in the overall position of the image. This method allows the application of Fourier analysis (Bracewell, 1969) to represent any distortion transform into the linear sum of a set of periodic distortions of differing scale, amplitude and phase and extends studies of radial frequency patterns to real scenes. Based this deconstruction and reconstruction analysis, sensitivity to distortions at different spatial periods was examined. This approach is in direct analogy to the techniques used to analyze sensitivity to spatial structure in complex images (Bex, Mareschal, & Dakin, 2007; Bex & Makous, 2001; Bex, Solomon, & Dakin, 2009) and to identify channels for spatial variation in luminance contrast (Campbell & Robson, 1968) and contour structure (Wilkinson et al., 1998) in the visual system.
Methods
The experiments were completed by the author and two observers who were naïve to the purposes of the study, all had normal or corrected visual acuity and color vision. The procedures adhered to the tenets of the declaration of Helsinki and were approved by an Institutional Internal Review Board. Stimuli were generated on a PC computer using MatLab™ software and employed routines from the PsychToolbox (Brainard, 1997; Pelli, 1997). Stimuli were displayed with a nVidia graphics card driving a LaCieElectron22 monitor with a mean luminance of 50 cd/m2 and a frame rate of 75 Hz. The display measured 23° horizontally (1152 pixels), 18° vertically (864 pixels) and was positioned 86 cm from the observer in a dark room. The luminance gamma functions for red green and blue were measured separately with a Minolta CS100 photometer and were corrected directly in the graphics card’s control panel to produce linear 8-bit resolution per color. The monitor settings were adjusted so that the luminance of green was twice that of red, which in turn was twice that of blue. This shifted the white-point of the monitor to 0.31, 0.28 (x, y) at 50 cd/m2. A “bit-stealing” algorithm (Tyler, 1997) was used to obtain 10.8 bits (1785 unique levels) of luminance resolution under the constraint that no RGB value could differ from the others by more than one look up table level.
Natural images were acquired from commercial DVD movies. These images were selected in favor of other image databases (e.g. van Hateren & van der Schaaf, 1998) because they contained a greater variation of image content, including more people, interior images and man-made objects and fewer close-up images of natural foliage which were considered a more representative sample of everyday natural scenes. Elsewhere, single frames from many different commercial movies (including cartoons) have been examined and it has been shown that with an assumed luminance gamma value of 2 for the camera, their amplitude spectra are comparable to those of images from calibrated databases (Bex, Dakin, & Mareschal, 2005). If there are residual concerns about the use of this class of image rather than those obtained in rural settings, US individuals 12 years and older spend an average of 4.7 hours per day watching television (not including time spent observing computer images and movies, U.S. Census Bureau 2008) and so this class of image represents a significant proportion of natural (or at least ‘everyday’) retinal input.
Movies were extracted as MPeg4 files on a chapter-by-chapter basis, using Handbrake software (http://handbrake.fr/) with compression set to zero. This process generated movie chapter files varying in size from 25 to 643 Mb, depending on chapter duration. Next, each 720*384 RGB frame from each chapter of the movie was acquired using Matlab software and converted from RGB to YUV, which separated luminance and color information. The luminance plane (Y) was then gamma corrected (γ = 2) and scaled to the required RMS contrast. The first and last chapters of each movie were excluded because they often contained overlaid text or scrolling movie credits, otherwise no attempt was made to select images for particular content.
Each trial, a new movie frame was selected at random from all possible frames and chapters and a 384*384 pixel test image was selected at random from the movie frame. The mean luminance of the test image as fixed at that of the background (50 cd/m2) and its global rms contrast (the standard deviation of pixel values divided by the mean) was fixed at 0.5. Pixel values falling outside the range 0 to 255 were clipped at those values. Thus the Michelson contrast of all images therefore approached 1. A test quadrant (upper left, upper right, lower left or lower right) of the test image was selected at random for distortion. The whole image subtended 8° at the 86 cm viewing distance and the center of the distorted region was 2.8° from fixation.
Figure 1 shows representative example images from the experiments in which distortion has been introduced into one quadrant. Spatial distortions were introduced by remapping the pixels of the source image to the distorted image. The remapping was controlled with band-pass filtered noise, newly random each trial, using log exponential filters:
| (1) |
where ω is spatial frequency, ωpeak specifies the peak frequency and b0.5 the half bandwidth of the filter in octaves, which was fixed at 0.5 octaves (full width = 1 octave). The spatial frequency of the band-pass filtered noise was set at 4–64 cpi (1–16 cycles per quadrant) in log steps producing distortions at spatial frequencies from 0.125 to 8 c/deg. The mean value of the band-pass filtered noise was fixed at 0 and its amplitude (−α to +α) controlled the magnitude of distortion—i.e. the size of the displacement of the pixel at each corresponding location. One band-pass filtered random noise sample controlled the horizontal displacement of each pixel and a separate band-pass filtered noise sample (with the same peak spatial frequency and amplitude) controlled the vertical displacement of each pixel. Spatial distortion was smoothly blended into the image with a Gaussian window with a standard deviation of 1°, thus pixel displacements at the edge of the quadrant (±2σ) were ≈0. This ensured that there were no abrupt changes between distorted and undistorted quadrants. Note also that the Gaussian smoothed the magnitude of distortion without changing luminance or contrast. Stimuli were presented for 507 msec, with onset and offset smoothed over 40 msec with a raised cosine contrast envelope.
Figure 1.
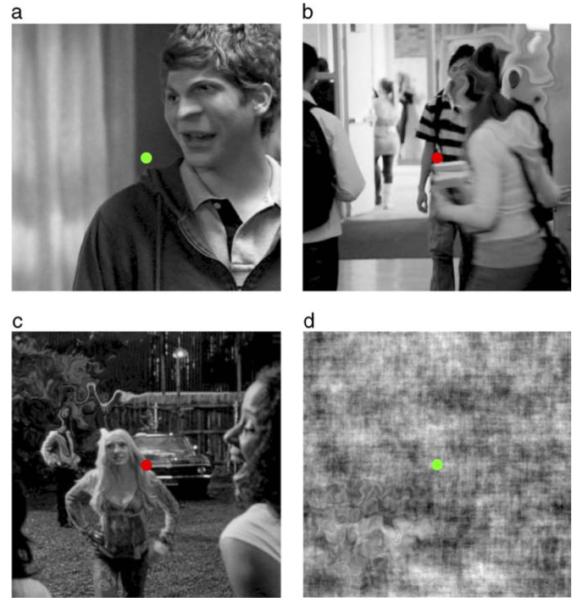
Illustration of Spatial Distortion at different frequencies in one of four quadrants around central fixation in (a–c) real or (d) phase randomized natural images. Distortion was modulated at (a, upper right quadrant) 4 cycles per image (cpi), (b, upper right) 8 cpi, (c, upper left) 16 cpi, or (d, lower left) 32 cpi. Distortions were smoothed within the quadrant with a Gaussian (σ = 1°). Even though these images are probably unfamiliar, the distortion can easily be detected.
Random phase images were identical to real images, except that their phase spectrum was randomized before applying spatial distortion to one randomly selected quadrant. The phase spectrum of the real image was swapped with the phase spectrum of white noise before luminance scaling, so that the relative amplitude spectra (except for small changes arising from contrast rescaling (Badcock, 1990), mean luminance and contrast of real and random-phase images were identical.
The observer’s 4AFC task was to fixate a photometrically isoluminant, 50 cd/m2 central dot, and to identify which of the four quadrants contained the distortion. The color of the fixation dot was used to provide feedback, green for correct, red for incorrect responses. The amplitude of distortion was under the control of a 3-down-1-up staircase (Wetherill & Levitt, 1965), designed to converge at a distortion magnitude producing 79.4% correct responses. The step size of the staircase was initially 2 dB and was reduced to 1 dB after 2 reversals. The raw data from a minimum of four runs for each condition (at least 160 trials per psychometric function) were combined and fit with a cumulative normal function by minimization of chi-square (in which the percent correct at each test distortion amplitude were weighted by the binomial standard deviation based on the number of trials presented at that level). Distortion amplitude thresholds were estimated from the 75% correct point of the best-fitting psychometric function. 95% confidence intervals on this point were calculated with a bootstrap procedure, based on 1000 data sets simulated from the number of experimental trials at each level tested (Foster & Bischof, 1991).
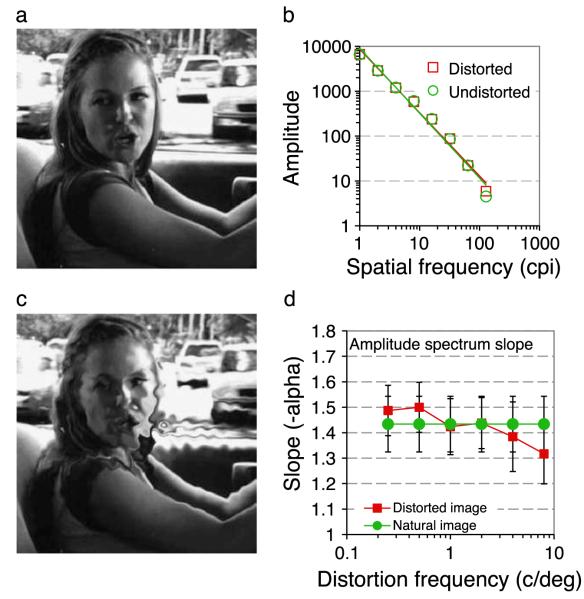
Figure 2 shows the effect of spatial distortions on the amplitude spectra of natural scenes. The amplitude spectrum was computed using the fft2() function in Matlab with the 384 square image zero padded to 512 × 512 pixels and truncated with a circular Tukey window (Ramirez, 1985). The amplitude was summed across all orientations within abrupt one-octave bands centered at 1 to 128 cycles per image in 8 log spaced steps. Log amplitude versus log frequency was fit with linear regression to determine the ‘1/F’ slope, see Figure 2b. This process was repeated for 10,000 randomly selected images. The slope of the amplitude spectrum was compute in this way for the original image (Figure 2a) and with distortions at 6 spatial frequencies (Figure 2c shows 16 cpi). The magnitude of the distortion was fixed at twice the detection threshold determined in Experiment 1. Figure 2d shows the mean slope and ±1 standard deviation at each distortion frequency. There is a tendency for the slope of decrease slightly as distortion frequency increases—i.e. the relative amplitude of high spatial frequencies increases. Nevertheless, the variation in slope across images is greater than the variation introduced by image distortion and slopes of distorted and undistorted images fall within 1 standard deviation of each other.
Figure 2.
Effects of Spatial Distortion on the amplitude spectrum of the image. (a) A natural image with a characteristic “1/F” amplitude spectrum (b, green circles and fit, slope, α = −1.45). Distortion at 16 cpi is clearly visible (c), but has limited effect on the amplitude spectrum (b, red squares and fit, α = −1.41). The mean slopes of 10,000 undistorted (green circles) and distorted (red squares) images at distortion frequencies from to 0.25 to 8 c/deg (1 to 32 cpi) show a small but systematic effect of distortion. Error bars show ±1 standard deviation.
Results and discussion
Experiment 1: Distortion MTFs for real and random phase images
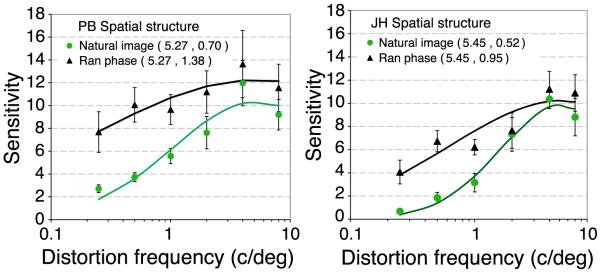
Experiment 1 compared sensitivity to spatial distortion in real and phase-randomized natural scenes. Distortion thresholds are defined as the amplitude of the noise controlling the pixel-by-pixel spatial shifts that produce 75% correct detection of the quadrant containing the distortion. Distortion sensitivity is defined as the inverse of distortion threshold. Figure 3 shows distortion modulation transfer functions (MTFs, i.e. sensitivity as a function of the spatial frequency of distortion) for real (green circles) and phase randomized (black triangles) natural images. The data identify key points. Firstly, subjects are able to detect distortions in images they have never seen before (neither subject had seen the movies before the experiment). This means they must have an expectation about the local spatial structure expected in real and phase randomized natural scenes. The analyses in Figure 2 show that subjects could not reliably detect the presence of distortions by comparing the amplitude spectrum in each quadrant because there is substantial overlap in the slopes generated. Furthermore, Figure 2d shows that low frequency distortions produce a slightly steeper slope (i.e. a relative increase at low spatial frequencies), while high spatial frequency distortions produce a slightly shallower slope (i.e. a relative increase at low spatial frequencies), making the slope an unreliable cue. Secondly, sensitivity to spatial distortion varies with the spatial frequency of the distortion (peaking at around 5.4 c/deg) and where the difference in slope between distorted and undistorted images is very small. Notably sensitivity is lowest for low frequency distortions where the effect of distortion is greatest. Such distortions are probably the most common in the natural environment, arising from image projection changes. This means that observers are least sensitive to distortions caused by affine geometrical transformations that are most common in the natural environment, in good agreement with the conclusion reached by (Kingdom et al., 2007). Thirdly, at all distortion frequencies, subjects were more sensitive to distortions in random-phase images, on average 2.2 times across subjects and conditions. This means that the spatial structure present in natural images obscures the presence of distortions introduced within them.
Figure 3.
Sensitivity for two observers (PB and JH) to spatial distortions in one quadrant of real (green circles) or phase-randomized natural images (black triangles). Distortion sensitivity is defined a the inverse of distortion threshold, which is the positional shift in degrees required for subjects to detect the presence of distortion on 75% trials in a 4AFC task. The x-axis shows the spatial period over which distortion was modulated (see Figure 1 for examples). Error bars show 95% confidence intervals. The curves show the best fitting log Gaussian with the parameters (mean, standard deviation) shown in the caption.
Experiment 2: Band-pass spatial frequency
Experiment 2 examined sensitivity to spatial distortion in natural scenes at individual spatial frequencies. The experiment, stimuli and procedures were the same as in Experiment 1, except that after the spatial distortion had been introduced into one quadrant of the image, the image was band-pass filtered with a one-octave wide spatial frequency filter (Equation 1), centered at 1 to 16 c/deg in log steps. Example stimuli are shown in Figure 4. The observer’s task was to fixate the central dot and to indicate which quadrant contained the distortion. None of our observers was able to perform this task at greater than chance levels (25% correct) at any distortion period or spatial frequency pass band. This surprising result means that while observers could detect distortions in broad-band images, they were unable to detect them at any of the spatial scales from which those images were composed. Note that the distortion was applied to the broad-band source image, before spatial frequency filtering, and so the orientation and phase relationships across spatial scales were preserved. This observation shows that the observer’s decision about the presence of distortion in natural scenes must be based on a representation of the image at a stage later than that at which spatial frequency filter responses are combined.
Figure 4.
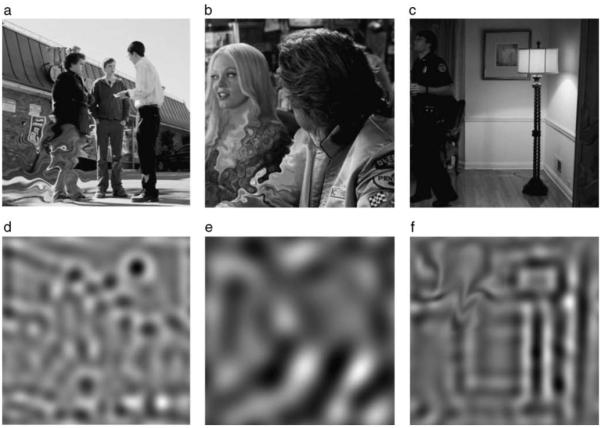
Illustration of band-pass filtering and spatial distortion. Distortions introduced into the lower left quadrant of (a,b) two typical natural images are easily noticed, but could not be detected in band-pass filtered versions of the distorted image (d,e) at any spatial frequency or distortion frequency tested. However, distortions that are introduced (upper left quadrant) after band-pass filtering (c,f) are easily detected from the presence of spatial frequency artifacts outside the pass-band of the band-pass filtered image.
In pilot trials, the experimental image was band-pass filtered before the distortion was introduced in one quadrant of the band-pass filtered image (Figure 4f), however this task was easily performed by noticing the presence of obvious spatial frequency artifacts in the target quadrant that were not present elsewhere in the image. This task therefore became a cross-frequency masking experiment that is not related to the detection of spatial distortion and as such is outside the scope of the present study.
Experiment 3: Retinal eccentricity and image contrast
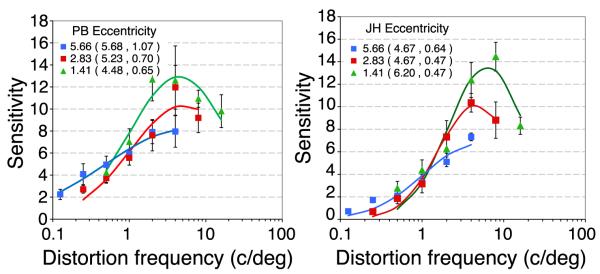
It is well known that many measures of visual function vary with eccentricity and image contrast including acuity (Millidot, 1966) contrast sensitivity (Rovamo, Virsu, & Nasanen, 1978), position discrimination (Levi, Klein, & Aitsebaomo, 1985), crowding (Bouma, 1970) and reading (Legge, Rubin, Pelli, & Schleske, 1985). Experiment 3 examined how sensitivity to distortion varies with eccentricity. The stimuli and procedures were the same as Experiment 1, except that the viewing distance was 43 cm or 172 cm instead of 86 cm so that the distortion was centered at 5.7° or 1.4° respectively. Note that this method meant that the retinal image size increased as eccentricity increased. Figure 5 shows distortion MTFs at three eccentricities for two observers. Sensitivity to fine spatial distortion is reduced in the peripheral visual field, but sensitivity to coarse distortion is relatively invariant of eccentricity and peak tuning shifts to slightly lower distortion frequencies. This suggests that image processing changes to a coarser spatial scale in the peripheral visual field, but is otherwise similar to that in central visual field.
Figure 5.
Distortion MTFs at three retinal eccentricities for two observers (PB and JH). The center of spatial distortion was presented at 1.4° (green triangles), 2.8° (red squares, replotted from Figure 3) or 5.7° (blue squares) at viewing distance of 43 cm, 86 cm or 172 cm respectively. The rms contrast of all stimuli was 0.5. Error bars show 95% confidence intervals. The curves show the best fitting log Gaussian with the parameters (mean, standard deviation) shown in the caption.
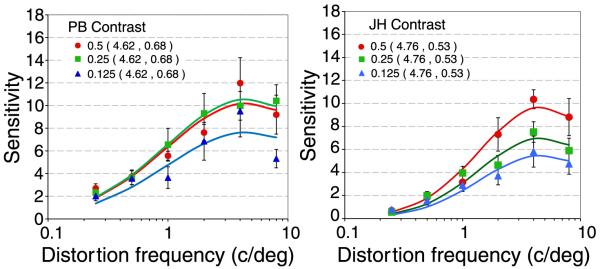
Figure 6 shows how distortion MTFs vary with image contrast. The global rms contrast of the image was fixed at 0.125, 0.25 or 0.5. There is a loss of sensitivity at all distortion frequencies as contrast decreased, with little or no change in tuning.
Figure 6.
Distortion MTFs at three image contrasts for two observers (PB and JH). The global rms contrast of the image (standard deviation of pixel values divided by the mean) was varied between 0.125 (blue triangles), 0.25((green squares) and 0.5, (red circles, reproduced from Figure 3). The center of spatial distortion was 2.8° from fixation. Error bars show 95% confidence intervals. The curves show the best fitting log Gaussian with the parameters (mean, standard deviation) shown in the caption.
Experiment 4: Distortion and spatial structure
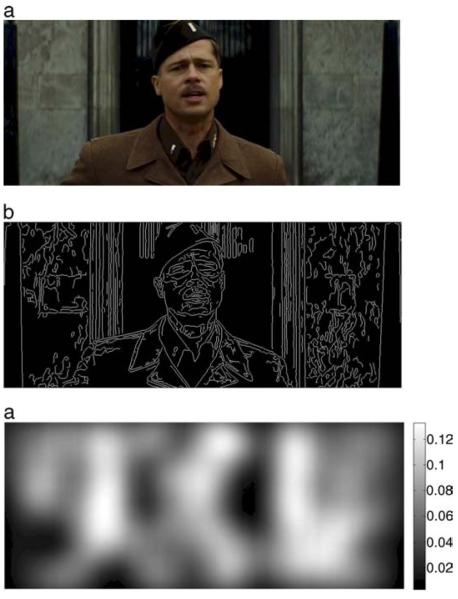
The differences in sensitivity to spatial distortion for real and random phase natural scenes suggests that the spatial structure in natural scenes masks the presence of spatial distortion that is unrelated to the global amplitude spectrum. The observation that distortions could be detected in phase-randomized images, but not in band-pass filtered images whose phase was preserved at the remaining scales indicates a role of grouping across spatial scales. Experiment 4 was therefore designed to examine how the distribution of edges and orientation structure in natural scenes affected distortion MTFs. MatLab’s Canny edge detector was used to identify the location of edge features in each natural image movie frame. Informal inspection showed that this algorithm tended to produce smoother and more complete contours than the alternative edge finding algorithms, which accorded better with introspective assessments of the edges in the images. Figure 7a shows an example image from one of the movies and Figure 7b shows the edge map. There was close agreement in the number and location of edges identified by all the common edge-finding algorithms, so this particular choice should make little difference to the results of the experiment. The algorithm returns a unit output for pixels at the location of edges and zero elsewhere. Such edge maps were then smoothed with a Gaussian whose standard deviation (σx,y) was 2° to match that of the window used to blend the distortion into the image quadrant. The Gaussian-smoothed edge map provided an estimate of local edge density over the stimulus area at all points in the image. An example of such a map is shown in Figure 7c and the color bar shows the local edge density at any point. This edge density map was used to select the location on which to center the distortion. The edge densities tested were from 0.0125 edges per pixel to 0.2 edges per pixel in 5 log steps. This range was selected because it is not possible to detect distortion in homogenous areas, where edge density is zero, and it was usually possible to find a location with high edge density of 0.2 edges/pixel. This range therefore ensured that the required edge densities were present in most images.
Figure 7.
Analysis of local structure in natural scenes. Natural scenes (a) were analyzed with a Canny edge detector to find (b) the location of edges. Edge maps were smoothed with a Gaussian (σx,y = 1°) to generate (c) an estimate of the edge density within the test window. The color bar indicates the number of edge pixels per image pixel. Distortion was centered on the location with the closest match to the required edge density, from 0.0125 to 0.2 edges per image pixel.
The 4AFC paradigm was modified to avoid different numbers of edges occurring in each image quadrant. Therefore instead of introducing distortion into one quadrant of a single image, the same image was presented in each of four locations around fixation. Three of the images were unaltered, the fourth was distorted with the same process used in Experiment 1. See Figure 8 for illustration of the 4AFC stimuli.
Figure 8.
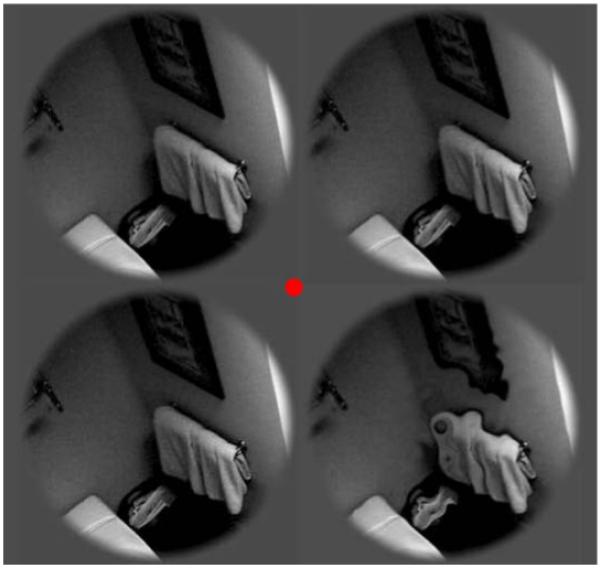
Illustration of 4AFC stimuli used in Experiments 4 and 5.
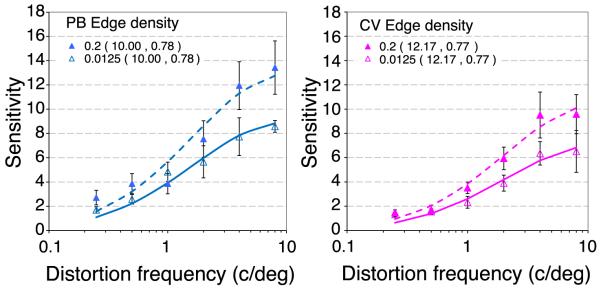
Figure 9 shows distortion MTFs at low (open symbols) or high (filled symbols) edge densities for two observers. The basic tuning of the distortion MTFs is invariant of edge density, however, there is a loss of sensitivity to fine distortion at low edge densities. On the assumption that the local peak spatial frequency would vary with local edge density, it was expected that peak sensitivity to spatial distortion might covary with edge density, however the data provide no evidence to support this.
Figure 9.
Distortion MTFs at low or high local edge densities for two observers (PB, blue, and CV, pink). Spatial distortions were centered on regions of low (0.0125 edges per pixel, filled squares) or high (0.2 edges per pixel, open circles) local edge density. The rms contrast was 0.5 and the images were centered 2.8° from fixation in a 4AFC paradigm (Figure 8). Error bars show 95% confidence intervals. The curves show the best fitting log Gaussian with the parameters (mean, standard deviation) shown in the caption.
Lastly, the role of the local orientation structure at the test location was examined. Observers commented that introspectively, distortions seemed easier to detect when they affected the curvature of otherwise straight edges and seemed less easy to detect on edges that were highly curved or within texture. Geisler, Perry, Super, and Gallogly (2001) examined orientation change along edges that were intensively hand-labeled by human observers, and found that the orientations of nearby points along edges were highly correlated. In order to calculate how local orientation varied across the images employed in the present study, a similar, but automated method was developed to estimate how local orientation structure varies in natural scenes. This estimated local orientation variability was then used to study the relationship between local orientation and sensitivity to distortion. 10000 natural scene patches, each 256 pixels square, were sampled at random from the movie frames. Each was convolved with a bank of Gabor filters:
| (2) |
where spatial frequency (ω) was 2, 4 or 8 c/deg under the present viewing conditions, sθ = xcosθ + ysinθ, orientation (θ) was 0°, 45°, 90° or 135° and the standard deviation of the Gaussian window (σ) was 0.56λ to give a bandwidth of 0.5 octaves. The response magnitude of each filter, R at each point in the image is given by:
| (3) |
At each spatial frequency, the interpolated orientation, at each point in the image is calculated as:
| (4) |
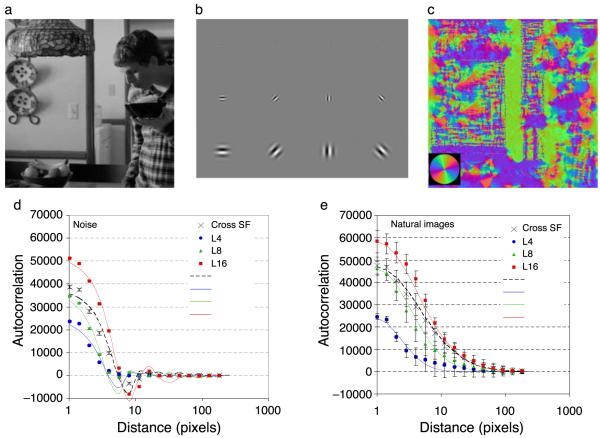
Response magnitudes at each spatial scale were normalized before being combined across scales to give a single orientation estimate for each point in the image, using Equation 4. Figure 10a shows a typical image that was convolved with the bank of sine (Figure 10b) and cosine (not shown) phase complex Gabor filters. The estimated orientation at each point in the image is shown in Figure 10c, with a color-wheel key shown in the inset, and corresponds closely to introspective judgments of the orientation in each area.
Figure 10.
Orientation Structure of Natural Scenes. Natural images (a) were convolved with (b) a bank of Gabor quadrature filter pairs (sine phase shown) at 3 spatial frequencies and 4 orientations. Filter responses were combined to estimate (c) the local orientation at any point in the image (color wheel inset shows key). Autocorrelation functions for orientation images of (d) noise (fit with sinc functions) or (e) real scenes (fit with Gaussian functions) show that estimates of local orientation are correlated across a distance that increases with the size of the Gabor filter whose wavelength (L) was 4 (blue circles), 8 (green triangles) or 16 (red squares) pixels. Crosses show autocorrelation for the orientation estimate combined across spatial frequencies. Error bars show standard deviations across 10,000 images, each 256 pixels square. The local correlation in noise images is entirely due to the spatial integration of the Gabor filters, the much greater correlation of orientation across space in natural images is caused by the presence of elongated contour structure in natural scenes.
MatLab’s autocorrelation function was used to estimate orientation change across the image. The output was collapsed across directions, to provide an overall estimate of the correlation of nearby points in the image. Figures 10d and 10e show that nearby locations in natural scenes and noise tend to be of similar orientation. For noise, this surprising correlation is caused by the spatial integration of the filters and the spatial extent of correlation therefore increases with the filter wavelength. For real images, autocorrelation is greater and extends over a much greater distance before falling to chance levels, in good agreement with previous studies using very different methods (Geisler et al., 2001). The difference between autocorrelation in real scenes and noise can be attributed to the spatial structure of natural scenes, rather than the shape of the filters used to perform this analysis.
Next, local orientation variance was calculated across the image. Standard deviation is computed as:
| (5) |
where θ represents the orientation of each sample and N is the number of samples. This equation was adapted to estimate the local orientation standard deviation at each pixel. For a Gaussian weighted estimate, N = 1, corresponding to the area under a Gaussian. The orientation of each pixel was weighted by a Gaussian over space and time, and this value was used to estimate the local rms contrast of any pixel in the movie. Locations where the local orientation changed rapidly from one pixel to the next produced high local orientation variance estimates, while locations where nearby pixels were similar in orientation produced low orientation variance estimates. Each trial, the image location with either the lowest or the highest local orientation variance estimate for target placement. A 4AFC target detection paradigm was employed, as in Experiment 4a. High and low orientation variance conditions were randomly interleaved in the same run.
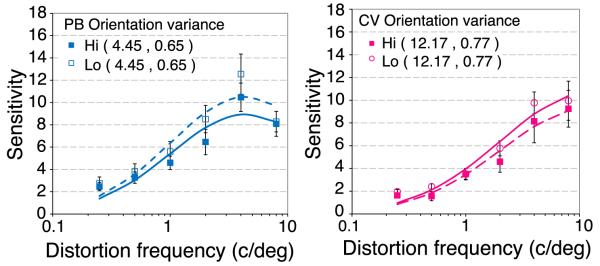
Figure 11 shows distortion MTFs where the distortion is centered on image regions of low (open symbols) or high (filled symbols) local orientation variability. As for edge density (Figure 9), the basic tuning of the distortion MTFs is invariant of orientation variability. Sensitivity to distortion was slightly higher in image areas of low orientation variability (locations in which spatial structure is of generally similar orientation).
Figure 11.
Distortion MTFs in areas of low (open circles) or high (filled squares) local orientation variability for two observers (PB, blue, and CV, pink). The overall rms contrast was 0.25 and the images were centered 2.8° from fixation in a 4AFC paradigm with the same images (Figure 8). Error bars show 95% confidence intervals. The curves show the best fitting log Gaussian with the parameters (mean, standard deviation) shown in the caption.
General discussion
This paper examined the detection of spatial distortions in natural scenes. Introducing such spatial distortions into a natural scene does not significantly affect the overall amplitude spectrum of the image, although highly visible, very fine distortions have a modest whitening effect (see Figure 2d), such that the amplitude of high spatial frequency components increases and the slope of the amplitude spectrum flattens. Nevertheless, observers are able to detect the presence of spatial distortions in images they have not seen before.
These experiments show that sensitivity to spatial distortion depends on the spatial period of the distortion and the spatial structure of the image undergoing distortion as well as its retinal eccentricity and contrast. Across studies, sensitivity to distortions increases with the spatial frequency of distortion, possibly with a peak sensitivity at around 4 c/deg under some conditions. This finding suggests that highest sensitivity to metamorphopsia measured with Amsler grids may be obtained when the viewing distance of the printed grid is such that the bars are separated by approximately 0.25 deg.
Experiment 1 showed that distortions were easier to detect in phase-randomized images than in real scenes. This finding is consistent with the clinical observation that distortions are often noticed by patients with metamorphopsia on Amsler charts (Amsler, 1947) but not during their everyday experience with the natural environment. This suggests that the presence of objects but not simply edges, which are numerous in Amsler charts, in natural images reduces sensitivity to distortions of that structure. In the present study, the global rms contrast of real and random phase stimuli was equated. However, while the contrast of random-phase images is relatively uniform, natural images contain much greater variability in local contrast (Balboa & Grzywacz, 2000; Bex et al., 2009). This means that real images are likely to contain more locally high and low contrast patches than random phase images of the same global rms contrast. Experiment 3 showed that sensitivity to distortion increased with global contrast (Figure 6), which is yet another property of high contrast Amsler grids that improves the detection of distortions within them, and so it is possible that part of the difference between real and random-phase images could be caused by elevated sensitivity at high contrast local patches. However, contrast improved sensitivity mostly for fine distortions, whereas the difference between real and random phase images was greatest at low distortion frequencies, so other factors must also contribute to the difference.
Experiment 4 showed that sensitivity to distortion was higher where edge density was high (Figure 9). However, in good agreement with introspection, edge detectors find few edges in random phase images, so any difference in edge density is not likely to provide a direct account of the differences between real and random-phase images. Finally, local orientation variability is greater in random phase noise images than real images (Figures 10d and 10e), yet sensitivity to distortion was slightly higher in areas of low orientation variance, so this is not likely to explain the difference between real and random-phase images either.
The analysis of the amplitude spectra of distorted and undistorted images shown in Figure 2 means that the task cannot simply be performed by a comparison of the overall amplitude spectra in each quadrant. Slope discrimination thresholds in fovea and parafovea require a change in slope of around 0.12 for images with a slope near −1.4, as in the present study (Hansen & Hess, 2006). This is smaller than the change in slope produced by a distortion whose magnitude is twice that at threshold. It is therefore unlikely that observers performed the task by detecting a change in slope in one quadrant of the image in Experiments 1 and 3, or from the difference in slope of the same image in Experiment 4. Furthermore, the variation in the local slope between and within images (Hansen & Hess, 2006) is much greater than any variation introduced by image distortion, so this property alone could not support reliable identification of the quadrant containing the distortion. Note that in Experiment 4, where the 4AFC paradigm employed the same four images one with a distortion, it might be possible to use differences in the amplitude spectrum, however overall performance under these conditions was comparable to performance in the original 4AFC paradigm with a single large image.
Experiment 3 showed that the detection of spatial distortion shifts to coarser spatial scales in the peripheral visual field (Figure 5). This suggests that image processing for the present task is qualitatively similar across the visual field and that simple size scaling can compensate for vision losses in the peripheral visual field, in good agreement with previous research (Melmoth, Kukkonen, Makela, & Rovamo, 2000).
Experiment 2 showed that observers were unable to detect distortions at greater than chance levels in distorted images that were subsequently band-pass filtered (Figure 4). Note that distortions that are applied after band-pass filtering the image are easy to detect, but this is attributed to the introduction of structure at remote spatial frequencies in the image that may be used to perform the task. This means that the decision about the presence of distortion is made at a relatively late stage of visual processing, once the early narrow-band representations of image structures are recombined. This observation is consistent with studies of the cortical locus at which radial frequency patterns (Wilkinson et al., 1998) are processed in humans. Brain imaging (Wilkinson et al., 2000) and lesion (Gallant, Shoup, & Mazer, 2000) studies suggest that contoured patterns are processed in higher cortical areas, such as V4. The present experiments were not designed to identify narrow-band channels for the detection of distortions, like those reported for radial frequency patterns (Anderson et al., 2007; Bell & Badcock, 2009; Bell et al., 2007, 2009), but the modulation transfer function identified here could be supported by a set of spatial channels. These experiments provide a methodological framework to extend studies of radial frequency patterns (Wilkinson et al., 1998) to natural scenes.
It has been shown elsewhere (Bex, Brady, Fredericksen, & Hess, 1995; Brady, Bex, & Fredericksen, 1997) that motion can be detected for displacements between narrow-band and broad-band images, suggesting that motion perception can be based on filter responses prior to a stage of combination across spatial scales. The present results show that, unlike motion perception, discriminations of spatial form cannot separately access different spatial scales. This implication is consistent with the organizational principles of a number of models of spatial vision. In particular, in the MIRAGE model (Watt & Morgan, 1985), edges are identified at zero bounded regions after the rectified outputs of a set of spatial frequency filters have been summed. Individual filters cannot be separately accessed by the visual system. Likewise, Morrone and Burr (1988) propose that image features are defined by areas of high local amplitude and where local phase is aligned across spatial scales to represent lines and edges, with even and odd-symmetric filters, respectively. In both of these models, image features are not explicit until after filter responses have been combined across spatial scales—this requirement is explicit in MIRAGE and emergent in the phase model. The present results therefore support these properties of spatial vision.
Summary and conclusions
The present results show that sensitivity to spatial distortions in natural images is highly dependent on the local image structure and contrast, on the scale of the distortion and can only be detected at late stages of visual processing. Collectively these results indicate that a decision regarding whether an image is distorted is based on a high-level representation of image structure. Such an abstract representation of images allows visual processing to remain relatively invariant of deformations arising from common changes in projection and occlusion.
Acknowledgments
Supported by R01 EY 019281.
Footnotes
Commercial relationships: none.
References
- Amsler M. L’examen qualitatif de la fonctionmaculaire. Ophthalmologica. 1947;114:248–261. [Google Scholar]
- Anderson ND, Habak C, Wilkinson F, Wilson HR. Evaluating shape after-effects with radial frequency patterns. Vision Research. 2007;47:298–308. doi: 10.1016/j.visres.2006.02.013. PubMed. [DOI] [PubMed] [Google Scholar]
- Badcock DR. Phase- or energy-based face discrimination: Some problems. Journal of Experimental Psychology of Human Perception and Performance. 1990;16:217–220. doi: 10.1037//0096-1523.16.1.217. [DOI] [PubMed] [Google Scholar]
- Balboa RM, Grzywacz NM. Occlusions and their relationship with the distribution of contrasts in natural images. Vision Research. 2000;40:2661–2669. doi: 10.1016/s0042-6989(00)00099-7. PubMed. [DOI] [PubMed] [Google Scholar]
- Barrett BT, Pacey IE, Bradley A, Thibos LN, Morrill P. Nonveridical visual perception in human amblyopia. Investigative Ophthalmology and Visual Science. 2003;44:1555–1567. doi: 10.1167/iovs.02-0515. [PubMed] [Article] [DOI] [PubMed] [Google Scholar]
- Bedell HD, Flom MC. Monocular spatial distortion in strabismic amblyopia. Investigative Ophthalmology and Visual Science. 1981;20:263–268. PubMed. [PubMed] [Google Scholar]
- Bedell HE, Flom MC, Barbeito R. Spatial aberrations and acuity in strabismus and amblyopia. Investigative Ophthalmology and Visual Science. 1985;26:909–916. [PubMed] [Article] [PubMed] [Google Scholar]
- Bell J, Badcock DR. Narrow-band radial frequency shape channels revealed by sub-threshold summation. Vision Research. 2009;49:843–850. doi: 10.1016/j.visres.2009.03.001. PubMed. [DOI] [PubMed] [Google Scholar]
- Bell J, Badcock DR, Wilson H, Wilkinson F. Detection of shape in radial frequency contours: Independence of local and global form information. Vision Research. 2007;47:1518–1522. doi: 10.1016/j.visres.2007.01.006. PubMed. [DOI] [PubMed] [Google Scholar]
- Bell J, Wilkinson F, Wilson HR, Loffler G, Badcock DR. Radial frequency adaptation reveals interacting contour shape channels. Vision Research. 2009;49:2306–2317. doi: 10.1016/j.visres.2009.06.022. PubMed. [DOI] [PubMed] [Google Scholar]
- Bex PJ, Brady N, Fredericksen RE, Hess RF. Energetic motion detection. Nature. 1995;378:670–672. doi: 10.1038/378670b0. PubMed. [DOI] [PubMed] [Google Scholar]
- Bex PJ, Dakin SC, Mareschal I. Critical band masking in optic flow. Network. 2005;16:261–284. doi: 10.1080/09548980500289973. PubMed. [DOI] [PubMed] [Google Scholar]
- Bex PJ, Mareschal I, Dakin SC. Contrast gain control in natural scenes. Journal of Vision. 2007;7(11):12, 1–12. doi: 10.1167/7.11.12. http://journalofvision.org/7/11/12/, doi:10.1167/7.11.12. [PubMed] [Article] [DOI] [PubMed] [Google Scholar]
- Bex PJ, Makous WL. Contrast perception in natural images. Investigative Ophthalmology & Visual Science. 2001;42:3309. [Google Scholar]
- Bex PJ, Solomon SG, Dakin SC. Contrast sensitivity in natural scenes depends on edge as well as spatial frequency structure. Journal of Vision. 2009;9(10):1, 1–19. doi: 10.1167/9.10.1. http://journalofvision.org/9/10/1/, doi:10.1167/9.10.1. [PubMed] [Article] [DOI] [PMC free article] [PubMed] [Google Scholar]
- Biederman I, Cooper EE. Evidence for complete translational and reflectional invariance in visual object priming. Perception. 1991;20:585–593. doi: 10.1068/p200585. PubMed. [DOI] [PubMed] [Google Scholar]
- Bouma H. Interaction effects in parafoveal letter recognition. Nature. 1970;226:177–178. doi: 10.1038/226177a0. PubMed. [DOI] [PubMed] [Google Scholar]
- Bouwens MD, Meurs JC. Sine Amsler Charts: A new method for the follow-up of metamorphopsia in patients undergoing macular pucker surgery. Graefes Archive for Clinical and Experimental Ophthalmology. 2003;241:89–93. doi: 10.1007/s00417-002-0613-5. PubMed. [DOI] [PubMed] [Google Scholar]
- Bracewell . The Fourier transform and its applications. McGraw Hill; New York: 1969. [Google Scholar]
- Brady N, Bex PJ, Fredericksen RE. Independent coding across spatial scales in moving fractal images. Vision Research. 1997;37:1873–1883. doi: 10.1016/s0042-6989(97)00007-2. PubMed. [DOI] [PubMed] [Google Scholar]
- Brainard DH. The Psychophysics Toolbox. Spatial Vision. 1997;10:433–436. PubMed. [PubMed] [Google Scholar]
- Burke W. Psychophysical observations concerned with a foveal lesion (macular hole) Vision Research. 1999;39:2421–2427. doi: 10.1016/s0042-6989(98)00323-x. PubMed. [DOI] [PubMed] [Google Scholar]
- Busey TA, Brady NP, Cutting JE. Compensation is unnecessary for the perception of faces in slanted pictures. Perception & Psychophysics. 1990;48:1–11. doi: 10.3758/bf03205006. PubMed. [DOI] [PubMed] [Google Scholar]
- Campbell FW, Robson JG. Application of Fourier analysis to the visibility of gratings. The Journal of Physiology. 1968;197:551–566. doi: 10.1113/jphysiol.1968.sp008574. [PubMed] [Article] [DOI] [PMC free article] [PubMed] [Google Scholar]
- Cohen SY, Lamarque F, Saucet JC, Provent P, Langram C, LeGargasson JF. Filling-in phenomenon in patients with age-related macular degeneration: Differences regarding uni- or bilaterality of central scotoma. Graefes Archive for Clinical and Experimental Ophthalmology. 2003;241:785–791. doi: 10.1007/s00417-003-0744-3. PubMed. [DOI] [PubMed] [Google Scholar]
- Cooper EE, Biederman I, Hummel JE. Metric invariance in object recognition: A review and further evidence. Canadian Journal of Psychology. 1992;46:191–214. doi: 10.1037/h0084317. PubMed. [DOI] [PubMed] [Google Scholar]
- Crossland M, Rubin G. The Amsler chart: Absence of evidence is not evidence of absence. British Journal of Ophthalmology. 2007;91:391–393. doi: 10.1136/bjo.2006.095315. PubMed. [DOI] [PMC free article] [PubMed] [Google Scholar]
- Cutting JE. Rigidity in cinema seen from the front row, side aisle. Journal of Experimental Psychology of Human Perception and Performance. 1987;13:323–334. doi: 10.1037//0096-1523.13.3.323. PubMed. [DOI] [PubMed] [Google Scholar]
- Dill M, Fahle M. Limited translation invariance of human visual pattern recognition. Perception & Psychophysics. 1998;60:65–81. doi: 10.3758/bf03211918. PubMed. [DOI] [PubMed] [Google Scholar]
- Foster DH, Bischof WF. Thresholds from psychometric functions: Superiority of bootstrap to incremental and probit variance estimators. Psychological Bulletin. 1991;109:152–159. [Google Scholar]
- Furmanski CS, Engel SA. Perceptual learning in object recognition: Object specificity and size invariance. Vision Research. 2000;40:473–484. doi: 10.1016/s0042-6989(99)00134-0. PubMed. [DOI] [PubMed] [Google Scholar]
- Gallant JL, Shoup RE, Mazer JA. A human extrastriate area functionally homologous to macaque V4. Neuron. 2000;27:227–235. doi: 10.1016/s0896-6273(00)00032-5. PubMed. [DOI] [PubMed] [Google Scholar]
- Geisler WS, Perry JS, Super BJ, Gallogly DP. Edge co-occurrence in natural images predicts contour grouping performance. Vision Research. 2001;41:711–724. doi: 10.1016/s0042-6989(00)00277-7. PubMed. [DOI] [PubMed] [Google Scholar]
- Hansen BC, Hess RF. Discrimination of amplitude spectrum slope in the fovea and parafovea and the local amplitude distributions of natural scene imagery. Journal of Vision. 2006;6(7):3, 696–711. doi: 10.1167/6.7.3. http://journalofvision.org/6/7/3/, doi:10.1167/6.7.3. [PubMed] [Article] [DOI] [PubMed] [Google Scholar]
- Hummel JE, Biederman I. Dynamic binding in a neural network for shape recognition. Psychological Review. 1992;99:480–517. doi: 10.1037/0033-295x.99.3.480. PubMed. [DOI] [PubMed] [Google Scholar]
- Ito M, Tamura H, Fujita I, Tanaka K. Size and position invariance of neuronal responses in monkey inferotemporal cortex. Journal of Neurophysiology. 1995;73:218–226. doi: 10.1152/jn.1995.73.1.218. PubMed. [DOI] [PubMed] [Google Scholar]
- Jacobsen A, Gilchrist A. The ratio principle holds over a million-to-one range of illumination. Perception & Psychophysics. 1988;43:1–6. doi: 10.3758/bf03208966. PubMed. [DOI] [PubMed] [Google Scholar]
- Jensen OM, Larsen M. Objective assessment of photoreceptor displacement and metamorphopsia: A study of macular holes. Archives of Ophthalmology. 1998;116:1303–1306. doi: 10.1001/archopht.116.10.1303. PubMed. [DOI] [PubMed] [Google Scholar]
- Kingdom FA, Field DJ, Olmos A. Does spatial invariance result from insensitivity to change? Journal of Vision. 2007;7(14):11, 1–13. doi: 10.1167/7.14.11. http://journalofvision.org/7/14/11/, doi:10.1167/7.14.11. [PubMed] [Article] [DOI] [PubMed] [Google Scholar]
- Lagreze WD, Sireteanu R. Two-dimensional spatial distortions in human strabismic amblyopia. Vision Research. 1991;31:1271–1288. doi: 10.1016/0042-6989(91)90051-6. PubMed. [DOI] [PubMed] [Google Scholar]
- Legge GE, Rubin GS, Pelli DG, Schleske MM. Psychophysics of reading: II. Low vision. Vision Research. 1985;25:253–265. doi: 10.1016/0042-6989(85)90118-x. PubMed. [DOI] [PubMed] [Google Scholar]
- Levi DM, Klein SA, Aitsebaomo AP. Vernier acuity, crowding and cortical magnification. Vision Research. 1985;25:963–977. doi: 10.1016/0042-6989(85)90207-x. PubMed. [DOI] [PubMed] [Google Scholar]
- Logothetis NK, Pauls J, Poggio T. Shape representation in the inferior temporal cortex of monkeys. Current Biology. 1995;5:552–563. doi: 10.1016/s0960-9822(95)00108-4. PubMed. [DOI] [PubMed] [Google Scholar]
- Mansouri B, Hansen BC, Hess RF. Disrupted retinotopic maps in amblyopia. Investigative Ophthalmology and Vision Science. 2009;50:3218–3225. doi: 10.1167/iovs.08-2914. PubMed. [DOI] [PubMed] [Google Scholar]
- Matsumoto C, Arimura E, Okuyama S, Takada S, Hashimoto S, Shimomura Y. Quantification of metamorphopsia in patients with epiretinal membranes. Investigative Ophthalmology and Vision Science. 2003;44:4012–4016. doi: 10.1167/iovs.03-0117. PubMed. [DOI] [PubMed] [Google Scholar]
- Melmoth DR, Kukkonen HT, Makela PK, Rovamo JM. Scaling extrafoveal detection of distortion in a face and grating. Perception. 2000;29:1117–1126. doi: 10.1068/p2945. PubMed. [DOI] [PubMed] [Google Scholar]
- Millidot M. Foveal and extra-foveal acuity with and without stabilized retinal images. British Journal of Physiological Optics. 1966;23:75–106. PubMed. [PubMed] [Google Scholar]
- Morrone MC, Burr DC. Feature detection in human vision: A phase-dependent energy model. Proceedings of the Royal Society, London B Biological Sciences. 1988;235:221–245. doi: 10.1098/rspb.1988.0073. PubMed. [DOI] [PubMed] [Google Scholar]
- Nazir TA, O’Regan JK. Some results on translation invariance in the human visual system. Spatial Vision. 1990;5:81–100. doi: 10.1163/156856890x00011. [DOI] [PubMed] [Google Scholar]
- Olshausen BA, Anderson CH, Van Essen DC. A multiscale dynamic routing circuit for forming size- and position-invariant object representations. Journal of Computational Neuroscience. 1995;2:45–62. doi: 10.1007/BF00962707. PubMed. [DOI] [PubMed] [Google Scholar]
- Pelli DG. The VideoToolbox software for visual psychophysics: Transforming numbers into movies. Spatial Vision. 1997;10:437–442. PubMed. [PubMed] [Google Scholar]
- Ramirez RW. The FFT, fundamentals and concepts. Prentice-Hall; New Jersey: 1985. [Google Scholar]
- Rovamo J, Virsu V, Nasanen R. Cortical magnification factor predicts the photopic contrast sensitivity of peripheral vision. Nature. 1978;271:54–56. doi: 10.1038/271054a0. [DOI] [PubMed] [Google Scholar]
- Rutherford MD, Brainard DH. Lightness constancy: A direct test of the illumination-estimation hypothesis. Psychology Science. 2002;13:142–149. doi: 10.1111/1467-9280.00426. [DOI] [PubMed] [Google Scholar]
- Saito Y, Hirata Y, Hayashi A, Fujikado T, Ohji M, Tano Y. The visual performance and metamorphopsia of patients with macular holes. Archives of Ophthalmology. 2000;118:41–46. doi: 10.1001/archopht.118.1.41. PubMed. [DOI] [PubMed] [Google Scholar]
- Schuchard RA. Validity and interpretation of Amsler grid reports. Archives of Ophthalmology. 1993;111:776–780. doi: 10.1001/archopht.1993.01090060064024. PubMed. [DOI] [PubMed] [Google Scholar]
- Shepard RN, Metzler J. Mental rotation of three-dimensional objects. Science. 1971;171:701–703. doi: 10.1126/science.171.3972.701. PubMed. [DOI] [PubMed] [Google Scholar]
- Tang S, Wolf R, Xu S, Heisenberg M. Visual pattern recognition in Drosophila is invariant for retinal position. Science. 2004;305:1020–1022. doi: 10.1126/science.1099839. PubMed. [DOI] [PubMed] [Google Scholar]
- Tarr MJ, Pinker S. Mental rotation and orientation-dependence in shape recognition. Cognitive Psychology. 1989;21:233–282. doi: 10.1016/0010-0285(89)90009-1. PubMed. [DOI] [PubMed] [Google Scholar]
- Tovee MJ, Rolls ET, Azzopardi P. Translation invariance in the responses to faces of single neurons in the temporal visual cortical areas of the alert macaque. Journal of Neurophysiology. 1994;72:1049–1060. doi: 10.1152/jn.1994.72.3.1049. PubMed. [DOI] [PubMed] [Google Scholar]
- Tyler CW. Colour bit-stealing to enhance the luminance resolution of digital displays on a single pixel basis. Spatial Vision. 1997;10:369–377. doi: 10.1163/156856897x00294. PubMed. [DOI] [PubMed] [Google Scholar]
- van Hateren JH, van der Schaaf A. Independent component filters of natural images compared with simple cells in primary visual cortex. Proceedings of the Royal Society of London B. 1998;265:359–366. doi: 10.1098/rspb.1998.0303. [PubMed] [Article] [DOI] [PMC free article] [PubMed] [Google Scholar]
- Wallis G, Rolls ET. Invariant face and object recognition in the visual system. Progressive Neurobiology. 1997;51:167–194. doi: 10.1016/s0301-0082(96)00054-8. PubMed. [DOI] [PubMed] [Google Scholar]
- Wang Z, Simoncelli EP. Translation insensitive image similarity in complex wavelet domain; IEEE International Conference on Acoustics Speech and Signal Processing; 2005.pp. 573–576. [Google Scholar]
- Watt RJ, Morgan MJ. A theory of the primitive spatial code in human vision. Vision Research. 1985;25:1661–1674. doi: 10.1016/0042-6989(85)90138-5. PubMed. [DOI] [PubMed] [Google Scholar]
- Wetherill GB, Levitt H. Sequential estimation of points on a psychometric function. British Journal of Mathematics Statistics and Psychology. 1965;18:1–10. doi: 10.1111/j.2044-8317.1965.tb00689.x. PubMed. [DOI] [PubMed] [Google Scholar]
- Wilkinson F, James TW, Wilson HR, Gati JS, Menon RS, Goodale MA. An fMRI study of the selective activation of human extrastriate form vision areas by radial and concentric gratings. Current Biology. 2000;10:1455–1458. doi: 10.1016/s0960-9822(00)00800-9. PubMed. [DOI] [PubMed] [Google Scholar]
- Wilkinson F, Wilson HR, Habak C. Detection and recognition of radial frequency patterns. Vision Research. 1998;38:3555–3568. doi: 10.1016/s0042-6989(98)00039-x. PubMed. [DOI] [PubMed] [Google Scholar]
- Zur D, Ullman S. Filling-in of retinal scotomas. Vision Research. 2003;43:971–982. doi: 10.1016/s0042-6989(03)00038-5. PubMed. [DOI] [PubMed] [Google Scholar]


