

Abstract
A self-contained, integrated, disposable, sample-to-answer, polycarbonate microfluidic cassette for nucleic acid—based detection of pathogens at the point of care was designed, constructed, and tested. The cassette comprises on-chip sample lysis, nucleic acid isolation, enzymatic amplification (polymerase chain reaction and, when needed, reverse transcription), amplicon labeling, and detection. On-chip pouches and valves facilitate fluid flow control. All the liquids and dry reagents needed for the various reactions are pre-stored in the cassette. The liquid reagents are stored in flexible pouches formed on the chip surface. Dry (RT-)PCR reagents are pre-stored in the thermal cycling, reaction chamber. The process operations include sample introduction; lysis of cells and viruses; solid-phase extraction, concentration, and purification of nucleic acids from the lysate; elution of the nucleic acids into a thermal cycling chamber and mixing with pre-stored (RT-)PCR dry reagents; thermal cycling; and detection. The PCR amplicons are labeled with digoxigenin and biotin and transmitted onto a lateral flow strip, where the target analytes bind to a test line consisting of immobilized avidin-D. The immobilized nucleic acids are labeled with up-converting phosphor (UCP) reporter particles. The operation of the cassette is automatically controlled by an analyzer that provides pouch and valve actuation with electrical motors and heating for the thermal cycling. The functionality of the device is demonstrated by detecting the presence of bacterial B.Cereus, viral armored RNA HIV, and HIV I virus in saliva samples. The cassette and actuator described here can be used to detect other diseases as well as the presence of bacterial and viral pathogens in the water supply and other fluids.
Keywords: Microfluidics, Lab-on-a-chip, Pouch, PCR chip, RT-PCR, Point-of-care, HIV
1 Introduction
In recent years, there has been a growing interest in developing integrated, self-contained, portable, disposable, inexpensive microfluidic devices for point-of-care diagnostics (Wang et al. 2006; Yager et al. 2006; Liu et al. 2009; Liu et al. 2004). These devices require integration, automation, and miniaturization of liquid handling, sample processing, and analysis to facilitate fast diagnostics, low cost, operation by minimally trained personnel, and low contamination risk.
Nucleic acid-based assays are commonly used in medical laboratories because of their high specificity and sensitivity (Murdoch 2004). Since its advent in the mid 1980s, polymerase chain reaction (PCR) has been one of the most important tools for molecular diagnosis, enabling the amplification of target templates containing just a few molecules to detectable levels. For the amplification of RNA targets, reverse transcription-PCR (RT-PCR) is needed, in which RNA strands are first reverse transcribed into their DNA complement, followed by amplification of the resulting DNA using standard PCR. For efficient and selective amplification, PCR requires rapid temperature transitions as well as precise temperature control. Conventional bench-top PCR thermal cyclers can have slow heating/cooling rates due to their large thermal mass and as a result rapid thermal cycling has been one of the early motivations for the development of low thermal inertia, PCR chips. Various micro PCR devices, ranging in volume from nano-liters to microliters, have been fabricated in silicon (Wilding et al. 1994; Belgrader et al. 1999; Yan et al. 2005), glass (Easley et al. 2006a; Gong et al. 2006; Lagally et al. 2001), ceramics (Sadler et al. 2003; Zhong et al. 1999), and polymeric materials such as PDMS (Lagally et al. 2004; Xiang et al. 2005), PMMA (Yao et al. 2005), polyimide (Giordano et al. 2001), and polycarbonate (Chen et al. 2005; Yang et al. 2002; Kim et al. 2009; Anderson et al. 2000).
Since PCR and RT-PCR processes are sensitive to the presence of inhibitors in the sample, appropriate sample preparation is essential for successful nucleic acid amplification. Typically, sample preparation steps include sample metering, cell/virus lysis, and nucleic acid isolation and concentration. To facilitate PCR-based tests at the point of care, it is ideal to integrate sample preparation steps with the enzymatic reactions into a single platform. Due to the complexity of the sample preparation, however, most of the reported microfluidic PCR devices focus predominantly on the amplification and detection/analysis steps (Lagally et al. 2001; Lagally et al. 2004; Burns et al. 1998; Huang et al. 2006; Waters et al. 1998; Woollery et al. 1996), while the sample preparation and nucleic acid extraction are deferred to bench-top equipments. For example, Woolley et al. (Woollery et al. 1996) presented a silicon-based PCR reactor integrated with a glass-based capillary electrophoresis (CE) chip for the detection of a β-globin target within 20 min. Huang et al. (2006) described a microfluidic chip capable of performing DNA/RNA amplification, electrokinetic injection and separation of (RT-)PCR products, and on-line optical detection of the nucleic acid products. Koh et al. (2003) presented an integrated, plastic microfluidic device for PCR and electrophoretic separation to detect bacteria. In their design, the PCR products were transported electrokinetically through a gel valve and then separated electrophoretically. As one alternative to electrophoretic separation, fluorescence-based, real-time DNA detection offers fast, quantitative detection and simplifies chip design (Belgrader et al. 2001; Higgins et al. 2003; Neuzil et al. 2006; Xiang et al. 2007).
Although other researchers have developed microfluidic devices for cell lysis and nucleic acid extraction (Breadmore et al. 2003; Chung et al. 2004), there are just a few reports of nearly fully integrated PCR-based biochips that perform all the necessary steps from sample introduction to target detection. Rosa et al. (Rose et al. 2007) demonstrated an integrated microfluidic system that employed dielectrophoresis to pre-concentrate B. pertussis cells, lysed the cells with electroporation, and carried out amplification and detection. Anderson et al. (2000) reported on an integrated device that purified RNA from a serum lysate and carried out PCR, serial enzymatic reactions, and nucleic acid hybridization. Easley et al. (2006b) described an integrated microfluidic device that performed nucleic acid purification, amplification, and microchip electrophoretic detection. The sample and reagents were, however, delivered with an external syringe pump. Liu et al. (2004) presented an integrated biochip that carried out sample preparation, PCR, and microarray-based detection of DNA. More recently, Beyor et al. (2009) reported an integrated lab-on-a-chip system for pathogen detection comprised of cell preconcentration, purification, polymerase chain reaction (PCR), and capillary electrophoretic (CE) analysis. In all the above cases, some of the operations were either carried out outside the chip or the operator had to interact with the process stream by introducing reagents at the appropriate times. A few PCR-based integrated systems have also been developed by companies. For instance, Rheonix, Inc. (Ithaca, NY) demonstrates an integrated cassette (CARD) capable of pumping reagents and processing samples. At its current state of development, the Rheonix system's user must pipette reagents into wells in the CARD at the beginning of the process. Cepheid (Sunnyvale, CA) developed an integrated real-time PCR system GeneXpert capable of sample preparation and DNA amplification and detection. The GeneXpert is a laboratory-based system.
Although dry reagents have long been used in lateral flow immunoassays (Blatt et al. 1998), they are rarely used in nucleic acid-based, point-of-care assays. While Weigl et al. (2006) presented a procedure for preparing and handling dry reagent storage for microfluidic assays, the reagents were not pre-stored in the chip. Brivio et al. (2007) demonstrated on-chip PCR amplification with freeze-dried (Rey et al. 1999) reagents stored in the polymer PCR chips. In their work, long-term stability of the reagents was emphasized, but there was little discussion of the flow control and the integration of reagent storage into the chip.
In this paper, we report on a self-contained, integrated, disposable, sample-to-answer, polycarbonate microfluidic cassette that performs sample lysis, nucleic acid isolation, enzymatic amplification, amplicon labeling, and detection for point-of-care identification of pathogens. The cassette includes on-board storage of all required liquid buffers and dry reagents, as well as on-chip pumping of liquid solutions and on-chip valves for fluid control. The analysis starts with sample introduction, followed by mixing the sample with lysis/binding buffer and solid-phase extraction (SPE) of nucleic acids from the lysate. The eluted template is then delivered into a PCR chamber that contains pre-stored dry reagents. The thermal cycling for enzymatic amplification is facilitated with two thermal electric (TE) modules that sandwich the PCR chamber. The amplicon is detected on-chip with a lateral flow strip (Wang et al. 2006). The device was tested with pathogenic bacterial B. cereus, viral Armored RNA, and HIV samples. The gram-positive B cereus bacterium served as a model organism for DNA-based detection. The Armored RNA HIV particles consists of RNA molecules encapsulated in a MS2 bacteriophage shell (Pasloske et al. 1998) and served as a model for viral RNA detection and as a safe surrogate for the HIV virus.
2 Methods and materials
The test system consists of an integrated, disposable, single use cassette and an electronically controlled analyzer. The cassette houses the various reagents and all the functional components such as pouches, valves, reaction chambers, membranes, and conduit networks needed for the process operations. The analyzer provides mechanical actuation for the on-chip pouches and valves for liquid pumping and flow control in the cassette. The analyzer also includes a pair of thermoelectric units to provide thermal cycling for (RT-)PCR. After loading the sample, the cassette is self-contained, and designed to avoid exchange of liquids between the cassette and actuator, reducing risk of contamination. Subsequent to the introduction of a biological sample (e.g., saliva, serum, urine, cell culture), the cassette is inserted into the analyzer and all the necessary operations are carried out automatically.
2.1 Cassette design, fabrication, and operation
Cassette design
The cassette has two states: a “storage state” in which all the reagent compartments are sealed for long-term storage and an “activated state” in which the reagent compartments are connected to channels and reaction chambers (Liu et al. 2009). To activate the cassette, the sealing foil is removed and replaced with a flexible, attached cover film that contains connecting conduits. The cover film is permanently affixed to the cassette to assure proper alignment of the connecting conduits with the vias in the cassette.
The cassette is schematically depicted in Fig. 1. Figure 1a and b are, respectively, a top view of the cassette and cross-sections along the length of the cassette prior (B1) and after (B2) the cassette's activation. The cassette consists of a variety of functional components, including reagents' storage pouches (P1–P6), on-chip diaphragm valves (V1-V4), a sample mixing chamber, a nucleic acid isolation chamber equipped with a silica membrane, a (RT-) PCR chamber preloaded with dried reagents, and a lateral flow strip for detection of (RT-)PCR products. Note that the heaters H1 and H2 shown in Fig. 1 are components of the analyzer but not of the cassette. Figure 2 is a photograph of the assembled cassette in its storage state. For better visibility, the pouches for the storage of the liquid reagents are filled with dyes. The liquid reagents include binding/lysing buffer, inhibitor removal buffer, wash buffer, elution buffer, lateral flow buffer, and UCP reporter buffer.
Fig. 1.

A schematic of the polycarbonate fluidic chip consisting of reagents storage pouches (P1-P6), on-chip diaphragm valves (V1-V4), a mixing chamber, a nucleic acid isolation chamber housing a silica membrane, a (RT-)PCR chamber preloaded with dried reagents, an amplicon dilution trap, a waste chamber and liquid trap, and a lateral flow strip. (a) Top view; (b) cross-sections along the length of the cassette (indicated with the arrows B-B in A) showing the cassette in storage state (B1) and operating (after activation) state (B2). Note that heaters H1 and H2 are components of the analyzer but not of the cassette. ‘TE’ denotes the thermoelectric modules
Fig. 2.
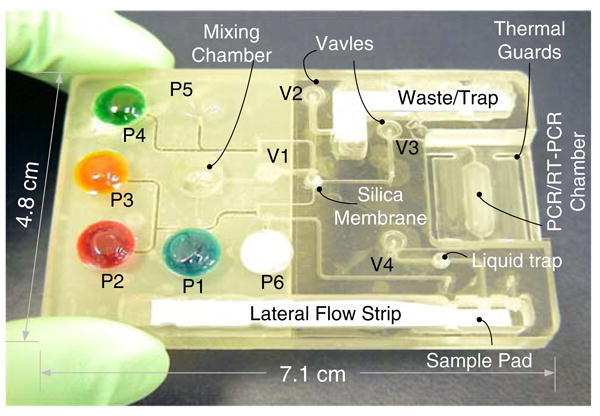
A photograph of the assembled, nucleic acid cassette in its storage state. For better visibility, the various storage pouches were filled with dyes. Pouch P1 (100 μl) contains the binding/lysis buffer; pouch P2 (60 μl) contains the inhibitor removal buffer; pouch P3 (100 μl) stores the wash buffer; pouch P4 (40 μl) contains the elution buffer; pouch P5 (60 μl) contains the lateral flow buffer; and pouch P6 (60 μl) contains a suspension of UCP reporter particles
Fabrication
The cassette consists of a 71 mm long×48 mm wide, 5.84 mm thick polycarbonate (PC) body, which was machined and patterned with a computer numerical control (CNC) milling system (HAAS Automation Inc., Oxnard, CA). The chip is designed to be compatible for quantity production by injection molding. Hemispherical wells for the pouches and valve seats were milled on the top surface and equipped with two access ports at the well bottom (Fig. 4(a)). To form the pouches, the pouch wells, differing in size according to the volume of liquid needed for the particular process, are capped with a 120 μm thick polycarbonate film using solvent (acetonitrile) bonding. A custom-made punch that matches the well's topology deformed the polycarbonate film to form an inverted hemisphere. Compressed air was then delivered into the well through the ports causing the hemisphere to snap into upright position (see Qiu et al. (2009) for additional details on the pouch manufacturing,). The pouch was then completely filled through one of the access ports with the appropriate buffer and the ports were sealed. For long-term storage, an additional, removable, barrier film, such as aluminum foil can cover the pouches, to minimize permeation of moisture through the polycarbonate film.
Fig. 4.

Schematic of the on-chip pumping and valving. (a) Fluid stored in the pouch is “excreted” out through the pouch's exit port when the plunger deforms the pouch membrane. The pouch's volume determines the discharged fluid's volume, and the actuation speed determines the dispensing rate. (b) Actuation of the on-chip, normally open diaphragm valve. The vertical movement (in Z direction) of the piston is generated with a linear actuator
To form the diaphragm valves, a 45 μm thick polyolefin film (Syfan Corp., Everetts, NC, USA) was bonded over the valve seat with a pressure-sensitive adhesive tape (3 M Co., Minnesota, USA). The gap between the valve seat and the membrane was dictated by the thickness of the adhesive tape and was approximately 250 μm. A waste chamber, lateral flow strip chamber, and mixing chamber were also machined on the cassette's top surface (Fig. 1).
A nucleic acid isolation chamber containing a silica membrane was formed on the bottom surface. The silica membrane (glass fibers) was cut into a 2 mm diameter disk with a CO2 laser (Universal Laser Systems, Scottsdale, Arizona, USA). The silica membrane was supported by a perforated disk made of polycarbonate. Molten paraffin was dispensed around the membrane's seat perimeter prior to the silica disk's insertion. Subsequent to the silica disk insertion, the paraffin was heated and softened. The silica disk was pushed against the paraffin to ensure sealing between the membrane and the chamber walls.
A 20 μl, 400 μm tall (RT-)PCR chamber was fabricated in the bottom layer. The chamber was capped with a 120 μm thick polycarbonate film. Additionally, the cassette was thinned at the location of the PCR reactor. A thin walled, shallow reactor was used to reduce thermal resistance and to improve temperature uniformity. The different compartments were connected with a network of milled conduits (Figs. 1 and 2) of square cross-sections with widths and depths ranging from 250 μm to 500 μm.
All the liquid and dried reagents were loaded into the cassette at the conclusion of its manufacturing. The various buffers were stored in the pouches. Pouch P1 stores the binding/lysis buffer; pouch P2 stores the inhibitor-removal buffer; pouch P3 stores the wash buffer; pouch P4 stores the elution buffer; pouch P5 stores the lateral flow buffer; and pouch P6 stores the labels' suspension. Dried (RT-) PCR reagents were loaded into the PCR reaction chamber and passivated with a paraffin film (AmpliWax, Applied Biosystems Inc, Foster City, CA) before the PCR chamber was capped. The paraffin film serves to protect the dried reagents from the surrounding air during storage and from any liquids that are transmitted through the chamber (Kim et al. 2009; Mauk et al. 2008) until melted at 58°C prior to amplification.
Operation
Prior to sample introduction, the sealing layer is removed and replaced with the attached connecting cover film (Fig. 1-B2). The connecting cover film is made of polymer film in which conduits have been machined with the CO2 laser. The flexible connecting cover is permanently attached to the PC cassette to assure appropriate alignment of the connecting conduits with the various openings in the main body of the cassette. Once the cover film is affixed to the cassette's main body, the conduits in the film form connections between the various pouches' outlets and the downstream fluidic networks.
An analyzer (Fig. 3) is used to actuate the cassette and to effectuate various process operations in the desired, preprogrammed sequence. Mechanical actuation is accomplished with miniature, linear motors that controllably lower plungers either to compress pouches or to compress membranes for valve closure or fluid delivery. The analyzer also houses thermoelectric heaters to provide thermal cycling for the PCR reaction, a heater to remove any residual ETOH from the silica membrane, a vibrator to enhance mixing, and a vacuum pump. The analyzer is described in greater detail later on.
Fig. 3.

A schematic depiction of the analyzer comprising linear actuators, a pair of thermoelectric (TE) units and a heat sink, a K-type thermocouple, a micro-vacuum pump, a liquid trap, and a microcontroller. All the components are packaged in a portable box. The external computer (PC) provides user interface and data analysis software
Subsequent to the sample introduction into the mixing chamber and engagement of the connecting film, the cassette is inserted into the analyzer and makes a quick connection with a vacuum line. Once the analyzer is instructed to start, plungers lower in a predetermined, timed sequence to compress the pouches and discharge the reagents. We describe below the sequence of processes used to analyze RNA viruses.
Initially, valve V1 (Fig. 1) is closed. Compression of pouch P1 leads to the discharge of the binding buffer containing chaotropic salts into the mixing chamber, where it mixes with the sample. Once compressed, the plunger remains in the down position, preventing the pouch from rebounding and causing backflow. The force exerted on the cassette by the plunger ensures that the cassette is in good thermal contact with the heating elements. An electrically controlled, miniature, vibrating disk motor (Solarbotics Ltd., Calgary, Canada) attached to the bottom of the mixing chamber shakes the chamber for 1 min to enhance mixing during the lysis step. After the incubation step, valve V1 opens and valve V3 closes. The lysate is then forced to flow through the silica membrane (Roche Applied Science, Mannheim, Germany) with the aid of a micro vacuum pump (Hargraves Technology Corp., Mooresville, NC 28117 USA). In the presence of chaotropic salts (e.g., guanidine-HCl) (Boom et al. 1990), nucleic acids bind to the silica membrane, while the other lysate constituents flow through the membrane to the cassette's waste chamber. The waste chamber contains a liquid trap to prevent any liquids from leaving the cassette through the vacuum line. Subsequently, pouches P2 and P3 are compressed in sequence to transmit, respectively, inhibitor removal buffer and wash buffer through the membrane. The solutions wash away from the membrane any unwanted mineral salts, enzyme, proteins and other small molecules.
Next, heater H1 (Fig. 1) is turned on, and the membrane is dried with heated air driven by the vacuum pump to remove residual volatile contaminants that may inhibit the subsequent amplification reaction. Valve V2 is then closed, valve V3 opens, and pouch P4 discharges elution buffer (low molarity Tris buffer solution or nuclease-free water) through the membrane to desorb bound RNA. The eluted RNA is transferred into the RT-PCR chamber and fills-up the chamber. The upstream (V3) and downstream (V4) valves surrounding the PCR chamber are closed to seal the chamber. Heater H2 (Fig. 1B2) is activated to heat the chamber to ∼58°C for 1 min to melt the paraffin seal and release the reagents.
Once the reagents are released, the PCR chamber temperature is lowered to 50°C for 30 min for the reverse transcription (RT) reaction. Subsequent to the RT step, the thermal cycling is performed. Once the thermal cycling has been completed, valves V3 and V4, open and on-chip detection of the PCR products is carried out with the lateral flow assay (see Section 2.7). Material from the PCR chamber is mixed with lateral flow buffer by compressing pouch P5 and transferred to the lateral flow strip sample pad. A liquid trap, consisting of a well located downstream of the PCR chamber, captures 90% of the PCR product's volume and allows only 10% of the products to proceed to the loading pad of the lateral flow strip. The amplicon-buffer blend migrates up the strip by capillary forces. The strip includes test zones with immobilized ligands that specifically bind to the target analytes in the sample and a control zone that binds the labels that were not captured in the test zone. The control line is provided to assure the integrity of the process. After a predetermined time interval (2 min), pouch P6 is compressed to discharge buffer containing functionalized UCP reporter particles onto the lateral flow strip's sample pad. The particles migrate up the strip and bind to the immobilized target molecules at the test line and the capture molecules at the control line. Although in the studies reported here up-converting phosphor (UCP) particles were employed as the reporters, the cassette can utilize any other functionalized labels such as gold particles (which facilitate visual detection), quantum dots, or fluorophores. Finally, a fluorescence reader scans the strip and outputs RFU readings for analysis. The test results are reported in terms of the ratio of the signal intensity detected at the test and control lines. The sequence of operation described above for on-chip nucleic acid testing is summarized in the ESI (Electronic Supporting Information) Table S1.
2.2 The analyzer
The portable analyzer controls all the tasks performed in the cassette, including fluid pumping and valving, thermal cycling, and signal scanning, reading, and analysis, but the analyzer is not disposable. It is designed to enable rapid insertion and discharge of cassettes. The analyzer (Fig. 3) comprises miniature linear actuators to compress pouches and close valves, a pair of thermoelectric (TE) units and a heat sink for thermal control of the enzymatic reaction chamber, a K-type thermocouple for temperature sensing, a micro-vacuum pump, a liquid trap, and a microcontroller. A fluorescence reader will be integrated into the device in the future for scanning the lateral flow strip. Alternatively, the amplification process can be monitored in real time. The microcontroller schedules and directs the operations of the various components. Currently, the control and data processing software reside on an external computer to allow easy modifications in the sequence and timing of operations through a friendly GUI (Graphical User Interface). In the future, the software will be downloaded onto the microcontroller and a touch screen display could be used for interactions between the user and the device.
2.3 Pumping and valving
The storage of liquids and the pumping functions are carried out by a system of pouches. Each pouch (Fig. 4 (a)) consists of a cavity milled in the plastic substrate with a rounded end mill and covered with a thin shell dome. When the cassette is inserted into the analyzer, it is aligned so that each pouch resides beneath a linear actuator equipped with a ball-shaped plunger. When the plunger descends, it deforms the membrane to discharge the liquid out of the pouch through the exit port. Pouches of volumes ranging from 8 μl to 210 μl have been fabricated to accommodate various assays' needs. The amount of liquid to be discharged is dictated by the pouch's volume. Although it is possible to program the linear actuator for multiple discharges from the same pouch, in most of our applications, we discharged (slowly) the entire pouch's volume in a single stroke. Once the discharge operation has been completed, the plunger stays in its down position until the conclusion of all chip operations.
To accommodate valving, we designed and constructed simple, normally open, on/off, diaphragm valves (Fig. 4 (b)). The valves are actuated by the same linear motors used to actuate the pouches. As the plunger descends, it deforms the flexible diaphragm and closes the valve. Although the valves need to last just a few (<3) cycles, they proved to be quite durable, and provide a sufficient seal to prevent the escape of liquid from the (RT-)PCR chamber during thermal cycling.
2.4 Mixing chamber
Rapid mixing of fluids and particles is essential in many fluidic devices. Since, in most cases, diffusion is too slow, one must rely on fluid motion to stir the fluid (Liu et al. 2009; Stroock et al. 2002). Here, we use a miniature, planar, vibrating disk motor (VDM) (Solarbotics Ltd., Calgary, Canada) to facilitate stirring in the 150 μl mixing chamber. A 12 mm diameter×3.4 mm thick planar vibrating disk contacts the bottom surface of the mixing chamber (Fig. 5(a)). When energized, the vibrating disk generates high-frequency vibrations, which, in turn, induce circulation in the mixing chamber.
Fig. 5.
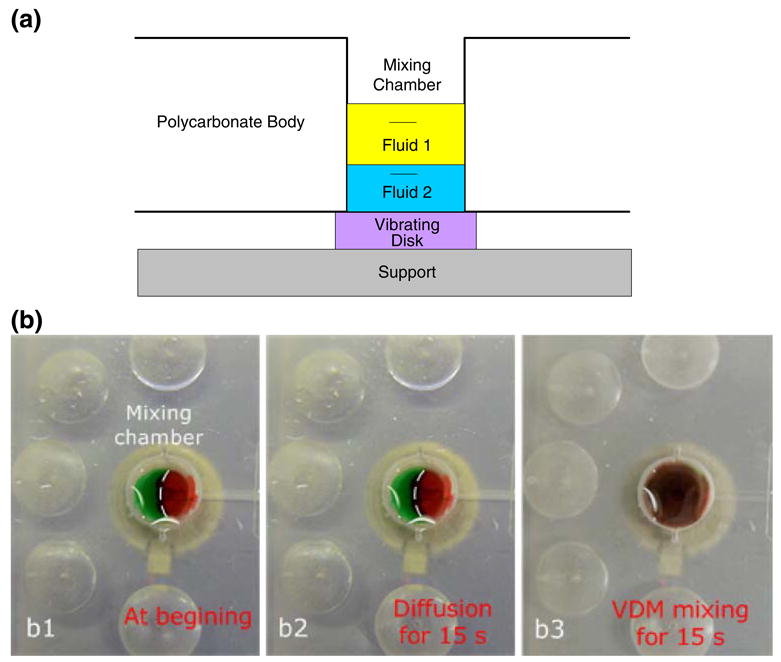
(a) A schematic of the on-chip mixing chamber. The mixing process is enhanced with a low-power, high frequency, miniature, vibrating disk motor (VDM) placed next to the bottom surface of the mixing chamber (purple). The VDM is housed in the analyzer. (b) Image b1 features two distinguishable fluids (red and green) at the time of their introduction into the mixing chamber; b2 shows the two fluids after 15 s of diffusion; b3 shows the mixture of the two fluids after 15-seconds of stirring with the VDM. (The dashed line in Figs. b1 and b2 delineates the interface between the two dyes for the benefit of readers who do not have access to color images)
To demonstrate the stirrer's performance, we filled the mixing chamber with green and red dyes (Fig. 5b1). In the absence of stirring, very little mixing occurred by diffusion alone. After 15 s, the interface between the green and red dyes is clearly visible (Fig. 5b2). In contrast, when the stirrer was active, within 15 s, the two fluids blended to form a homogeneous solution (Fig. 5b3).
2.5 Solid phase extraction of nucleic acids
Our device is designed for the extraction, amplification, and detection of DNA or RNA targets. The commonly used silica-based solid phase extraction (Wang et al. 2006; Chung et al. 2004; Boom et al. 1990; Hagan et al. 2008; Legendre et al. 2006) technique is applicable for both. Solid-phase extraction provides an effective means for the isolation and purification of nucleic acids from cell lysates. The lysate is first mixed with a chaotropic agent such as guanidinium HCl. The mixture is then forced through a porous silica matrix such as a porous, glass fiber membrane. The chaotropic agent induces selective binding of the nucleic acids to the silica phase. The bound nucleic acid is washed with ethanol-based buffers and subsequently eluted with a low-salt, neutral-pH buffer that is compatible with (RT-)PCR. The chaotrope-silica method of nucleic acid isolation is widely used on a benchtop with a spin-column. For the extraction of bacterial DNA, we modified the QIAGEN DNeasy Tissue Kit (QIAGEN Inc., Valencia, CA 91335) protocol. For the extraction of viral RNA, we modified the Roche High Pure Viral RNA Kit (Roche Applied Science, Indianapolis, IN 46250) protocol by replacing the centrifugation steps with vacuum driven suction through the silica membrane. The silica membrane was reduced in size to a 2 mm diameter disk and the volume of the various reagents was adjusted accordingly.
2.6 PCR reagents
Dried PCR reagents were prepared and pre-stored in the PCR chamber (Kim et al. 2009; Mauk et al. 2008). When the reagents were reconstituted during PCR, the concentration of the various components were: 10 mM Tris-HCl (pH 9.0), 50 mM KCl, 1.5 mM MgCl2, 200 μM dNTP, and 0.4 μg/μl BSA. The concentration of Taq DNA polymerase (GE Healthcare, Buckinghamshire, UK) was 0.1 unit/μl. For RT-PCR, the concentration of reverse transcriptase (Promega Corp., Madison, WI) was 0.1 unit/μl.
When experimenting with B. cereus bacterium, the B. cereus genomic DNA (5,244,283 bp) was used as the PCR template. The forward and reverse primers (0.3 μM each) were, respectively, 5′-biotin-TCT CGC TTC ACT ATT CCC AAG T-3′ and 5′-digoxigenin-AAG GTT CAA AAG ATG GTA TTC AGG-3′ (Wang et al. 2006). The primers targeted a specific 305 bp gene sequence. The PCR amplification resulted in the production of double-stranded DNA amplicons with 5′-Dig hapten on one strand and 5′-Bio hapten on the opposite strand. The on-chip PCR protocol was initiated with a denaturation step at 94°C for 120 s, followed by 25 amplification cycles (94°C, 15 s; 55°C, 23 s, 72°C, 20 s), and terminated with an extension step at 72°C for another 120 s. The total (unoptimized) time for the on-chip PCR was 28 min.
When we experimented with Armored RNA HIV (Asuragen, Inc., Austin, TX 78744) (Pasloske et al. 1998), the forward and reverse primers (0.6 μM each) were, respectively, 5′-biotin- TAC TAG TAG TTC CTG CTA TGT CAC TTC C-3′ and 5′-digoxigenin-AGT GGG GGG ACA TCA AGC AGC CAT GCA AAT-3′. The primers targeted a 155 bp gag fragment of the HIV genome (Michael et al. 1999). The on-chip RT-PCR protocol was initiated with incubation at 45°C for 30 min and a denaturation step at 95°C for 120 s, followed by 25–35 amplification cycles (95°C, 45 s; 58°C, 45 s, 72°C, 60 s), and terminated with an extension step at 72°C for another 10 min. The RT-PCR product was 155 base pairs.
In parallel with the on-cassette experiments, control tests with 25 μL total volume were carried out with a standard benchtop PCR thermocycler (TC-312, Techne Incorporated, Princeton NJ). The benchtop PCR protocol used the same conditions as the cassette protocol, but had a relevantly slower cooling/heating rate inherent in the benchtop PCR system. PCR products were separated by agarose gel (2%) electrophoresis and stained with ethidium bromide (0.3 μg/ml).
2.7 Detection of amplicons
To detect the presence of target amplicons, we used a UCP-lateral flow assay (UCP-LF) (Corstjens et al. 2008). The UCP-LF assay provides a rapid and sensitive detection of the analytes (Wang et al. 2006; Liu et al. 2009; Corstjens et al. 2008), with the capability for multiplex detection of DNA and antigens/antibodies on a single strip. The lateral flow (LF) buffer consisted of 100 mM Hepes (pH 7.2), 270 mM NaCl, 0.5% (v/v) Tween-20, and 1% (w/v) BSA (Sigma #A7030). The immunolabeling buffer was a mixture of LF buffer with mouse anti-Dig conjugated UCP reporter particles to label the haptenized DNA. The LF strips (OraSure Technologies, Inc., Bethlehem, PA) consisted of a 4 mm×20 mm nitrocellulose strip (SRHF04000, Millipore, Billerica, MA) with a 4 mm×10 mm sample loading pad (glass-fiber No. 33, Schleicher & Schuell) at the upstream end and a 4 mm×20 mm absorbent, waste pad (paper No. 470, Schleicher & Schuell) at the downstream end. The LF strip contained a test line of avidin-D and a control line of goat anti-mouse IgG antibodies (supporting information, Fig. S1). During the lateral flow assay, the digoxigenin and biotin-labeled DNA were immobilized at the test line by avidin-biotin binding. The up-converting phosphor (UCP) mouse anti-Dig conjugates were then captured by the immobilized DNA through the Dig anti-Dig interaction. The UCP particles not captured at the test line were immobilized at the control line by the interactions of the goat anti-mouse antibodies and the mouse anti-dig antibody-UCP conjugate. The detection was effectuated by exciting the “up-converting” phosphor (UCP) particles at infrared (IR) (∼ 980 nm) wavelength and detecting emission in the visible spectrum (450 nm) (van de Rijke et al. 2001). As our analyzer is not yet equipped with a reader, a UCP Reader (UPlink™, OraSure Technologies, Inc., Bethlehem, PA) was used to read the DNA strips.
3 Results and discussion
3.1 Pouch volumes and mass loss
The pouches were designed to store liquid reagents as well as to facilitate the pumping of the stored liquids. The pouch volumes, ranging from ∼8 μl to 210 μl, were dictated by the assay requirements plus the dead volume (typically, about 5% of the pouch's volume). The pouch wells were formed by drilling into a polycarbonate body with a 0.375′ ball end mill. The pouch volume was controlled by the milling depth (Fig. S2 in supporting information depicts the pouch's volume as a function of the cavity's depth). The volumes of nominally similarly sized pouches varied by less than 5%.
To store liquids for extended periods of time, the pouch membrane must have low permeability to the vapors of the stored liquids. To enable long term storage, we envision replacing the polycarbonate membrane currently used with an aluminum foil barrier film (Tolas, Inc., Feasterville, PA). We tested the shelf life of liquid-filled pouches made with the aluminum foil by monitoring liquid mass loss from the pouches over a period of a few months. The ports in the bottom part of the pouch cavity were sealed with aluminum sealing tape after filling the pouch chamber with the reagent. We monitored two different liquids: DI water and pure ethanol (Ethyl Alcohol 200 Proof-Pharmco-AAPER) under room conditions. The masses of the liquid-filled pouches were monitored with an analytical balance (Ohaus Corp., Pine Brook, NJ). Figure 6 depicts the relative average (n=3) mass losses of the water and ethanol pouches as functions of time. Over a period of 1 year, about 3% and 11% of the water and ethanol masses were, respectively, lost. Since in the nucleic acid cassettes the ethanol is not pure, but blended with other ingredients to a concentration smaller than 60%, it is anticipated that the actual lose of ethanol from the pouch will be significantly smaller than 11%. In conclusion, it appears that the pouches can reasonably store buffers for a period of 1 year under ambient conditions (∼20–22°C) with minimum mass loss.
Fig. 6.

The mass loss (%) of pouch-stored liquids water (upright triangles) and ethanol (squares), as functions of time under room conditions
3.2 On-chip thermal cycling
To achieve fast thermal cycling, a slender, 400 μm high reaction chamber sandwiched between two 120 μm thick polycarbonate films was fabricated. To reduce heat losses, the reaction chamber was surrounded with air-filled grooves (Figs. 1(a) and 2) that serve to insulate the reactor. A thermoelectric (TE) unit (Laird Technologies, Inc., St. Louis, Missouri, USA) was positioned beneath the PCR chamber and another, similar unit above the chamber (Fig. 1B2). A K-type thermocouple was attached to the top TE unit at the interface between the cassette and the TE unit to provide input to the feedback temperature controller. Digital control was executed with a custom-written, nonlinear, proportional–integral–derivative (PID) control algorithm. To reduce the thermal contact resistance between the thermoelectric units and the PCR chamber, normal force was applied to press the thermoelectric units against the PCR chamber. The system was calibrated and tested with a calibration cassette with thermocouples embedded inside the liquid-filled reaction chamber. The actual, disposable cassette that was used for the assays did not contain any thermocouples.
To illustrate the performance of the thermal controller, Fig. 7(a) depicts the calibration reactor's temperature as a function of time. The thermocouple was inserted mid-length, mid-width, next the inner, top surface of the chamber. Figure 7(b) provides an amplified segment of the temperature trace over one thermal cycle. Figure 7(b) depicts the set temperature (solid line), the temperature at the top outer surface (dashed line), the temperature at the bottom outer surface (dashed-dot line), and the temperature inside the reactor (red line) as functions of time. The heating time from room temperature to 94°C was ∼13 s at a heating rate of ∼5.2°C /s. The cooling rate from 95°C to 60°C was ∼6°C /s. The corresponding heating rate of typical benchtop thermal cyclers ranges from ∼1°C /s to 3°C /s. The total temperature ramp time of one complete cycle of denaturing, annealing, and extension was about 25 s (without counting the dwelling time of 5–15 s at each temperature). The maximum temperature difference between the bottom and the top outer surfaces of the chip was less than 0.5°C. The chamber's inner temperature tracked the set temperature with a time delay smaller than 5 s.
Fig. 7.

(a) The PCR chamber's temperature as a function of time. (b) An enlarged segment of (a) spanning the time interval from 80 s to 200 s (b) and depicting, respectively, the temperatures at the outer bottom surface in contact with the TE unit (dotted line) and the top outer surface in contact with the TE unit (dashed-dot line), inside the reactor (solid red line), and the set temperature (solid line) as functions of time
3.3 On-chip dry storage of (RT-)PCR reagents
Dry PCR mix (Taq polymerase, primers, dNTPs, buffer salts) or RT-PCR mix (reverse transcriptase, Taq polymerase, primers, dNTPs, buffer salts), encapsulated with paraffin, was pre-stored in the PCR reaction chamber in dry form. The (RT-)PCR mix can be either first encapsulated with protective paraffin film outside the reactor and then inserted into the chamber or dried and encapsulated with paraffin in-situ during the reaction chamber's assembly (Kim et al. 2009; Mauk et al. 2008). Figure 8(a) and (b) show, respectively a photograph and a schematics of the reaction chamber with the pre-stored reagents. Once the nucleic acids were eluted from the upstream isolation membrane and introduced into the reaction chamber, the inlet and exit valves closed. The chamber was then heated, the paraffin melted and moved out of the way by the action of surface tension forces and buoyancy, and the (RT-)PCR mix was hydrated and reconstituted (Kim et al. 2009). The method of pre-storing the PCR reagents greatly simplifies the flow control as well as offers a strategy for prolonged storage of chips without a need for refrigeration.
Fig. 8.
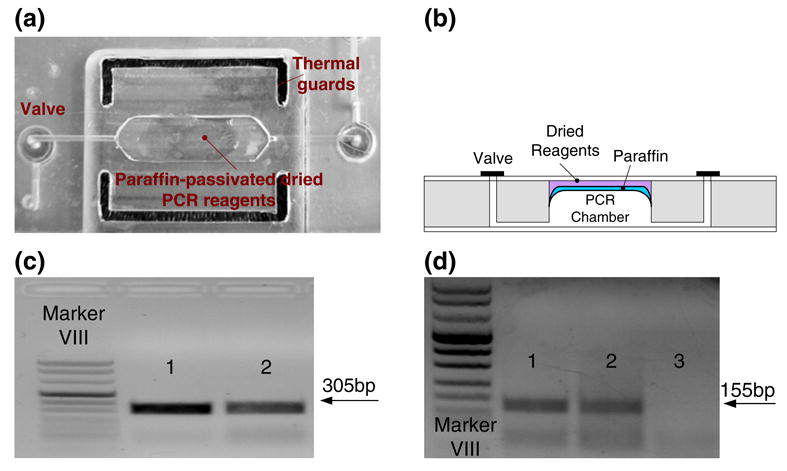
(a) A photograph of the modular PCR chamber with the paraffin-encapsulated, pre-loaded, dry reagents. (b) Cross-section of a reactor with the paraffin-encapsulated, pre-loaded, dry reagents. (c) Agarose gel (1.5%) electropherograms of PCR products (305 bp) amplified from ∼1.5 ng B.Cereus DNA (30 cycles). Lanes 1 and 2 correspond, respectively, to the products of the PCR reactor with liquid reagents and the PCR reactor with wax-encapsulated dry reagents. (d) Agarose gel (2%) electropherograms of RT-PCR products (155 bp) amplified from armored RNA isolated from a 100-μl sample of 1×10⁵ virions/ml (35 cycles). Lanes 1, 2 and 3 correspond, respectively, to the products of the RT-PCR reactor with liquid reagents, the reactor with dry reagents, and the negative control (no target) with dry reagents
The performance of the PCR reactor with the dry stored reagents was tested by amplifying target analytes at various concentrations. In the PCR tests, we successfully amplified DNA targets at concentrations as low as ∼200 copies. Figure 8(c) depicts a representative electropherogram of an agarose gel electrophoresis resulting from ∼1.5 ng B Cereus DNA target, showing the appropriate 305 bp amplicon product. Lanes 1 and 2 correspond, respectively, to the products of the on-chip PCR reactor with wet reagents and the on-chip PCR reactor with wax-encapsulated, dry reagents. The band in Lane 2 is slightly weaker than that in Lane 1. We suspect that the lower efficiency of the reaction with the encapsulated reagents resulted from our relatively primitive drying procedure. The reagents were dried at room temperature in moderate vacuum. The drying process may adversely affected enzyme activity. It is likely that more sophisticated drying techniques such as freeze-drying would better preserve enzymes' integrity and would lead to better PCR efficiency. Preliminary testing of the shelf life of the pre-loaded, dried reagents showed successful amplification of target nucleic acids with reagents stored at room conditions for up to five months (Kim et al. 2009).
Figure 8(d) features a representative electropherogram of RT-PCR with armored RNA using on-chip, preloaded, dry reagents. The RNA was isolated from a 100 μl armored RNA sample of 1×10⁵ virions/ml. Lanes 1 and 2 correspond, respectively, to the amplicons (155 bp) of the on-chip PCR reactor with wet reagents and the on-chip PCR reactor with wax-encapsulated dry reagents. Witness the presence of a second band consisting of smaller molecules. We suspect that this second band resulted from primer-dimer formation during the RT-PCR reaction, probably due to the use of single step RT and PCR reactions, the relatively high concentration of primers, and un-optimized reaction conditions.
To verify that the paraffin itself does not adversely affect the amplification process, we deposited a paraffin layer in the PCR chamber in the same way as we would deposit paraffin for the reagents' storage, but without any reagents. Instead, the reagents were supplied in liquid form. The PCR products from the reactor with the paraffin patch and the PCR reactor without the paraffin patch yielded nearly identical gel electrophoresis bands (not shown). Not surprisingly, the paraffin itself has no adverse effect on the amplification process.
3.4 On-chip nucleic acid extraction
The purity of the nucleic acid template and the presence of inhibitors critically affect the sensitivity, reliability, and specificity of the RT-PCR/PCR reactions. Hence, the module for nucleic acids isolation, purification, and concentration plays a critical role in the successful operation of the integrated cassette. Here, we utilized solid-phase extraction based on the chaotrope-silica method (Wang et al. 2006; Chung et al. 2004; Boom et al. 1990; Hagan et al. 2008). A 2 mm diameter disc of silica fiber matrix was snugly fitted in a chamber (Fig. 9(a)). The silica disc facilitated easier assembly than the use of a packed bead column (Hagan et al. 2008).
Fig. 9.
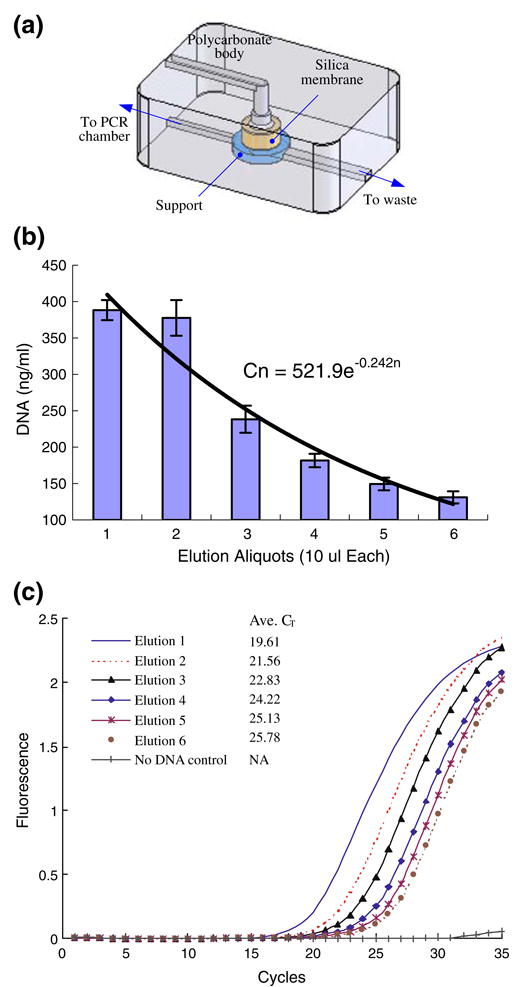
(a) Schematic depiction of the silica membrane isolation chamber. (b) The DNA concentration C(n) of consecutive eluted aliquots (n) from the on-chip silica membrane; the error bar represents the scatter of data from three independent measurements. (c) Real-time PCR of samples taken from the consecutive aliquots: the fluorescent intensity (arbitrary units) is depicted as a function of time
When valve V2 was open and valve V3 closed (Fig. 1 (a)), the sample was pre-mixed with chaotropic salt and pumped through the porous silica membrane (Fig. 9(a)), and then the membrane was washed with ethanol-based buffers. Next, the membrane was dried with heated air-flow at a vacuum pressure of 600 mbar to remove the residual buffers retained in the membrane. Valve V2 was then closed, valve V3 opened, and the nucleic acids were eluted into the PCR chamber by pumping pure water (elution buffer) through the membrane. Only a fraction of the eluted template was transferred into the 20 μl (RT-)PCR chamber located downstream of the isolation chamber.
Literature and experience showed that the presence of inhibitors, especially ethanol, has an adverse effect on amplification's efficiency. To better understand the elution process, we examined the nucleic acid concentration of successive aliquots eluted from the isolation chamber. To obtain the nucleic acids, we mixed 100 μl of B. Cereus culture (∼2.85×10⁷ cells/ml corresponding to ∼16.6 ng of B. Cereus genomic DNA (Ivanova et al. 2003) in the sample) with 100 μl lysis buffer (QIAGEN Inc., Valencia, CA 91335) at 59°C for 30 min, passed the lysate through the isolation chamber, and washed the membrane using the standard procedure described in Section 2. Six successive aliquots, 10 μl each, were eluted from the membrane with water. We labeled the aliquots according to their position in the elution sequence, i.e, 1, 2, and 3 stands, respectively, for the first, second, and third eluted aliquot. The DNA concentration of each aliquot was measured with a fluorimeter (Turner Biosystem TBS-380, Sunnyvale, CA). The fluoremetric measurement was carried out on portions taken from 15–20 fold diluted aliquots mixed with PicoGreen™ dye (Molecular Probes, Inc., Eugene, OR) that selectively binds to double-stranded DNA. Figure 9(b) depicts the nucleic acid concentration of each aliquot as a function of its position in the elution series. The figure represents the average of three experiments, and the error bars correspond to one standard deviation. The first few aliquots contained most of the eluted nucleic acids and the concentration of nucleic acids in the aliquots decreased nearly exponentially as a function of the aliquot number. The nucleic acid concentration could be correlated with a function of the form C(n) = 522e−0 24n, where C is the concentration (ng/mL) and n is the aliquot number.
Next, 5 (μl of each of the aliquots of the eluted whole B. Cereus genomic DNA was further diluted with water and mixed with PCR reagents (see Section 2.6) and SYTO® 9 fluorescent dye (10 μM, Molecular Probes / Invitrogen UNY1001, 5 mM in DMSO) to form a 25-μl reaction volume, which was then amplified in a real-time PCR machine (Chromo4, Bio-Rad Laboratories, Hercules, CA 94547). Figure 9(c) depicts the fluorescence intensity of the PCR products corresponding to the various aliquots as a function of time. A no template control was also run to ensure that the reagents were free of contamination (no false positives). Consistent with the fluorometric DNA concentration measurement (Fig. 10(b)), the time elapsing until the appearance of a detectable signal increased as the aliquot number increased (and the corresponding DNA concentration decreased), thus reaffirming that the DNA concentration in the aliquots decreased as the aliquot number increased. Figure 9(c) suggest that the wash and drying steps used were sufficiently effective to suppress inhibitory effects that can be caused by residual ethanol in the elute (Boom et al. 1990).
Fig. 10.
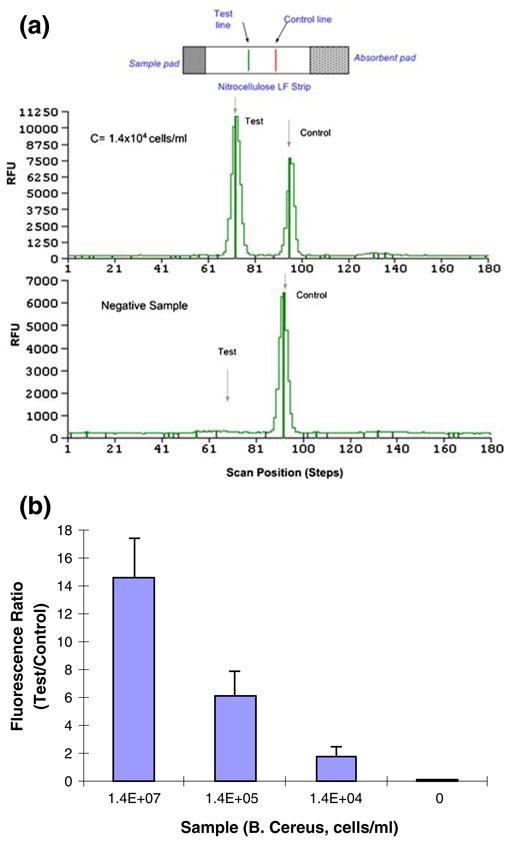
(a) Scan of processed saliva-spiked with B. Cereus (1.4×10⁴ cells/mL) sample. The emission intensity (in relative fluorescent units) is depicted as a function of position along the strip. (b) The ratio of the test and the control signals (T/C) of saliva samples spiked with B. Cereus as a function of cell concentration (cells/mL)
3.5 Detection of Pathogenic Bacteria
To demonstrate the ability of our microfluidic cassette to detect bacteria in body fluids, we prepared samples consisting of 100 μl saliva spiked with bacterial B. Cereus cells into concentration of 1.4 ×10⁷ cells/ml, 1.4×10⁵ cells/ml, 1.4×10⁴ cells/ml, and 0 cells/ml (negative control). Each sample was inserted into the sample (mixing) chamber, the cassette was activated, inserted into the analyzer, and processed. Since our analyzer does not yet include an optical reader, at the conclusion of the process, the completed lateral flow strip was scanned with an IR laser reader (Uplink, OraSure Technologies, Inc., Bethlehem, PA) to obtain the test results. The tests were repeated at least three times.
Figure 10(a) depicts a representative result of the lateral flow strip reading obtained from the test of 100-μl (1.4×10⁴ cells/ml) B. Cereus saliva sample. The figure depicts the relative fluorescence (450 nm) intensity as a function of the position along the strip. The two peaks correspond to the test line and the control line. As the target analyte concentration increases, the test peak area increases and the control peak area decreases. For scans of lateral flow strips obtained with samples of other concentrations, see supplemental information Fig. S3. The results of the test are usually reported as the ratio (T/C) of the test (T) and control (C) peak areas. Figure 10(b) depicts the ratio T/C as a function of the bacteria concentration. The T/C ratio decreased nearly exponentially as the bacteria concentration decreased. The test is deemed to be positive when the ratio T/C exceeds a predetermined threshold value (e.g., 0.5). We estimate that the detection limit of our current device is ∼ 103 to 104 cells/mL.
3.6 Detection of armored RNA HIV
To demonstrate the ability of the system to detect viral particles, we carried out a sequence of experiments with armored RNA HIV samples (Asuragen, Inc., Austin, TX 78744). Samples were prepared by spiking 100 μl of saliva with armored RNA virions into concentration of 106 virions/ml, 105 virions/ml, and 0 virions/ml (negative sample). The samples were processed in the microfluidic cassette according to the protocols described earlier in the paper. The PCR was run for 35 cycles and the results of the tests were analyzed with the lateral flow strip. The tests were repeated at least three times. The positive samples yielded a high test peak and a low control peak, while the negative sample yielded a low test peak and a high control peak (See Fig. S4 in Supplemental Information). We suspect that the weak test peak present in the negative sample scan is due to the formation of primer-dimer in the RT-PCR product (see Fig. 8(d)). Since, in contrast to the electropherogram, the lateral flow assay cannot distinguish between the amplicons and the primer-dimers, the presence of primer dimers may adversely affect the detection sensitivity of the assay. Further optimization of the RT-PCR e.g. by application of a hot-start Taq polymerase is expected to reduce primer-dimer formation. The ratio (T/C) of the areas of the test (T) and the control (C) signals is depicted in Fig. 11.
Fig. 11.

The ratio of test and control peaks as a function of armored RNA virion concentration
3.7 Detection of HIV
To prove the ability of the cassette to detect actual infectious diseases, we carried out a few preliminary tests with samples containing HIV I. Samples were prepared by spiking HIV in saliva at concentrations of 107 virons/ml, 105 virions/ml, 103 virions/ml, and 0 virions/ml (negative control). For safety reasons, prior to their introduction into the cassette, the HIV samples were inactivated with 2 volumes of binding buffer (Roche Applied Science, Mannheim, Germany) in a biosafety laboratory. The inactivated samples were then inserted into the cassette, and the nucleic acids were isolated and eluted to produce about 25 μl of eluted RNA from each sample. A 5 μl portion of each elute was amplified in on-chip RT-PCR. The RT-PCR products were visualized by agarose gel electrophoresis or detected with the lateral flow assay. Only 1 μl of the PCR products was transmitted to the lateral flow strip. Figure 12 depicts the ratio of test and control peaks of the HIV samples. Our preliminary results indicate that the cassette could detect down to 105 HIV virions/mL. The relatively high peak associated with the negative control is possibly caused by the formation of a primer-dimer. This assessment is supported by the appearance of a secondary band in the electropherograms similar to the one depicted in Fig. 8(d) and could be due to the presence of forward and reverse primers during the reverse transcriptase step.
Fig. 12.

The ratio of test and control peaks as a function of HIV concentration
4 Conclusions and outlook
An easy to use, automated, portable system for the detection of nucleic acids at the point of care is described. The system accepts an unprocessed sample of body liquid or other liquid, processes the sample, and provides an answer. The system performs multiple tasks including sample lysis; nucleic acid extraction, concentration, and purification; nucleic acid amplification; and detection. The system consists of a relatively inexpensive, disposable, single use cassette and a durable analyzer. There is no exchange of liquids between the analyzer and the cassette; thus minimizing the possibility of cross-contamination.
The cassette integrates pouch-based liquid storage and pumping; diaphragm valves; reaction chambers for fluid pumping, lysis, solid-phase nucleic acid isolation and purification, thermal cycling; dry storage of (RT-)PCR reagents with “just-in-time” release; lateral flow-based detection; and waste storage. The cassette was manufactured with polycarbonate as well as other plastic films. In small quantities, the cassette was fabricated with a laser cutter and a CNC milling machine. In large quantities, it is anticipated that the cassette will be manufactured by injection molding techniques.
The analyzer includes linear mechanical actuators to compress the cassette's pouches in a controlled manner for liquid dispensing and to actuate the cassette's valves to control the flow; thermoelectric units to control the temperature of the (RT-)PCR chamber, heaters to control the temperature of the nucleic acid isolation chamber and help remove volatile components; a vibrator to assist in mixing; a vacuum pump to assist in flow control and the removal of PCR inhibitors; and a microprocessor to time and control the sequence of operations. The analyzer interacts with computer-based software through a graphical user interface (GUI). However, the analyzer still lacks integrated optics for signal detection.
The performance of the various modules was evaluated independently and the performance of the entire cassette was tested with saliva samples spiked with bacteria (B. Cereus) to demonstrate DNA detection capability and samples laden with Armor RNA HIV virons to demonstrate RNA detection capability. A limited number of experiments were also carried out with saliva samples laden with HIV virus. The system, in its current state, successfully and reproducibly detected down to 1000 pathogen particles in the sample. It is anticipated that this generic system will be able to detect other pathogens with similar results by adjustment of the primers and reagents utilized.
Acknowledgments
The work was supported by NIH/NIDCR Grant U01DE017855.
Footnotes
Electronic supplementary material The online version of this article (doi:10.1007/s10544-010-9423-4) contains supplementary material, which is available to authorized users.
Contributor Information
Dafeng Chen, Department of Mechanical Engineering and Applied Mechanics, University of Pennsylvania, Philadelphia, PA 19104, USA.
Michael Mauk, Department of Mechanical Engineering and Applied Mechanics, University of Pennsylvania, Philadelphia, PA 19104, USA.
Xianbo Qiu, Department of Mechanical Engineering and Applied Mechanics, University of Pennsylvania, Philadelphia, PA 19104, USA.
Changchun Liu, Department of Mechanical Engineering and Applied Mechanics, University of Pennsylvania, Philadelphia, PA 19104, USA.
Jitae Kim, Department of Mechanical Engineering and Applied Mechanics, University of Pennsylvania, Philadelphia, PA 19104, USA.
Sudhir Ramprasad, Department of Mechanical Engineering and Applied Mechanics, University of Pennsylvania, Philadelphia, PA 19104, USA.
Serge Ongagna, Department of Basic Sciences, New York University College of Dentistry, New York, NY 10010, USA.
William R. Abrams, Department of Basic Sciences, New York University College of Dentistry, New York, NY 10010, USA
Daniel Malamud, Department of Basic Sciences, New York University College of Dentistry, New York, NY 10010, USA.
Paul L. A. M. Corstjens, Department of Molecular Cell Biology, Leiden University Medical Center, Leiden, The Netherlands
Haim H. Bau, Email: bau@seas.upenn.edu, Department of Mechanical Engineering and Applied Mechanics, University of Pennsylvania, Philadelphia, PA 19104, USA.
References
- Anderson RC, Su X, Bogdan GJ, Fenton J. Nucleic Acids Res. 2000;28:e60. doi: 10.1093/nar/28.12.e60. [DOI] [PMC free article] [PubMed] [Google Scholar]
- Belgrader P, Benett W, Hadley D, Richards J, Stratton P, Mariella R, Jr, Milanovich F. Science. 1999;284:449–450. doi: 10.1126/science.284.5413.449. [DOI] [PubMed] [Google Scholar]
- Belgrader P, Young S, Yuan B, Primeau M, Christel LA, Pourahmadi F, Northrup MA. Anal Chem. 2001;73:286–289. doi: 10.1021/ac000905v. [DOI] [PubMed] [Google Scholar]
- Beyor N, Yi L, Seo TS, Mathies RA. Anal Chem. 2009;81:3523–3528. doi: 10.1021/ac900060r. [DOI] [PMC free article] [PubMed] [Google Scholar]
- Blatt JM, Allen MP, Baddam S, Chase CL, Dasu BN, Dickens DM, Hardt RTHSJ, Hsu Y, Kitazawa CT, Li S, Mangan WM, Patel PJ, Pfeiffer JW, Quiwa NB, Scratch MA, Widunas JT. Clin Chem. Vol. 44. Washington, D. C.: 1998. pp. 2051–2052. [PubMed] [Google Scholar]
- Boom R, Sol CJ, Salimans MM, Jansen CL, Wertheim-van Dillen PM, van der Noordaa J. Rapid and simple method for purification of nucleic acids. J Clin Microbiol. 1990;28:495–503. doi: 10.1128/jcm.28.3.495-503.1990. [DOI] [PMC free article] [PubMed] [Google Scholar]
- Breadmore MC, Wolfe KA, Arcibal IG, Leung WK, Dickson D, Giordano BC, Power ME, Ferrance JP, Feldman SH, Norris PM, Landers JP. Anal Chem. 2003;75:1880–1886. doi: 10.1021/ac0204855. [DOI] [PubMed] [Google Scholar]
- Brivio YLM, Ahlford A, Kjeldsen BG, Reimers J, Bu M, Syvänen AC, Bang DD, Wolff A. Wolff, μTAS 2007. 2007:59–61. [Google Scholar]
- Burns MA, Johnson BN, Brahmasandra SN, Handique K, Webster JR, Krishnan M, Sammarco TS, Man PM, Jones D, Heldsinger D, Mastrangelo CH, Burke DT. Science. 1998;282:484–487. doi: 10.1126/science.282.5388.484. [DOI] [PubMed] [Google Scholar]
- Chen Z, Wang J, Qian S, Bau HH. Lab Chip. 2005;5:1277–1285. doi: 10.1039/b508275g. [DOI] [PubMed] [Google Scholar]
- Chung YC, Jan MS, Lin YC, Lin JH, Cheng WC, Fan CY. Lab Chip. 2004;4:141–147. doi: 10.1039/b310849j. [DOI] [PubMed] [Google Scholar]
- Corstjens PLAM, Lieshout LV, Zuiderwijk M, Kornelis D, Tanke HJ, Deelder AM, Dam GJV. J Clin Microbiol. 2008;24:171–176. doi: 10.1128/JCM.00877-07. [DOI] [PMC free article] [PubMed] [Google Scholar]
- Easley CJ, Karlinsey JM, Landers JP. Lab Chip. 2006a;6:601–610. doi: 10.1039/b600039h. [DOI] [PubMed] [Google Scholar]
- Easley CJ, Karlinsey JM, Bienvenue JM, Legendre LA, Roper MG, Feldman SH, Hughes MA, Hewlett EL, Merkel TJ, Ferrance JP, Landers JP. A fully integrated microfluidic genetic analysis system with sample-in-answer-out capability. Proc Natl Acad Sci USA. 2006b;19:19272–19277. doi: 10.1073/pnas.0604663103. [DOI] [PMC free article] [PubMed] [Google Scholar]
- Giordano BC, Ferrance J, Swedberg S, Hühmer AF, Landers JP. Anal Biochem. 2001;291:124–132. doi: 10.1006/abio.2000.4974. [DOI] [PubMed] [Google Scholar]
- Gong H, Ramalingam N, Chen L, Che J, Wang Q, Wang Y, Yang X, Yap PH, Neo CH. Microfluidic handling of PCR solution and DNA amplification on a reaction chamber array biochip. Biomed Microdevices. 2006;8:167–176. doi: 10.1007/s10544-006-7712-8. [DOI] [PubMed] [Google Scholar]
- Hagan KA, Bienvenue JM, Moskaluk CA, Landers JP. Microchip-based solid-phase purification of RNA from biological samples. Anal Chem. 2008;80:8453–8460. doi: 10.1021/ac8011945. [DOI] [PubMed] [Google Scholar]
- Higgins JA, Nasarabadi S, Karns JS, Shelton DR, Cooper M, Gbakima A, Koopman RP. Biosens Bioelectron. 2003;18:1115–1123. doi: 10.1016/s0956-5663(02)00252-x. [DOI] [PubMed] [Google Scholar]
- Huang FC, Liao CS, Lee GB. An integrated microfluidic chip for DNA/RNA amplification, electrophiresis, separation and on-line optical detection. Eelectrophoresis. 2006;27:3297–3305. doi: 10.1002/elps.200600458. [DOI] [PubMed] [Google Scholar]
- Ivanova N, Sorokin A, Anderson I, Galleron N, Candelon B, Kapatral V, Bhattacharyya A, Reznik G, Mikhailova N, Lapidus A, Chu L, Mazur M, Goltsman E, Larsen N, Souza M, Walunas T, Grechkin Y, Pusch G, Haselkorn R, Fonstein M, Ehrlich SD, Overbeek R, Kyrpides N. Nature. 2003;423:87–91. doi: 10.1038/nature01582. [DOI] [PubMed] [Google Scholar]
- Kim J, Byun D, Mauk MG, Bau HH. Lab Chip. 2009;9:606–612. doi: 10.1039/b807915c. [DOI] [PMC free article] [PubMed] [Google Scholar]
- Koh CG, Tan W, Zhao M, Ricco AJ, Hugh ZF. Anal Chem. 2003;75:4591–4598. doi: 10.1021/ac0343836. [DOI] [PubMed] [Google Scholar]
- Lagally ET, Emrich CA, Mathies RA. Fully integrated PCR-capillary electrophoresis microsystem for DNA analysis. Lab Chip. 2001;1:102–107. doi: 10.1039/b109031n. [DOI] [PubMed] [Google Scholar]
- Lagally ET, Scherer JR, Blazerj RG, Toriello NM, Diep BA, Ramchandani M, Sensabaugh GF, Riley LW, Mathies RA. Anal Chem. 2004;76:3162–3170. doi: 10.1021/ac035310p. [DOI] [PubMed] [Google Scholar]
- Legendre LA, Bienvenue JM, Roper MG, Ferrance JP, Landers JP. A simple, valveless microfluidic sample preparation device for extraction and amplification of DNA from nanoliter-volume samples. Anal Chem. 2006;78:1444–1451. doi: 10.1021/ac0516988. [DOI] [PubMed] [Google Scholar]
- Liu RH, Yang J, Lenigk R, Bonanno J, Grodzinski P. Grodzinski, Self-contained, fully integrated biochip for sample prepration, polymerase chain reaction, amplification, and DNA microarray detection. Anal Chem. 2004;76:1824–1831. doi: 10.1021/ac0353029. [DOI] [PubMed] [Google Scholar]
- Liu CC, Qiu XB, Ongagna S, Chen DF, Chen ZY, Abrams WR, Malamud D, Corstjens PLAM, Bau HH. Lab Chip. 2009;9:768–776. doi: 10.1039/b814322f. [DOI] [PMC free article] [PubMed] [Google Scholar]
- Mauk MG, Bau HH, Dyson AW, Ramprasad S, Chen D, Byun D. Reaction chamber having pre-stored reagents. US: 2008. [Google Scholar]
- Michael NL, Herman SA, Kwok S, Dreyer K, Wang J, Christopherson C, Spadoro JP, Young KKY, Polonis V, McCutchan FE, Carr J, Mascola JR, Jagodzinski LL, Robb ML. J Clin Microbiol. 1999;37:2557–2563. doi: 10.1128/jcm.37.8.2557-2563.1999. [DOI] [PMC free article] [PubMed] [Google Scholar]
- Murdoch DR. Molecular genetic methods in the diagnosis of lower respiratory tract infections. APMIS. 2004;112:713–727. doi: 10.1111/j.1600-0463.2004.apm11211-1202.x. [DOI] [PubMed] [Google Scholar]
- Neuzil P, Zhang C, Pipper J, Oh S, Zhuo L. Nucleic Acids Res. 2006;34:e77. doi: 10.1093/nar/gkl416. [DOI] [PMC free article] [PubMed] [Google Scholar]
- Pasloske BL, Walkerpeach CR, Obermoeller RD, Winkler M, DuBois DB. Armored RNA technology for production of ribonuclease-resistant viral RNA controls and standards. J Clin Microbiol. 1998;36:3590–3594. doi: 10.1128/jcm.36.12.3590-3594.1998. [DOI] [PMC free article] [PubMed] [Google Scholar]
- Qiu X, Thompson JA, Chen Z, Liu C, Chen D, Ramprasad S, Mauk MG, Ongagna S, Barber C, Abrams WR, Malamud D, Corstjens PLAM, Bau HH. Biomedical Microdevices. 2009 doi: 10.1007/s10544-009-9334-4. [DOI] [PMC free article] [PubMed] [Google Scholar]
- Rey MDL, May JC. Freeze-drying/lyophilization of pharmaceutical and biological products. New York: 1999. [Google Scholar]
- Rose Cdl, Prakash R, Tilley PA, Fox JD, Kaler KVIS. Integrated microfluidic systems for sample preparation and detection of respiratory pathogen bordetell pertussis. Proceedings of IEEE EMBS; 2007. [DOI] [PubMed] [Google Scholar]
- Sadler DJ, Changrani R, Roberts P, Chou CF, Zenhausern F. Thermal management of BioMEMS: temperature control for ceramic-based PCR and DNA detection devices. IEEE Trans Compon Packag Technol. 2003;26:309–316. [Google Scholar]
- Stroock AD, Dertinger SKW, Ajdari A, Mezi I, Stone HA, Whitesides GM. Chaotic mixer for microchannels. Science. 2002;295:647–651. doi: 10.1126/science.1066238. [DOI] [PubMed] [Google Scholar]
- van de Rijke F, Zijlmans H, Li S, Vail T, Raap AK, Niedbala RS, Tanke HJ. Nat Biotechnol. 2001;19:273–276. doi: 10.1038/85734. [DOI] [PubMed] [Google Scholar]
- Wang J, Chen Z, Corstjens PLAM, Mauk MG, Bau HH. Lab Chip. 2006;6:46–53. doi: 10.1039/b511494b. [DOI] [PubMed] [Google Scholar]
- Waters LC, Jacobson SC, Kroutchinina N, Khandurina J, Foote RS, Ramsey JM. Anal Chem. 1998;70:158–162. doi: 10.1021/ac970642d. [DOI] [PubMed] [Google Scholar]
- Weigl BH, Gerdes J, Tarr P, Yager P, Dillman L, Peck R, Ramachandran S, Lemba M, Kokoris M, Nabavi M, Battrell F, Hoekstra D, Klein EJ, Denno DM. Proc SPIE. 2006;6112:1–11. [Google Scholar]
- Wilding P, Shoffner MA, Kricka LJ. Clin Chem. 1994;40:1815–1818. [PubMed] [Google Scholar]
- Woollery AT, Hadley D, Landre P, deMello AJ, Mathies RA, Northrup MA. Northrup Anal Chem. 1996;68:4081–4086. doi: 10.1021/ac960718q. [DOI] [PubMed] [Google Scholar]
- Xiang Q, Xu B, Fu R, Li D. Biomed Microdevices. 2005;7:273–279. doi: 10.1007/s10544-005-6069-8. [DOI] [PubMed] [Google Scholar]
- Xiang Q, Xu B, Li D. Miniature real time PCR on chip with multichannel fiber optical fluorescence detection module. Biomed Microdevices. 2007;9:443–449. doi: 10.1007/s10544-007-9048-4. [DOI] [PubMed] [Google Scholar]
- Yager P, Edwards T, Fu KHE, Nelson K, Tam MR, Weigl BH. Nature. 2006;442:412–418. doi: 10.1038/nature05064. [DOI] [PubMed] [Google Scholar]
- Yan WP, Du LQ, Wang J, Ma LZ, Zhu JB. Simulation and experimental study of PCR chip based on silicon. Sens Actuators B Chem. 2005;108:695–699. [Google Scholar]
- Yang J, Liu Y, Rauch C, Stevens RL, Liu RH, Lenigk R, Grodzinski P. Lab Chip. 2002;2:179–187. doi: 10.1039/b208405h. [DOI] [PubMed] [Google Scholar]
- Yao L, Liu B, Chen T, Liu S, Zou T. Biomed Microdevices. 2005;7:253–257. doi: 10.1007/s10544-005-3999-0. [DOI] [PubMed] [Google Scholar]
- Zhong J, Yi M, Bau HH. A thermal cycler fabricated with low temperature co-fired ceramic tapes. Presented at IMECE 1999, MEMS 1999 Symposium Proceedings, MEMS-Vol.1; Nashville. Nov 14–19; 1999. [Google Scholar]