Abstract
Background and Aims
Water limitations can inhibit photosynthesis and change gene expression in ways that diminish or prevent reproductive development in plants. Sucrose fed to the plants can reverse the effects. To test whether the reversal acts generally by replacing the losses from photosynthesis, sucrose was fed to the stems of shaded maize plants (Zea mays) during reproductive development.
Methods
Shading was adjusted to mimic the inhibition of photosynthesis around the time of pollination in water-limited plants. Glucose and starch were imaged and quantified in the female florets. Sucrose was infused into the stems to vary the sugar flux to the ovaries.
Key Results
Ovaries normally grew rapidly and contained large amounts of glucose and starch, with a glucose gradient favouring glucose movement into the developing ovary. Shade inhibited photosynthesis and diminished ovary and kernel size, weight, and glucose and starch contents compared with controls. The glucose gradient became small. Sucrose fed to the stem reversed these losses, and kernels were as large as the controls.
Conclusions
Despite similar inhibition of photosynthesis, the depletion of ovary glucose and starch was not as severe in shade as during a comparable water deficit. Ovary abortion prevalent during water deficits did not occur in the shade. It is suggested that this difference may have been caused by more translocation in shade than during the water deficit, which prevented low sugar contents necessary to trigger an up-regulation of senescence genes known to be involved in abortion. Nevertheless, sucrose feeding reversed kernel size losses and it is concluded that feeding acted generally to replace diminished photosynthetic activity.
Keywords: Abortion, glucose, ovary development, pedicel, photosynthesis, pollination, shade, starch, sucrose, Zea mays
INTRODUCTION
Flowers often abort when plants experience water deficits around the time of pollination (Saini and Westgate, 2000; Boyer and Westgate, 2004; Boyer and McLaughlin, 2007). The abortion causes irreversible losses in seed and fruit production and can result in diminished productivity in agriculture (Salter and Goode, 1967). Generally, floral abortion is attributed to pollen sterility in small grains such as barley or wheat, or disrupted carpel development in maize (Saini and Westgate, 2000). The abortion was associated with inhibited photosynthesis in maize, and feeding sucrose to the stems in photosynthetic amounts reversed the abortion (Boyle et al., 1991a, b; Zinselmeier et al., 1995a, 1999; McLaughlin and Boyer, 2004b). The sucrose affected the expression of genes involved in the abortion (McLaughlin and Boyer, 2004b). This approach to reversing biochemical limitation was termed functional reversion and is a method to identify which genes control multigenic events (Boyer and McLaughlin, 2007).
The central role of photosynthesis in the reversion raises the possibility that the same feeding might reverse shade-induced losses in kernel development. This possibility does not appear to have been explored. Therefore, the following work exposed maize plants to shade in order to inhibit photosynthesis by the same amount as a water deficit that caused nearly complete abortion. The stems were fed sucrose to test whether the developmental effects of shading could be reversed.
MATERIALS AND METHODS
Plant material and growth conditions
Maize hybrids (Zea mays L. ‘DE2 × H99’) developed at the University of Delaware (Hawk and Weldekidan, 1999) were grown in 22-L pots containing 15·59 kg oven-dry soil mix, composed of Evesboro loamy sand, loamy substratum (coated, mesic, Typic Quartzipsamments) amended with peat and sand in volumes of 1 : 1 : 1. Dolomitic limestone (275 g per pot) was added to the mix to adjust the pH to 6·9. Two seeds were planted in each pot and the soil mix was saturated with nutrient solution (4 mm KNO3, 6 mm Ca(NO3)2·4H2O, 2 mm MgSO4·7H2O, 2 mm KH2PO4, 0·5 µm CuSO4·5H2O, 10 µm MnSO4·H2O, 2 µm ZnSO4·7H2O, 25 µm H3BO3, 0·5 µm H2MoO4 and 50 µm Fe-citrate) according to Hoagland and Arnon (1950) and allowed to drain. The pots were placed in a controlled environment chamber (Environmental Growth Chambers, Chagrin Falls, OH, USA) with day/night temperatures and relative humidities of 30 °C/20 °C ± 1 °C and 45 %/90 % ±5 %, respectively. Cool-white fluorescent lamps provided a 14-h photoperiod with a photon flux density of 700 µmol m−2 s−1 at the top of the canopy. After 2·5 weeks, seedlings were thinned to one per pot and supplied with the same nutrient solution until drainage. Nutrients were supplied twice a week. Supplemental KNO3 (12 mm) was supplied during rapid stem elongation 21–50 d after planting. All nutrient additions were terminated at silking, but water was supplied as required. Planting density was approx. 6 plants m−2, which is equivalent to field densities for this genotype.
The first day of silk appearance was designated day –5 and ears were covered with paper bags to prevent pollination. Tassels were excised from most plants 1–2 d before the first silks appeared and were stored at 4 °C in a refrigerator with their bases in a nutrient solution of 30 mm sucrose, 0·2 m KNO3, 0·2 m NH4NO3, 12·5 mm KH2PO4, 30 mm CaCl2·2H2O and 15 mm MgSO4·7H2O (Zinselmeier et al., 1999). The evening before day 0, the tassels were brought to room temperature to allow enough time for anthers to dehisce. The silk was cut to a short brush approx. 2·5 cm in length. Individual plants were hand-pollinated 1 h before the start of the photoperiod on day 0 using a mix of pollen from the stored tassels and from a few plants whose tassels remained attached.
Shade treatments
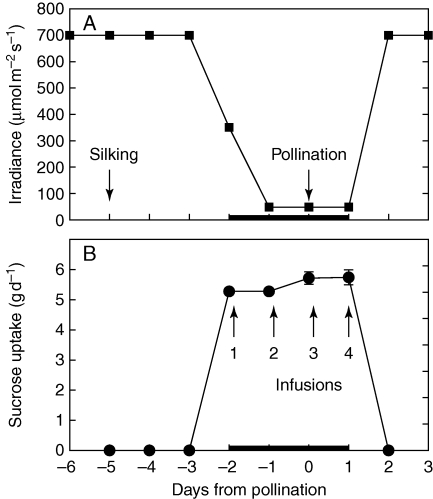
On day –2, the irradiance was reduced to 350 µmol m−2 s−1 for two-thirds of the plants to reduce photosynthesis to rates reported by McLaughlin and Boyer (2004a, b) for plants subjected to low water potential (Ψw). Then on day –1, irradiance was further reduced to 50 µmol m−2 s−1 where it remained until day 1, as in Fig. 1A. On day 2, irradiance was returned to the original 700 µmol m−2 s−1. The shade treatments were imposed by moving the plants individually to a controlled environment chamber having the required irradiance but all other conditions the same as for growth. Sucrose was fed to the stems of half of the shaded plants each day (one-third of the total plant population), as in McLaughlin and Boyer (2004a, b).
Fig. 1.
Schedule of shading and stem infusion of sucrose. To reproduce the photosynthesis rates at low water potential observed by Zinselmeier et al. (1995a) and McLaughlin and Boyer (2004a), plants were shaded, as shown in (A). To overcome the loss in photosynthetic products because of shading, stems of some of the shaded plants were infused with photosynthetic quantities of sucrose each day, as shown in (B). The black bar on the x-axis indicates the duration of shading. Data in (B) are means ± s.e. for 4–13 plants.
Stem infusions
For those plants fed sucrose, a 0·438 m solution (osmotic potential = –1·1 MPa) was infused into a small well in the stem using the method of McLaughlin and Boyer (2004a, b) modified from Boyle et al. (1991a). The infusion was carried out pre-dawn at the upper part of one internode, starting with the ear internode and moving down one internode to make a fresh infusion site on each successive day.
Water potential, photosynthesis and water usage
Leaf Ψw and net photosynthesis were measured on the unshaded third leaf from the top of the plant. This leaf was fully green throughout all treatments. At 3–4 h into the photoperiod, net photosynthesis was measured using a LI-6400 photosynthesis meter (Li-Cor Inc., Lincoln, NE, USA). The measured area was exposed to a red (670 nm) LED light source on the instrument at a photon flux density of 700 µmol m−2 s−1 except for low irradiances, which were matched by the instrument. The leaf then was sampled by removing a disc (4·2 cm2) and determining Ψw by isopiestic thermocouple psychrometry according to the method of Boyer and Knipling (1965) and Boyer (1995). Water usage was monitored gravimetrically for the whole plant by weighing the pot–soil–plant system.
In vivo starch localization
On days –5, –2, 0 and 2, fresh ovaries were detached and sliced by hand in the mid-plane parallel to the long axis of the ear. The sections were stained with I2–KI solution [0·20 % I2 (w/w) and 0·53 % KI (w/w) ] for 30 s at room temperature, briefly rinsed with deionized water, viewed under a dissecting microscope, and photographed within 1 min with a digital camera (Nikon CoolPix 990) mounted on the microscope.
In vivo glucose localization
Glucose quantity and location in vivo were detected in ovary sections using a gel-based, enzyme-coupled, fluorometric assay, according to McLaughlin and Boyer (2004a). On days –5, –2, 0 and 2, fresh ovaries were detached and quickly sliced longitudinally by hand. The sections were mounted on a slide, placed in liquid N2, stored at –80 °C, and transferred to a lyophilizer. Condensation was prevented by transporting the tissue in a covered Petri dish on a pre-cooled Al heat sink. A microscope slide containing a circular casting mold (Sigma Depth Module E, 1·3 mm depth) had been prepared by filling the mold with a liquid gel mixture consisting of 10 % Difco gelatin (BD Biosciences 211868, Franklin Lakes, NJ, USA), 5 % polyethylene glycol (400 MW, Sigma P-3265, St Louis, MO, USA), glucose oxidase (Sigma G-9010) at a final concentration of 1·8 units mL−1, horseradish peroxidase (Sigma P-8125) at a final concentration of 1·5 units mL−1 and Amplex Red Reagent at a final concentration of 200 µm in 50 mm phosphate buffer at pH 7·4. The Amplex Red Reagent was maintained in a 10 mm stock solution consisting of 60 µL DMSO (Sigma D-8418) and 154 µg Amplex Red. The gelatin mixture was allowed to gel at 4 °C protected from light before use.
The lyophilized hand sections were placed on top of the slide containing the gelled reaction mix and allowed to warm slowly while the reaction progress was followed using an epi-fluorescence microscope (Olympus AX70, Japan) with an attached CCD camera (Model 2·1·0; Diagnostic Instruments, Inc., Sterling Heights, MI, USA). The images were quantified with Image-Pro Plus software (Media Cybernetics, North Reading, MA, USA). Grey scale images were converted to pseudocolour with red equivalent to high contents and blue equivalent to low contents. All assays were made on the same day with a 1·5-min assay time in order to give adequate time for colour development but minimal diffusion.
Ovary reducing sugar and starch assays
During days –5, –2, 0 and 2, reducing sugar measurements were made with 0·5 g fresh weight of ovaries immediately frozen in liquid N2, stored at –80 °C, then ground to a fine powder using a pestle at –80 °C. Reducing sugars were extracted according to the method of Singletary and Below (1990) by adding cold ethanol (80 % v/v) to the ovary powder continuing to be ground in a pestle on ice. The slurry was vortexed occasionally in a conical centrifuge tube at 60 °C for 1 h. The slurry was centrifuged at 2000 g for 5 min and the supernatant transferred to another conical tube. The vortexing and centrifuging procedure was repeated twice at 60 °C for 30 min and the supernatants combined. The supernatant was evaporated to dryness using forced air at 40 °C and resolubilized in 4–5 mL of water and mixed thoroughly. Reducing sugars were quantified according to Nelson (1944) using a glucose standard.
During days –5, –2, 0 and 2, starch was analysed in the insoluble pellet using a modified procedure from Hanft and Jones (1986) by boiling to gelatinize the starch, then allowing the pellet to cool to room temperature. The starch was enzymatically degraded using amyloglucosidase (2 mg mL−1; Boehringer Mannheim Gmbh; lot number: 12728624–33) in 50 mm sodium acetate buffer, pH 4·5, incubated at 55 °C for 2 h. An aliquot was removed and reducing sugars were quantified according to the method of Nelson (1944).
Ovary and kernel sampling
Ten ovaries were obtained from plants during each treatment and at 10 d after the treatment. Kernels also were harvested at maturity. The samples were dried in an oven at 80 °C for 3 d and weighed.
Statistics
Five crops were grown at different times in the same controlled environment chamber, each crop with 14–16 plants arranged in a randomized complete block design, under identical environmental conditions except for shade and sucrose feeding treatments. There were four to six replicate plants in each treatment in each crop. Plants from each crop were included in the statistical treatment insofar as possible, according to measurement requirements. For example, grain yields measured at maturity could not be made in those plants harvested for ovary weights at 10 d, or for ovary weights at various times around pollination. The statistics reflect not only variation among plants in a treatment for a single crop, but also variation among crops. Data are given as averages ± standard error (number of replicates) for each experiment.
RESULTS
During the shade treatment with sucrose feeding (Fig. 1A), the plants were infused with between 5·3 and 5·7 g sucrose each day (Fig. 1B), which was sufficient to provide the daily gain in shoot dry mass normally produced by photosynthesis (Jurgens et al., 1978; Westgate and Boyer, 1985). For some infusions, two sites were used in the same internode to achieve an acceptable total uptake, i.e. a single infusion site per internode on day –2, and two infusion sites per internode on days –1, 0 and 1.
Physiological responses and ovary abortion
The shading in these experiments inhibited net photosynthesis to the same extent as low leaf water potentials in the experiments of McLaughlin and Boyer (2004a; Fig. 2A). The shade caused net photosynthesis to decrease nearly to zero for 3 d. After removing the shade, net photosynthesis on day 2 recovered completely to the control rate. Leaf water potential was typically –0·35 MPa in all the shade treatments (Fig. 2B). The shade treatments reduced plant water use from an original rate of 1·4 L d−1 to 0·35 L d−1, but water use recovered nearly completely when the shade was removed. Feeding sucrose to the stems did not change net photosynthesis, leaf water potential or water use in the shade treatments (Fig. 2).
Fig. 2.
(A) Net photosynthesis, (B) leaf water potential, (C) water usage and (D) ovary dry mass at various times when shade was imposed around pollination, as in Fig. 1A. Large open triangles (▵) in (A) show net photosynthesis observed by McLaughlin and Boyer (2004a) in controls and at low leaf water potentials. Open circles (○) indicate the control at high irradiance in the present study; closed circles (•) indicate shade; closed squares (▪) indicate shade plus sucrose infused into stems, as in Fig. 1B. Data are means ± s.e. for 4–8 plants. The s.e. is sometimes small enough to be obscured by data points.
The control ovaries (carpels with stigma and style removed) gained 0·86 mg in dry mass each day, on average, from day –5 to day 2 (Fig. 2D). By day 2, the dry mass of these ovaries was 7·5 mg. In the shade, the gain was less at 0·5 mg d−1 and may have become negative after day 0 at –0·25 mg d−1, although the decrease was not statistically significant. By day 2, the ovaries of shaded plants weighed 3 mg, or only 40 % of the control. If sucrose was fed to the stems of shaded plants, the gain was held at the control rate until day 0, after which it became slightly lower. Because of the lower weight on day 2, the ovary dry mass of the fed but shaded plants was 5·53 mg or 73 % of the control, suggesting that after the shade treatment and sugar feeding ended, the recovery in translocation was not as complete as the recovery in photosynthesis. But in general, the results indicate that the decrease in photosynthesis inhibited phloem delivery of dry mass to the ovaries, and supplying sucrose to the stems returned phloem delivery nearly to control rates.
Starch in ovaries
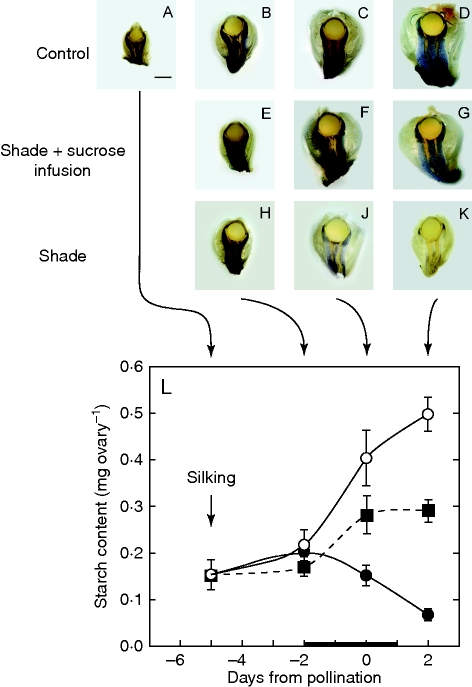
Starch was abundant in control ovaries around the nucellus but did not appear in the nucellar tissue itself (Fig. 3A–D). Instead, the starch was mostly in the pedicel around vascular termini immediately below the nucellus. The starch accumulated throughout the time around pollination (Fig. 3L). By day 2, starch was 0·5 mg ovary−1, or about 7 % of the ovary dry weight (Fig. 2D). In contrast, starch was being depleted in ovaries after shade was applied (Fig. 3H–K), becoming only 15 % of the control by day 2 (Fig. 3L). The depletion indicated that glucose was being supplied to the ovaries by the starch while photosynthesis was inhibited by the shade. If the shade was accompanied by sucrose infused into the stems, starch depletion was prevented (Fig. 3E–G), and accumulation occurred although significantly less rapidly than in the controls especially on day 2 (Fig. 3L).
Fig. 3.
In vivo starch location (A–K) and amount (L) in maize florets at various times when shade was imposed around pollination, as in Fig. 1A. Control: (A–D) Ovary on days –5, –2, 0 and 2, respectively. Starch is abundant in pedicel below spherical nucellus in ovary. Shade + sucrose infusion: (E–G) same as (B–D) except shade was started on day –2 and removed on day 2 while stems were fed sucrose solution as in Fig. 1B. Starch is partially maintained. Shade: (H–K) same as (E–G) but without sucrose feeding. Starch becomes depleted. Scale bar (applies to all micrographs) = 1 mm. (L) Starch contents of ovaries in micrographs. Open circles (○) are control at high irradiance; closed squares (▪), shade plus sucrose infused into stems; closed circles (•), shade. The black bar on the x-axis shows time when shade was present and sucrose was fed. Data are means ± s.e. for 4–6 plants.
Glucose and reducing sugars in ovaries
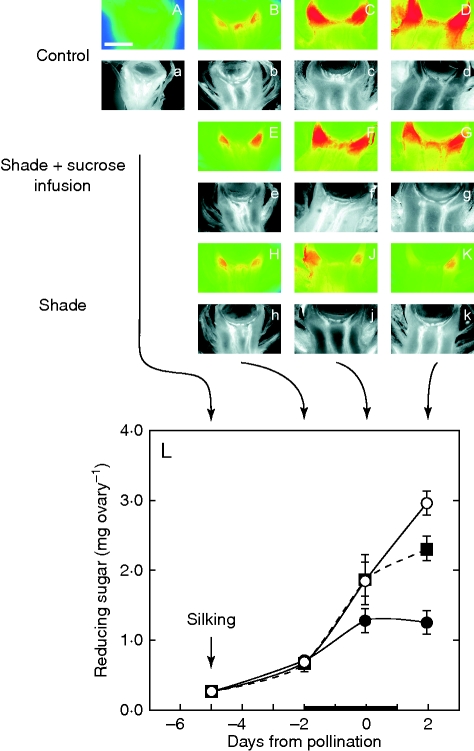
Glucose contents were generally low in the young ovary and subtending tissues on day –5 before treatments were imposed, with the highest content in the pedicel tissues just below the nucellus (Fig. 4A). As control ovaries developed, glucose accumulated in these subtending tissues (Fig. 4A–D). The accumulation was near the vascular termini visible from autofluorescence below each glucose image (Fig. 4a–d). The glucose content decreased abruptly at the border of the nucellus and remained low throughout the nucellar tissue, creating a gradient favouring movement toward the nucellus (Fig. 4A–D). If the plants were exposed to shade, glucose contents became less than in controls and the contents were being depleted after day 0 (Fig. 4H–K), reflecting the depletion of starch (Fig. 3). When sucrose was fed to the stems of the shaded plants, glucose could be detected in the same tissues as in the controls, but contents were not as high around the phloem termini nor was the pedicel/nucellus gradient as steep (Fig. 4E–G). Analysis of the reducing sugars in the ovaries indicated that controls always accumulated them (Fig. 4L), in agreement with the glucose imaging results (Fig. 4A–D). The controls contained 3 mg of hexose per ovary on day 2 (Fig. 4L), which accounted for 40 % of the ovary dry weight (Fig. 2D). After shading, ovaries accumulated the sugars less rapidly than in controls and may have decreased in sugar contents by day 2, although the decrease was not statistically significant (Fig. 4L). In shaded plants fed sucrose, sugar accumulation was as rapid as in controls except on day 2, where accumulation was a little slower and resembled the behaviour of dry weights on that day (cf. Figs 4L and 2D).
Fig. 4.
In vivo glucose location (A–K) and amount of reducing sugars (L) in maize florets at various times when shade was imposed around pollination, as in Fig. 1A. Epi-fluorescence micrographs of ovary glucose (upper-case letters) are paired with UV autofluorescence images underneath to show ovary anatomy (lower-case letters). Control: (A–D) ovary on days –5, –2, 0 and 2, respectively. Note the autofluorescing vascular tissue in (a–d) below the nucellus. Glucose (red) is abundant around the vascular termini below the nucellus and increases as the ovary develops. Shade + Sucrose infusion: (E–G) same as (B–D) except shade was started on day –2 and removed on day 2 while stems were fed sucrose solution as in Fig. 1B. Glucose appears nearly as abundant as in controls. Shade: (H–K) same as (E–G) but without sucrose feeding. Less glucose accumulates than in controls. Scale bar (applies to all micrographs) = 1 mm. (L) Reducing sugar contents of ovaries in the micrographs. Open circles (○) = control at high irradiance; closed squares (▪), shade plus sucrose infused into stems; closed circles (•), shade. The black bar on the x-axis shows the time when shade was present and sucrose was fed. Data are means ± s.e. for 4–6 plants.
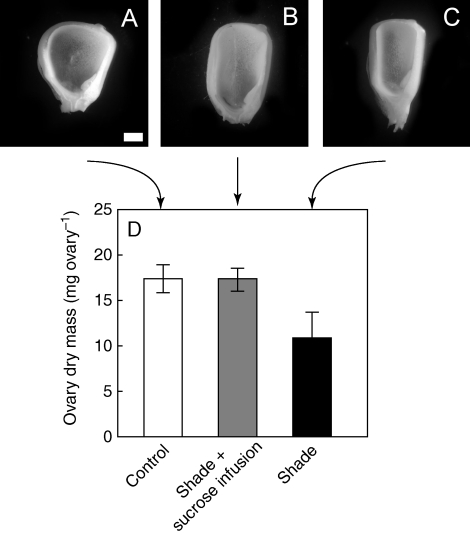
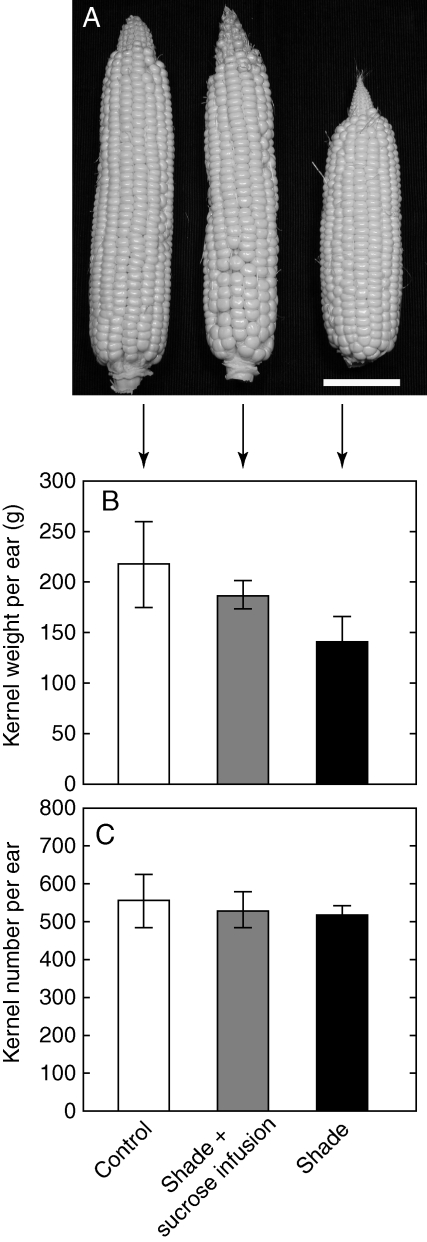
The shade treatment caused kernel size to decrease without altering the number of kernels and thus without causing abortion (Fig. 5A–C). Ten days after pollination, average ovary dry mass was 17·3 ± 1·5 mg in controls, 17·2 ± 1·3 mg in sucrose-fed shade plants, and 11·0 ± 2·7 mg in the shade treatment (Fig. 5D). These differences were not statistically significant except in the shade plants. Likewise at maturity the ears were smaller than controls only in the shade plants (Fig 6A), and kernels weighed 215 ± 40 g per ear, 183 ± 14 g per ear, and 138 ± 26 g per ear, respectively (Fig. 6B), indicating no significant difference except for lower weights in the shade plants. For all treatments, kernel numbers were between 518 and 557 per ear and not significantly different (Fig. 6C).
Fig. 5.
Ovary development (A–C) and dry mass (D) 10 d after pollination, when shade was imposed around pollination in maize plants as in Fig. 1A. (A) Unshaded controls, (B) shade plus sucrose infused into the stems, as in Fig. 1B, and (C) shade. Scale bar (applies to all micrographs) = 1 mm. Data in (D) are means ± s.e. for 4–7 plants.
Fig. 6.
(A) Ear development, (B) kernel weight and (C) kernel number at maturity when shade was imposed around pollination in maize plants as in Fig. 1A. Unshaded controls, shade plus sucrose infused into the stems, and shade treatments as indicated. Data are means ± s.e. for 4 plants. Scale bar = 5 cm.
DISCUSSION
Sucrose feeding
Sucrose feeding was effective in reversing losses in floral development whether photosynthesis was inhibited by shading, as shown here, or by water-limited conditions, as previously demonstrated (Boyle et al., 1991a, b; Zinselmeier et al., 1995a, b; McLaughlin and Boyer, 2004a, b). This indicates that sucrose feeding is generally effective, probably for any prolonged inhibition of photosynthesis. However, feeding was not effective when photosynthesis was rapid in favourable environmental conditions (Zinselmeier et al., 1995a). In the latter situation, the lack of response indicated that photosynthetic products were available and the florets developed at rates limited by their ability to use the products, i.e. they were sink-limited. But with photosynthetic inhibition lasting several days, the ovaries began to deplete their starch reserves, causing them to respond to added sucrose, i.e. they became source-limited. This switch marks a major physiological event that accounts for the difference in response to sucrose feeding. When the switch occurred, the floral fate was determined by the immediate availability of photosynthetic products at the ovary.
Zinselmeier et al. (1995a) found the switch to be specific for sucrose, which is the main translocation product (Ohshima et al., 1990). Because maize accumulates about 5 g of dry matter each day at pollination (Jurgens et al., 1978), this amount of sucrose had to be fed. The feeding occurred through a small well in the stem of the otherwise intact plants, and a marker for phloem transport (carboxyfluorescein) fed in the same way first moved upward in the xylem toward the leaves (Mäkelä et al., 2005). In the leaves, the marker was loaded into the phloem, transported to the phloem termini below the ovary, and released (Mäkelä et al., 2005). Phloem-delivered sucrose probably followed a similar path because glucose also accumulated at the phloem termini below the ovary. The glucose would have been derived from sucrose released to the apoplast because cell wall invertase was located there and would hydrolyse the sucrose (McLaughlin and Boyer, 2004a; Mäkelä et al., 2005). When low 13C sucrose was fed to the stems, the label was incorporated into the ovary (Zinselmeier et al., 1999). The ovaries thus responded to sucrose feeding by accumulating dry mass from the sucrose as though photosynthesis had produced it when in fact scarcely any net photosynthesis was occurring in the parent plant.
Importantly, without sucrose feeding or photosynthesis in the shade, the ovaries were forced to rely on starch as the main source of glucose. After the starch was depleted, the ovaries depleted the glucose and reduced their rate of development. The fed sucrose acted to prevent the depletion and allow development to continue.
Ovary developmental response
Without sucrose feeding, the ovary did not abort, which was unexpected because there is abundant evidence that shade can cause abortion (Andrade et al., 1993; Schussler and Westgate 1991a, b, 1994, 1995; Setter et al., 2001). Also, abortion was prevalent in plants experiencing similarly inhibited photosynthesis during water limitations (Boyle et al., 1991a, b; Zinselmeier et al., 1995a, b; McLaughlin and Boyer, 2004a, b). Why was abortion absent in the present study?
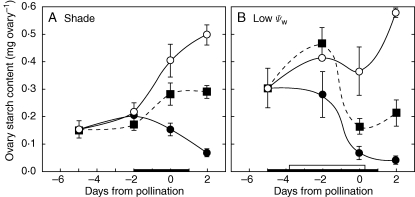
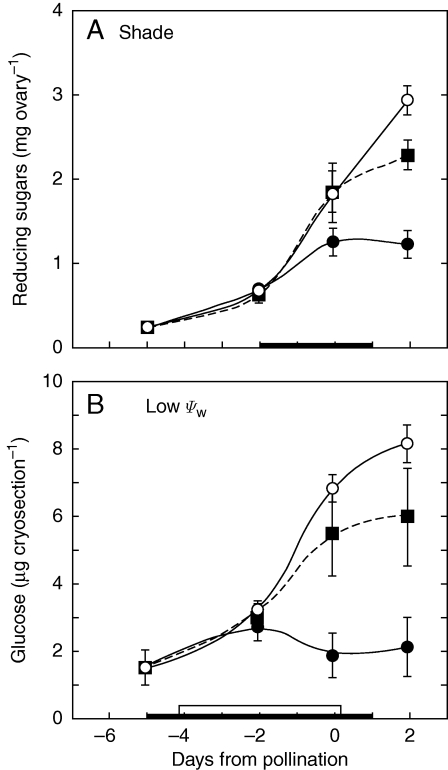
A close comparison between starch reserves in this study and those with identically inhibited photosynthesis during a water limitation indicates that, on the day of pollination (Fig. 7A and B), ovary starch was depleted to about 40 % of controls in this study but 15 % in the water-limited plants used by Zinselmeier et al. (1999). Similar differences could be seen in ovary sugars (Fig. 8A, B), which were depleted to 43 % of controls in this study but 25 % in the water-limited plants used by McLaughlin and Boyer (2004a). It thus appears that reserves were more severely depleted by water limitation than by shade despite identical inhibition of photosynthesis.
Fig. 7.
Comparison of starch content of maize ovaries when plants were shaded (A) or unwatered (B, low Ψw) to cause the same inhibition of net photosynthesis around the time of pollination, as shown in Fig. 2A. Data in (A) are from the present study and in (B) from Zinselmeier et al. (1999). Open circles (○) = control at high irradiance or adequate water; closed squares (▪), shade or water deficit plus sucrose infused into stems; closed circles (•), shade or water deficit. The black bar on the x-axis in (A) shows time when shade was present and sucrose was fed. The black bar on the x-axis in (B) shows the time water was withheld, and the white bar shows the time sucrose was fed. Data are means ± s.e. for 4–6 plants.
Fig. 8.
Comparison of sugar contents of maize ovaries when plants were shaded (A) or unwatered (B, low Ψw) to cause the same inhibition of net photosynthesis around the time of pollination, as shown in Fig. 2A. Data in (A) are for reducing sugars from the present study and in (B) are for glucose from McLaughlin and Boyer (2004a). Open circles (○) = control at high irradiance or adequate water; closed squares (▪), shade or water deficit plus sucrose infused into stems; closed circles (•), shade or water deficit. The black bar on the x-axis in (A) shows time when shade was present and sucrose was fed. The black bar on the x-axis in (B) shows the time water was withheld, and the white bar shows the time sucrose was fed. Data are means ± s.e. for 4–6 plants in (A) and 3 plants in (B).
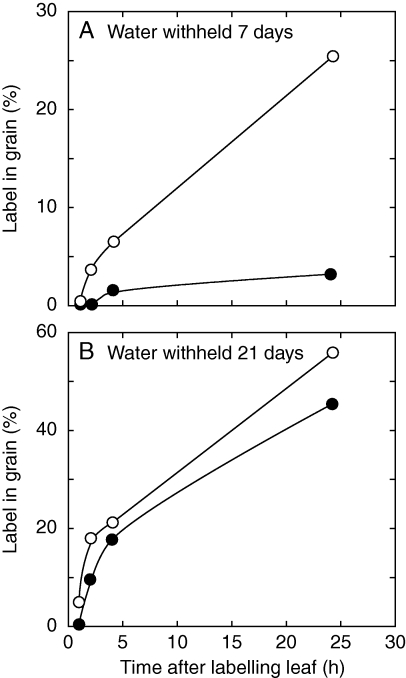
The ovary reserves would have reflected not only net photosynthesis but also the translocation of photosynthetic products to the florets by the phloem. Translocation is inhibited by water limitation (Wardlaw, 1967; Brevedan and Hodges, 1973; Munns and Pearson, 1974; Johnson and Moss, 1976; Jurgens et al., 1978; Sung and Krieg, 1979). In maize subjected to a water limitation similar to that used here and by other workers (Boyle et al., 1991a, b; Zinselmeier et al., 1995a, b; McLaughlin and Boyer, 2004a, b), Jurgens et al. (1978) found that translocation was markedly inhibited as a percentage of fixed carbon (Fig. 9A). Two weeks later, translocation had resumed (Fig. 9B). Because the experiments of Figs 2 and 9 displayed similarly inhibited photosynthesis, it seems possible that translocation was inhibited more by water limitation than by shade, which might account for the difference in depletion of the reserves shown in Figs 7 and 8.
Fig. 9.
Translocation in maize during a prolonged water deficit beginning 10 d after pollination. (A) Translocation 7 d later and (B) 21 d later in the same plants. Open circles (○) = controls supplied with water; closed circles (•), water withheld. The experiment exposed an upper leaf to 14CO2 and detected percentage of applied label arriving in the grain 24 h later. Plants were grown in the field at leaf water potentials similar to those in the present work. Data are from Jurgens et al. (1978) and were significantly different at the 5 % level for water deficit and at the 1 % level for harvest date.
Further evidence for the importance of translocation can be seen in the changes immediately following sucrose feeding. When shade was removed on day 2, photosynthesis immediately resumed but ovary dry weight, hexose and starch did not return fully to control contents (day 2, Figs 2D, 3L and 4L). Evidently, the full recovery of translocation to the ovaries was delayed for a short time while photosynthesis recovered in the parent.
Ovary molecular response
At the molecular level, there is evidence in maize that some of the genes involved in ovary development not only respond to water limitation but also to sugar contents. McLaughlin and Boyer (2004b) reported that all the genes coding for sucrose-processing enzymes were rapidly down-regulated when water was limited. Soon afterward, the activity of the enzymes was diminished, among them the acid invertases (Zinselmeier et al., 1995b; Andersen et al., 2002; McLaughlin and Boyer, 2004a). The down-regulated genes appeared to recover expression if water was resupplied (McLaughlin and Boyer, 2004b). But some of the members of the invertase gene family also responded to sucrose feeding, as in the present study (McLaughlin and Boyer, 2004b). As a consequence, the down-regulation caused by water limitation could be reversed at least partially during the water deficit. It was concluded that the reserve status of the florets provided a sugar signal to certain sugar-responsive genes regulating the processing of sucrose. The lack of delivery of photosynthetic products was thus accompanied by losses in enzyme activities responsible for processing those products.
If water remained unavailable for 2 d longer and sucrose was not fed, other genes became up-regulated that appeared to code for senescence enzymes (McLaughlin and Boyer, 2004b). Nucellus cells were dismantled, and tissue death followed 1 or 2 d afterward. These genes could have caused the irreversible loss in ovary development that would account for abortion. But some of them responded to sugar contents, triggered by glucose depletion, and feeding sucrose prevented their up-regulation during the water deficit, preventing abortion in spite of the deficit. This suggests that incomplete glucose depletion in the present shade study may not have triggered these genes, and abortion was not set in motion. Further study will be needed to determine whether this explanation is correct, and whether the sugar-responsive senescence genes account for the irreversible step in ovary abortion.
Conclusions
The results of this study broaden the interpretation of sucrose feeding beyond water-deficient plants to plants whose photosynthesis has been inhibited by a range of phenomena. This generality suggests sucrose feeding could be used for functional reversion whenever photosynthetic losses are responsible for altered development. Beyond photosynthesis, translocation appears to be an important factor in the reversion, and genes in the developing tissues often monitor the sugar status of the cells, influencing the outcome. Consequently, reversion by sucrose feeding appears to be a tool for identifying controlling processes and genes whenever development is affected by photosynthetic limitation, at least in maize.
ACKNOWLEDGEMENTS
We thank Dr James A. Hawk and Teclemarian Weldekidan for making the crosses and supplying the seed for the hybrid used in this study. The Okinawa International Exchange and Human Resources Development Foundation provided financial support for S.H.
LITERATURE CITED
- Andersen MN, Asch F, Wu Y, et al. Soluble invertase expression is an early target of drought stress during the critical, abortion-sensitive phase of young ovary development in maize. Plant Physiology. 2002;130:591–604. doi: 10.1104/pp.005637. [DOI] [PMC free article] [PubMed] [Google Scholar]
- Andrade FH, Uhart SA, Frugone MI. Intercepted radiation at flowering and kernel number in maize: shade versus plant density effects. Crop Science. 1993;33:482–485. [Google Scholar]
- Boyer JS. Measuring the water status of plants and soils. San Diego, CA: Academic Press; 1995. [Google Scholar]
- Boyer JS, Knipling EB. Isopiestic technique for measuring leaf water potential with a thermocouple psychrometer. Proceedings of the National Academy of Sciences of the USA. 1965;54:1044–1051. [PMC free article] [PubMed] [Google Scholar]
- Boyer JS, McLaughlin JE. Functional reversion to identify controlling genes in multigenic responses: analysis of floral abortion. Journal of Experimental Botany. 2007;58:267–277. doi: 10.1093/jxb/erl177. [DOI] [PubMed] [Google Scholar]
- Boyer JS, Westgate ME. Grain yields with limited water. Journal of Experimental Botany. 2004;55:2385–2394. doi: 10.1093/jxb/erh219. [DOI] [PubMed] [Google Scholar]
- Boyle MG, Boyer JS, Morgan PW. Stem infusion of maize plants. Crop Science. 1991a;31:1241–1245. [Google Scholar]
- Boyle MG, Boyer JS, Morgan PW. Stem infusion of liquid culture medium prevents reproductive failure of maize at low water potential. Crop Science. 1991b;31:1246–1252. [Google Scholar]
- Brevedan ER, Hodges HF. Effects of moisture deficits on 14C translocation in corn (Zea mays L.) Plant Physiology. 1973;52:436–439. doi: 10.1104/pp.52.5.436. [DOI] [PMC free article] [PubMed] [Google Scholar]
- Hanft JM, Jones RJ. Kernel abortion in maize. I. Carbohydrate concentration patterns and acid invertase activity of maize kernels induced to abort in vitro. Plant Physiology. 1986;81:503–510. doi: 10.1104/pp.81.2.503. [DOI] [PMC free article] [PubMed] [Google Scholar]
- Hawk JA, Weldekidan T. Registration of DE1 and DE2 parental inbred lines of maize. Crop Science. 1999;39:886. [Google Scholar]
- Hoagland DR, Arnon DI. The water culture method for growing plants without soil. California Agricultural Experimental Station Circular. 1950;347:1–32. [Google Scholar]
- Johnson RR, Moss DN. Effect of water stress on 14CO2 fixation and translocation in wheat during grain filling. Crop Science. 1976;16:697–701. [Google Scholar]
- Jurgens SK, Johnson RR, Boyer JS. Dry matter production and translocation in maize subjected to drought during grain fill. Agronomy Journal. 1978;70:678–682. [Google Scholar]
- McLaughlin JE, Boyer JS. Glucose localization in maize ovaries when kernel number decreases at low water potential and sucrose is fed to the stems. Annals of Botany. 2004a;94:75–86. doi: 10.1093/aob/mch123. [DOI] [PMC free article] [PubMed] [Google Scholar]
- McLaughlin JE, Boyer JS. Sugar-responsive gene expression, invertase activity and senescence in aborting maize ovaries at low water potentials. Annals of Botany. 2004b;94:675–689. doi: 10.1093/aob/mch193. [DOI] [PMC free article] [PubMed] [Google Scholar]
- Mäkelä P, McLaughlin JE, Boyer JS. Imaging and quantifying carbohydrate transport to the developing ovaries of maize. Annals of Botany. 2005;96:939–949. doi: 10.1093/aob/mci246. [DOI] [PMC free article] [PubMed] [Google Scholar]
- Munns R, Pearson CJ. Effect of water deficit on translocation of carbohydrate in Solanum tuberosum. Australian Journal of Plant Physiology. 1974;1:529–537. [Google Scholar]
- Nelson N. A photometric adaptation of the Somogyi method for the determination of glucose. Journal of Biological Chemistry. 1944;153:375–380. [Google Scholar]
- Ohshima T, Hayashi H, Chino M. Collection and chemical composition of pure phloem sap from Zea mays L. Plant and Cell Physiology. 1990;31:735–737. [Google Scholar]
- Saini HS, Westgate ME. Reproductive development in grain crops during drought. Advances in Agronomy. 2000;68:59–96. [Google Scholar]
- Salter PJ, Goode JE. Crop responses to water at different stages of growth. Farnham Royal, Buckinghamshire: Commonwealth Agricultural Bureaux; 1967. [Google Scholar]
- Schussler JR, Westgate ME. Maize kernel set at low water potential. I. Sensitivity to reduced assimilates during early kernel growth. Crop Science. 1991a;31:1189–1195. [Google Scholar]
- Schussler JR, Westgate ME. Maize kernel set at low water potential. II. Sensitivity to reduced assimilates at pollination. Crop Science. 1991b;31:1196–1203. [Google Scholar]
- Schussler JR, Westgate ME. Increasing assimilate reserves does not prevent kernel abortion at low water potential in maize. Crop Science. 1994;34:1569–1576. [Google Scholar]
- Schussler JR, Westgate ME. Assimilate flux determines kernel set at low water potential in maize. Crop Science. 1995;35:1074–1080. [Google Scholar]
- Setter TL, Flannigan BA, Melkonian J. Loss of kernel set due to water deficit and shade in maize: carbohydrate supplies, abscisic acid, and cytokinins. Crop Science. 2001;41:1530–1540. [Google Scholar]
- Singletary GW, Below FE. Nitrogen-induced changes in the growth and metabolism of developing maize kernels grown in vitro. Plant Physiology. 1990;92:160–167. doi: 10.1104/pp.92.1.160. [DOI] [PMC free article] [PubMed] [Google Scholar]
- Sung FJM, Krieg DR. Relative sensitivity of photosynthetic assimilation and translocation of 14Carbon to water stress. Plant Physiology. 1979;64:852–856. doi: 10.1104/pp.64.5.852. [DOI] [PMC free article] [PubMed] [Google Scholar]
- Wardlaw IF. The effect of water stress on translocation in relation to photosynthesis and growth. I. Effects during grain development in wheat. Australian Journal of Biological Sciences. 1967;20:25–39. [PubMed] [Google Scholar]
- Westgate ME, Boyer JS. Carbohydrate reserves and reproductive development at low leaf water potentials in maize. Crop Science. 1985;25:762–769. [Google Scholar]
- Zinselmeier C, Jeong BR, Boyer JS. Starch and the control of kernel number in maize at low water potentials. Plant Physiology. 1999;121:25–35. doi: 10.1104/pp.121.1.25. [DOI] [PMC free article] [PubMed] [Google Scholar]
- Zinselmeier C, Lauer MJ, Boyer JS. Reversing drought-induced losses in grain yield: sucrose maintains embryo growth in maize. Crop Science. 1995a;35:1390–1400. [Google Scholar]
- Zinselmeier C, Westgate ME, Schussler JR, Jones RJ. Low water potential disrupts carbohydrate metabolism in maize (Zea mays L.) ovaries. Plant Physiology. 1995b;107:385–391. doi: 10.1104/pp.107.2.385. [DOI] [PMC free article] [PubMed] [Google Scholar]


