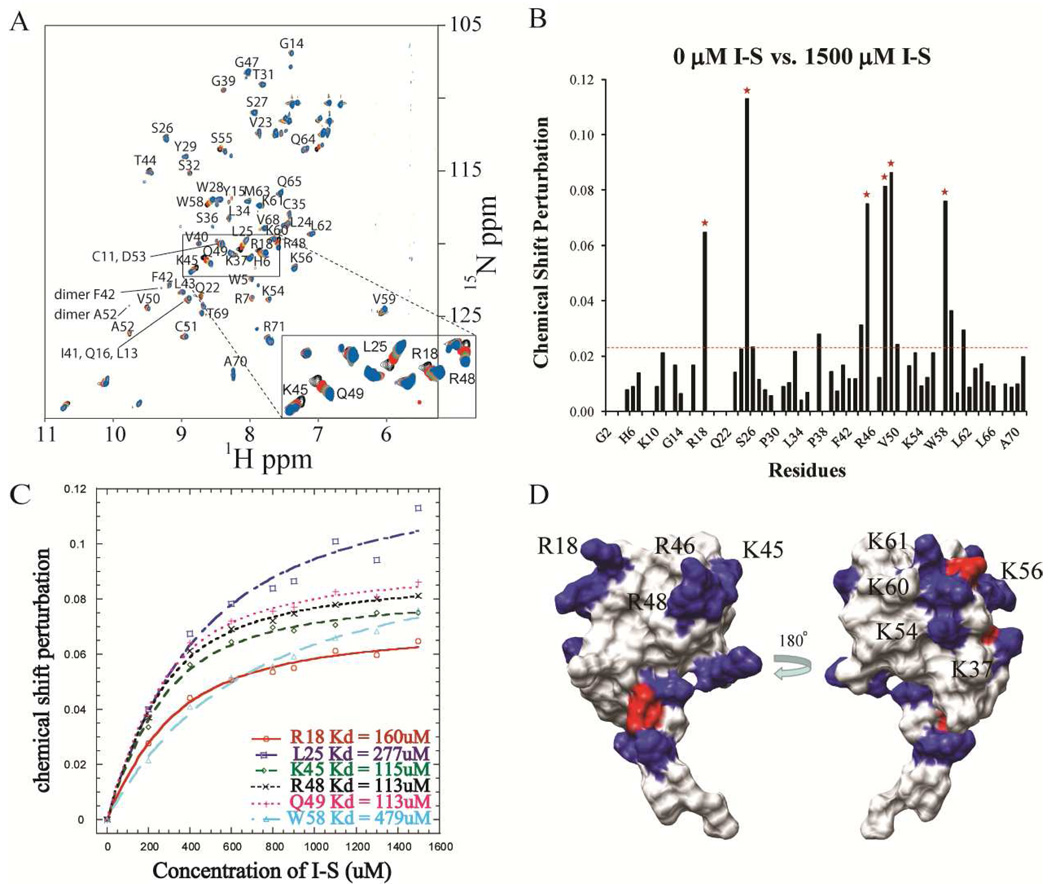
Figure 2.
A. 15N HSQC spectral overlay of wild type vMIP-II (150 µM, pH 7.4) titrated with heparin I-S disaccharide with peak assignment. Selected peaks are labeled. A separate color is shown for the spectrum at each titration amount: Black, 0 µM I-S; Red, 200 µM I-S; Green, 400 µM I-S; yellow, 600 µM I-S; Purple, 800 µM I-S; Brown, 900 µM I-S; Turquoise, 1100 µM I-S; Salmon, 1300 µM I-S; Blue, 1500 µM I-S. B. Chemical shift perturbation of wild type vMIP-II after titration with 1500 mM disaccharide I-S. The red dashed line indicates the average value of the chemical shift perturbation; the red stars indicate the residues that undergo the significant chemical shift change and do not overlap with other residues in the spectra. C. Heparin I-S binding affinity calculation for the 6 residues labeled by red stars in B. D. Surface charge figure of vMIP-II. Residues with positive charge and negative charge are colored blue and red, respectively. Left panel, the "front" surface, containing R18, R46, and R48; Right panel, the "back" surface of vMIP-II.

