Abstract
Here we report construction of a simple electromagnet with novel polepieces which apply a spatially uniform force to superparamagnetic beads in an optical microscope. The wedge-shaped gap was designed to keep ∂Bx∕∂y constant and B large enough to saturate the bead. We achieved fields of 300–600 mT and constant gradients of 67 T∕m over a sample space of 0.5×4 mm2 in the focal plane of the microscope and 0.05 mm along the microscope optic axis. Within this space the maximum force on a 2.8 μm diameter Dynabead was 12 pN with a spatial variation of approximately 10%. Use of the magnet in a biophysical experiment is illustrated by showing that gliding microtubules propelled by the molecular motor kinesin can be stopped by the force of an attached magnetic bead.
INTRODUCTION
There is a need for apparatus which can apply forces of 1–50 pN in biophysical studies of single molecules as well as organelles in live cells. Although optical tweezers have been widely used for this purpose, the commercial availability of superparamagnetic beads provides rich opportunities for novel magnetic experiments. Dynabeads (Invitrogen, Carlsbad, CA), for example, are spherical, uniform in size, and available with diverse chemical functionalization such as carboxyl, amino, and streptavidin. Depending on size, each bead contains about 106 γ-Fe2O3 nanocrystals with mean diameter 8 nm, dispersed in a polystyrene matrix, and overcoated with a thin polymer coating.1 The size of the iron oxide nanoparticles and the distance between them within a single bead are tightly controlled in order to make the beads superparamagnetic.2
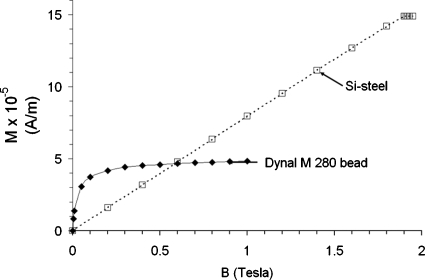
The volume magnetization of the iron oxide in Dynabeads, and the volume magnetization of 3% silicon-iron transformer steel used in the cores of our magnet, is shown in Fig. 1 to highlight the difference in their magnetic properties. The magnetization of the beads rises sharply between 0 and 0.1 T. Above approximately 0.1 T, M is constant. By contrast, the mass magnetization of 3% silicon steel increases linearly up to about 1.8 T and saturates above 1.8 T. Both the bead and Si-steel have low hysteresis. The magnetic moment of Dynal superparamagnetic beads drops to 1% of its maximum value in less than 10−5 s after the field is turned off.4 Thus these beads do not aggregate significantly by magnetic dipole-dipole attraction when the current to the magnet is zero.
Figure 1.
Volume magnetization M of Dynal M280 superparamagnetic beads and 3% silicon steel as a function of applied field B. The volume magnetization of the beads was computed from the mass fraction of iron in the beads (0.12) and the measured mass magnetization (Ref. 1). The Si-steel data were calculated from B–H data in the Handbook of Chemistry and Physics (Ref. 3).
For magnetic tweezers, we need to apply forces to the beads. The force F on a bead with magnetic moment m in a field B is given by
| (1) |
As shown in Fig. 1, the bead and the steel behave differently with B. For B<0.1 T m for the bead increases approximately linearly with B, soF∝∇(B2). However, for B>0.1 T, magnetization of the bead is saturated, m is independent of B, and F∝∇B. This is important for the design of magnetic tweezers intended for use with superparamagnetic beads. Note that 3% silicon steel saturates at about 1.8 T, limiting the maximum value of F.
A variety of magnetic tweezers have been designed for use in microscopy since Crick and Hughes first applied magnetic force to finely divided bits of iron rust in chick fibroblasts.5 Some tweezers utilize a single sharply pointed polepiece.6B, ∇B, and F then point toward the sharp tip. The magnitude of F can reach 3000 pN but is highly nonuniform spatially. Nevertheless, if several independently activated pointed tips are positioned around the bead, both the magnitude and direction of the net force can be controlled to make a three-dimensional (3D) magnetic force microscope.7
More uniform force fields can be achieved by placing anti-Helmholtz coils (for ∇B) and Helmholtz coils (for B) on coaxial iron cores with a uniform gap.8 In this geometry, B, ∇B, andF are more uniform and point toward the face of one of the flat polepieces. Another way to achieve a uniform force field is to arrange four poles as a quadrupole. This idea, widely used in particle accelerators, has been adapted to microscopy.9
A simpler type of magnetic tweezers with more uniform force can be built from only two polepieces if the gap is wedge-shaped. In this case B points from one pole to the other (x-direction) but ∇B points toward the narrow end of the gap (y-direction). Thus ∇B and F on a superparamagnetic bead are perpendicular to B. This polepiece concept has been widely used for susceptibility measurements by the Curie Method on materials such as copper. For uniform force in the y-direction, the polepieces are shaped to keep constant within the gap [Eq. 1] because the susceptibility of the sample does not saturate at accessible values of B. Garber et al.10 derived a simple analytic form to which the polepiece gap should conform to achieve constant force, assuming that the polepieces are infinitely thick. A miniaturized electromagnet with this gap design, which fits into a microscope, has been described by Hosu et al.11
We here describe an electromagnet with polepieces contoured to provide a spatially uniform force specifically tailored for work with superparamagnetic beads in a microscope. For B>0.1 T where m for such beads is saturated, uniform force in the y-direction requires a uniform value of the field gradient ∂Bx∕∂y rather than [Eq. 1]. The working distances of high numerical aperture (NA), high-magnification microscope objectives, and condensers require that the polepieces be 2 mm or less thick. Edge effects are then likely to be large, requiring a fully 3D solution of Maxwell’s equations to design the magnet. We used “MAXWELL 3D” software from Ansys, Inc. (Pittsburgh, PA) to find the gap contour which kept ∂Bx∕∂y constant while also providing Bx>0.1 T over a useful region within the gap.
Our uniform force magnet can apply a force of 1–12 pN to superparamagnetic beads. Such forces are useful for testing motor proteins and polymerases in vitro and in vivo.
MAGNET DESIGN
The 3D solution of Maxwell’s equations for a trial magnet design requires input of experimental B–H curves for the magnetic materials to be used in the construction of the core and polepieces. B–H data for 3% silicon transformer steel are available in the CRC handbook.3 In addition, the geometry of the core, the shape of the polepieces, and the location of the current-carrying wires must be defined. The core cross-section was 1×1 cm2, tapering down to the polepiece cross-section of 0.2×1 cm2. A tapered transition from core to polepiece concentrated the magnetic flux in the polepiece. The polepiece thickness was dictated by the working distance of the objective (2 mm). The polepiece length (10.5 mm) was dictated by the diameter of the objective.
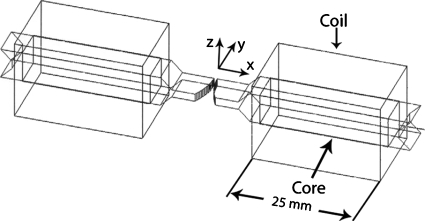
The shape of the gap was the primary focus of the design calculations. Our goal was a large and constant value of ∂Bx∕∂y with Bx>100 mT. The shape we found best was an arc with a radius of 20 mm with its center 4 mm outside the edge of the polepiece (y=4 mm in Figs. 23). Our final design is shown in Fig. 2.
Figure 2.
3D view of the magnet, as constructed in Ansoft MAXWELL 3D software. For simplicity, the copper driving coils are shown as rectangular parallelepipeds. The polepiece shape was chosen to give constant ∂Bx∕∂y in the gap. Scale: core cross-sections are 10×10 mm2. Polepieces (tongues) are 10.5 mm long×10 mm wide×2 mm high. The minimum gap is 1 mm.
Figure 3.
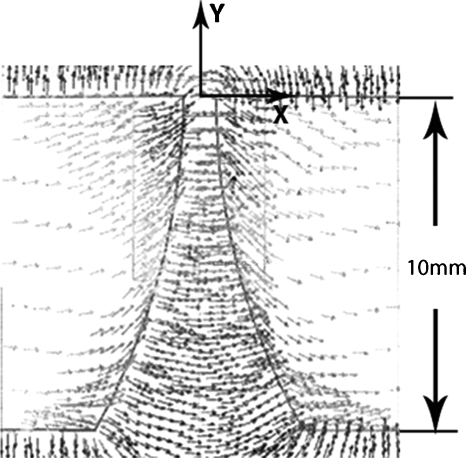
Predicted magnetic field in the gap and tips of the polepieces for 1000 A-turns excitation (Ansoft MAXWELL 3D software). The small arrows indicate the direction of B in the gap and inside the polepieces. The slice shown is at the center of the polepiece thickness.
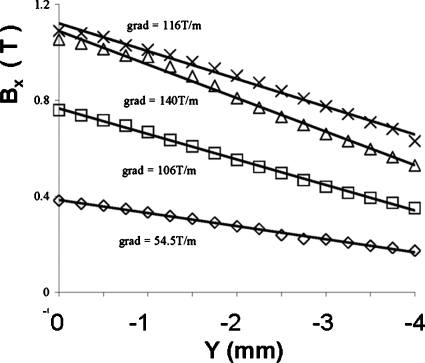
In adjusting the design of the polepieces, it was useful to display the direction and magnitude of B in the polepieces and in the gap for a given number of ampere-turns in the windings. An example of such a display through the center of the polepieces is shown in Fig. 3. The field strength along the centerline of the gap was computed by the MAXWELL 3D solver for currents of 500, 1000, 1500, and 2000 A-turns (1.25, 2.5, 3.75, and 5 A). The calculated values are shown in Fig. 4. The value of B increased linearly with ampere-turns between 0 and 1500 A-turns. However, between 1500 and 2000 A-turns, the increase in B was sublinear and ∂Bx∕∂y was lower than at 1500 A-turns. These effects are the consequences of saturation in the polepieces. From the measured saturation magnetic moment of a Dynal M280 bead (Fig. 1 and Ref. 1) and the maximum design magnetic field gradient in the linear range (140 T∕m, Fig. 4), the expected maximum useful force on one bead was calculated
| (2) |
Figure 4.
Calculated magnetic field B as a function of position along the centerline of the magnet, for 500 (◇), 1000 (◻), 1500 (▵), and 2000 (×) A-turns. The values of B in this figure are all high enough to ensure that a superparamagnetic bead would have constant m. Consequently, the force would be proportional to ∂Bx∕∂y.
MAGNET CONSTRUCTION AND TESTING
The magnet was constructed in-house. Each core was made up of 29 strips of 3% silicon-iron annealed transformer sheet steel, 0.36 mm thick (Tempel Steel, Libertyville, IL) with grain aligned along the magnet axis. The strips were laser-cut to shape by the manufacturer. The strips were coated with a thin layer of EGA-142 epoxy (IPN Industries, Haverhill, MA), placed in a compression jig, and allowed to cure. The cross-section of each core was approximately 10×10 mm2 within the coils but tapered down to 10×2 mm2 at the polepieces so that the polepieces would fit between the objective and condenser of the microscope (Fig. 2). Each core was wound with 400 turns of 18 gauge magnet wire and potted with Hysol potting epoxy (Dexter Electrical Material, Olean, NY). The two coils were wired in series as a Helmholtz pair. Their combined resistance was 1 Ω.
The magnet was mounted in an aluminum frame which replaced the standard fixed-height stage of the Nikon (Tokyo, Japan) E2000FN microscope. The x,y position of the magnet within the microscope was controlled by two precision mechanical translation stages. Current for the magnet was provided by a programmable bipolar operational power (BOP) supply (Kepco Model 20–10 D, 20 A max, 10 V max). The BOP was controlled by an IEEE 488.2 card (National Instruments, Austin, TX) hosted by a personal computer. A cooled monochrome charge-coupled device camera (Hamamatsu ORCA ER, Hamamatsu, Japan) with 8.3 frames∕s operation was used to acquire images. The digitized images were processed by a Matrox Odyssey (Dorval, PQ, Canada) vision processor operating under C++ on the host computer. Changes in current to the magnet were synchronized with the arrival time of images from the camera.
PERFORMANCE OF THE MAGNET
The performance of the magnet was assessed in two ways. In the first, a thin Hall probe was inserted into the gap to measure B directly. In the second, the velocity of superparamagnetic beads in suspension was measured by video microscopy, and the force on a bead was evaluated from the measured velocities by Stokes’ law.
Hall probe measurements
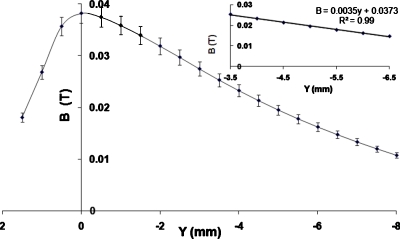
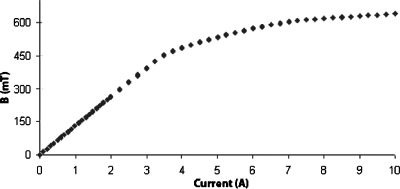
Using a 1×1×0.5 mm3Hall probe (Daedalon EP-15, Salem, MA), B was measured within the gap (see Fig. 5). The field was maximum where the gap was the smallest. Defining that point as y=0, we found that the field decreased gradually between y=0 and y=−8 mm within the gap. Outside the gap, between y=0 and 2 mm, the field dropped off sharply (Fig. 5). To determine the current at which saturation of the polepieces becomes excessive, we placed the Hall probe at y=−5 mm, and measured the Hall voltage as a function of current. The results are shown in Fig. 6. The magnetic field was linear in current until I≈3.8 A, then asymptotically approached 650 mT above I=10 A. TheMAXWELL 3D calculation (Fig. 4) showed similar behavior; B was linear up to 1500 A-turns (3.75 A) but showed saturation effects at 2000 A-turns (5 A). Heating of the magnet became a problem when I exceeded 10 A (approximately 100 W).
Figure 5.
Magnetic field B as a function of position along the centerline of the magnet, measured with a Hall probe, for I=0.2 A. The inset shows a straight-line fit for y=−5±1.5 mm, where our experiments were done. The value of R2 for the fit is 0.994.
Figure 6.
Magnetic field B as a function of current, measured with a Hall probe in the center of the gap (y=−5 mm).
From the data in Figs. 56, one can estimate the maximum field gradient within the linear range. The measured value of ∂Bx∕∂y in Fig. 5 was 3.5 T∕m for 0.2 A current. If the current was increased to 3.8 A (Fig. 6), the gradient was 68 T∕m. This is about half the gradient expected for this current from the computation by the MAXWELL 3D solver (Fig. 4). Damage to the transformer steel during assembly of the cores is one possible source for the discrepancy.
Measured force on a bead
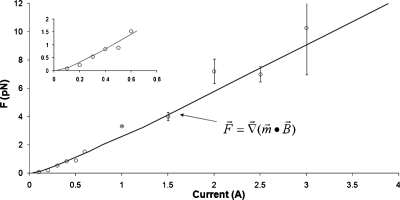
We measured the velocity v of Dynal M270 beads as a function of current in order to determine the force F on the beads. The beads were suspended in 3.6M CsCl solution to prevent settling. Images were obtained with a Nikon microscope, 60× water-immersion objective, and Imperx (Boca Raton, Fl) camera (4M15, 40 frames∕s). Beads were tracked with VIDEO SPOT TRACKER (www.cismm.org∕downloads∕). From the measured velocity, the bead radius r, and the viscosity η of the medium,12F was determined from Stokes’ law: F=6πηrv. The results are given in Fig. 7. We found that Fincreases asI2forI<0.5 A and then becomes approximately linear for larger I. This is what one would expect from Fig. 1: F∝∇(B2) for small B but F∝∇B for large B. The maximum measured force on a single bead was about 12 pN at 3.5 A. This is about half the predicted force [Eq. 2].
Figure 7.
Experimentally determined force on a single bead as a function of magnet current. The bead was at y=−5±1 mm. The increased error for large values of current occurred because the bead velocity was then large with respect to our frame rate. The curve labeled F=∇(m⋅B) was calculated from experimentally measured values of m for a M280 bead (Fig. 1), and experimentally measured values of B and ∂Bx∕∂y for our magnet, as shown in Figs. 56.
USING MAGNETIC FORCE TO STALL A MOLECULAR MOTOR
We carried out microtubule gliding assays13 on the motor protein kinesin to test the force generated by the magnet on a superparamagnetic bead. In a gliding assay, the tails of kinesin molecules adhere to a casein-coated glass surface. The motor domains of the kinesin molecules are approximately 30 nm above the surface.14 If microtubules (MTs) and adenosine triphosphate are present, the kinesin motor domains bind to nearby MTs and cause them to glide along the surface at a velocity of 500–800 nm∕s. If the MTs are fluorescently labeled, they are easily observed by fluorescence microscopy.
Preparation of fluorescent MTs with a magnetic bead attached to one end
MTs were polymerized from unlabeled tubulin, rhodamine-labeled tubulin, and biotin-labeled tubulin, all from Cytoskeleton (Denver, CO).15 Unlabeled tubulin and rhodamine-labeled tubulin were polymerized and sheared to give fluorescently tagged MTs 2–20 μm long. Biotin-labeled tubulin was then added to the reaction mixture to add a biotin-labeled tail 2–3 μm long to the +ends of pre-existing MTs.
Motility assays
Motility assays were performed in rectangular capillary tubes, 0.5×0.05×25 mm (VitroCom, Inc., Mountain Lakes, NJ). Three buffers were flowed sequentially into the capillary tube via capillary action. The first buffer contained 0.5 mg∕ml casein (Fisher), which coated the inside of the tube. The second contained 1 mM MgATP and varying amounts of Drosophila kinesin-1 (approximately 1–10 μg∕ml).16 The kinesin molecules became adsorbed to the casein-coated glass by their tail domains. Finally, a solution containing MTs and beads was flowed into the chamber. This contained 0.01 mg∕ml microtubules, 0.4 mg∕ml streptavidin-coated 2.8 μm diameter Dynabeads (Dynal∕Invitrogen), 1 mM MgATP, 20 μM taxol, 5 mM MgCl2, and antifade composed of glucose oxidase, catalase, glucose, and 2-mercaptoethanol. Most MTs had either no bead or one bead attached. The ends of the capillary tube were sealed with a biologically inert grease (Mobil FM102, Exxon-Mobil, Houston, TX). The sealed tube was then placed in the center of the magnet gap, along the y-axis.
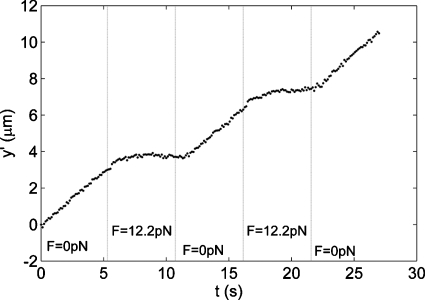
In the presence of ATP, and with the field off, the MTs were observed to glide on the kinesin-coated surface. The MT gliding velocity was 650 nm∕s, approximately the same as the “no load” velocity reported by Coy et al.16 for Drosophila kinesin. We next selected a field containing one or more MTs bearing a bead and moving in the −y direction (±10°). A 4 A magnet current was then turned on and off every 45 frames. This applied a 12.2 pN force to the bead, in the +y direction, opposite to the kinesin-driven motion. Figure 8 shows a position-time graph for such a MT. When the field was off, the MT moved at 670 nm∕s, but when the field was on, the MT was stopped by the 12.2 pN opposing force. When the magnetic force was turned off again, the microtubule recovered its original velocity. Note that the force required to stop a single kinesin motor is 7 pN,17 so this MT was probably being pulled by two or perhaps three motors.
Figure 8.
Position vs time for a fluorescently tagged MT while the magnetic field was turned on and off several times. The y-axis shows the position along the path of the MT. Data were taken at 60x∕NA 1.0 in a Nikon E600FN microscope at 25C with Hamamatsu ORCA ER (8.3 frames∕s).
DISCUSSION
We have developed a simple polepiece design with a wedge-shaped gap for an electromagnet wound as a Helmholtz pair. The shape of the polepieces was tailored to apply a uniform magnetic force to saturated superparamagnetic beads in a microscope fitted with a high-magnification, high-NA objective. Our magnet generated 0–12 pN force on each bead; this force was sufficient to reversibly stop microtubules pulled by a small number of kinesin motors. The force on the beads was limited by saturation of the polepieces and heating of the coils.
Although higher forces have been achieved with sharply pointed polepieces, our system provides uniform force over an area of approximately 0.5×4 mm. For 60× or 100× objectives, this area exceeds the field of view. This makes it easy to study and record the positions of numerous magnetic beads simultaneously.
We did not test the uniformity of the field in the z-direction, for several reasons. First, the active area of the available Hall probe was about 1×1×0.5 mm3. This was too large to give good spatial resolution in the z-direction. Second, the depth of field of high-NA objectives is only a few microns. Therefore we took care to locate the sample capillary at the midpoint of the 2-mm-thick polepieces, using kinematic design principles.
A general advantage of magnetic tweezers over optical tweezers is that the magnetic field itself is benign, whereas the intensely focused light of an optical trap can be problematic for sensitive biological samples. Both optical traps and electromagnets share the possibility of undesirable heating of the sample. For optical traps, this occurs by absorption of photons; for magnetic traps, heat is generated in the coils and conducted to the sample by thermal diffusion. For electromagnets, I2R heating occurs in the coils. The heat then flows along the cores and polepieces to the sample. Water-cooling could be used to remove the heat.
We believe that a 3D Maxwell solver is a necessary tool for the design of the thin polepieces required for microscopy. Although we used a commercial Maxwell solver for the design of our magnet, our design could be improved by additional optimization. The solver showed that the addition of a metallic return path for magnetic flux had little impact on the field in the gap. However, addition of a return path might have permitted a reduction in the overall size of the magnet. Laminated transformer steel was used in the cores to reduce heating by eddy currents at high frequencies.
A commercial bipolar power operational amplifier with computer control via IEEE 488.2 allowed us to easily code particular current sequences for experiments. For example, currents were turned on and off in synchrony with the frames of a video camera. The rise-time and fall-time of current through the magnet were both 350 μs. However, for our biophysical experiments, the current was turned on and off with a more gradual ramp over 100 ms to avoid pulling the magnetic bead off the MT.
The density of magnetic beads, 1.4–1.7 g∕cm3, causes them to sink in the usual buffers.1 To eliminate this problem while calibrating our magnet with M280 beads (Fig. 8), we suspended the beads in 3.6M CsCl, which has a density of 1.6 g∕cm3. Unfortunately, we were not able to find a similarly dense medium which was also compatible with our motor protein experiments (Fig. 8).
To keep the beads from settling in our motor protein experiments, we placed a 50-turn coil around the objective. A 2 A current through this coil provided sufficient upward force to prevent settling of the beads when the primary field was turned off.
ACKNOWLEDGMENTS
We are grateful for financial support from the U.S. National Institutes of Health [R15 Grant No. NS053493 (G.H.)], by a senior scientist mentor grant from the Dreyfus Foundation (G.H.) and by Wake Forest University funds (J.M.). We thank Markus Zahn (MIT) for sharing his experiences with Maxwell solvers.
References
- Fonnum G., Johansson C., Molteberg A., Morup S., and Aksnes E., J. Magn. Magn. Mater. 293, 41 (2005). 10.1016/j.jmmm.2005.01.041 [DOI] [Google Scholar]
- Bean C. and Livingston J., J. Appl. Phys. 30, S120 (1959). 10.1063/1.2185850 [DOI] [Google Scholar]
- CRC Handbook of Chemistry and Physics, edited by Lide D. R. (CRC, Boca Raton, FL, 1994), pp. 12–111. [Google Scholar]
- Janssen X., Schellekens A., van Ommering K., van Ijzendoorn L., and Prins M., Biosens. Bioelectron. 24, 1937 (2009). 10.1016/j.bios.2008.09.024 [DOI] [PubMed] [Google Scholar]
- Crick F. H. C. and Hughes A. F. W., Exp. Cell Res. 1, 37 (1950). 10.1016/0014-4827(50)90048-6 [DOI] [Google Scholar]
- Sato M., Wong T., Brown D., and Allen R., Cell Motil. Cytoskeleton 4, 7 (1984) 10.1002/cm.970040103 [DOI] [PubMed] [Google Scholar]; Bausch A. R., Ziemann F., Buolbitch A. A., Jacobson K., and Sackmann E., Biophys. J. 75, 2038 (1998) 10.1016/S0006-3495(98)77646-5 [DOI] [PMC free article] [PubMed] [Google Scholar]; Kollmannsberger P. and Fabry B., Rev. Sci. Instrum. 78, 114301 (2007). 10.1063/1.2804771 [DOI] [PubMed] [Google Scholar]
- Fisher J., Cribb J., Desai K., Vicci L., Wilde B., Keller K., R.TaylorII, Haase J., Bloom K., O'Brien E. T., and Superfine R., Rev. Sci. Instrum. 77, 023702 (2006) 10.1063/1.2166509 [DOI] [PMC free article] [PubMed] [Google Scholar]; Hill D., Swaminathan V., Estes A., Cribb J., and O'Brien E. T., Biophys. J. 98, 57 (2010). 10.1016/j.bpj.2009.09.048 [DOI] [PMC free article] [PubMed] [Google Scholar]
- Haber C. and Wirtz D., Rev. Sci. Instrum. 71, 4561 (2000). 10.1063/1.1326056 [DOI] [Google Scholar]
- Amblard F., Yurke B., Pagellis A., and Leibler S., Rev. Sci. Instrum. 67, 818 (1996) 10.1063/1.1146816 [DOI] [PubMed] [Google Scholar]; Huang H., Ding C. Y., Kwon H. -S., Sutin J. D. D., Roger D., and So P. T. C., Biophys. J. 82, 2211 (2002). 10.1016/S0006-3495(02)75567-7 [DOI] [PMC free article] [PubMed] [Google Scholar]
- Garber M., Henry W., and Hoeve H., Can. J. Phys. 38, 1595 (1960). [Google Scholar]
- Hosu B. G., Jakab K., Banki P., Toth F. I., and Forgacs G., Rev. Sci. Instrum. 74, 4158 (2003). 10.1063/1.1599066 [DOI] [Google Scholar]
- Lyons P. A. and Riley J. F., J. Appl. Phys. 76, 5216 (1954). [Google Scholar]
- Motility Assays for Motor Proteins, edited by Scholey J. M. (Academic, New York, 1993). [Google Scholar]
- Kerssemakers J., Howard J., Hess H., and Diez S., Proc. Natl. Acad. Sci. U.S.A. 103, 15812 (2006). 10.1073/pnas.0510400103 [DOI] [PMC free article] [PubMed] [Google Scholar]
- Gagliano J., Walb M., Blaker B., Macosko J. C., and Holzwarth G., Eur. Biophys. J. 39, 801 (2010). 10.1007/s00249-009-0560-8 [DOI] [PubMed] [Google Scholar]
- Coy D. L., Wagenbach M., and Howard J., J. Biol. Chem. 274, 3667 (1999). 10.1074/jbc.274.6.3667 [DOI] [PubMed] [Google Scholar]
- Visscher K., Schnitzer M. J., and Block S. M., Nature (London) 400, 184 (1999). 10.1038/22146 [DOI] [PubMed] [Google Scholar]


