

Abstract
Background
Existing estimates of the costs of antimicrobial resistance exhibit broad variability and the contributing factors are not well understood. This study examines factors that contribute to variation in these estimates.
Methods
Studies of the costs of resistant infections (1995-2009) were identified, abstracted, and stated in comparable terms (e.g., converted to 2007 U.S. dollars). Linear regressions were conducted to assess how costs incurred by patients with resistant infections vs. those incurred by uninfected or susceptible-organism-infected controls varied according to (1) costs incurred by control subjects; (2) study population characteristics; (3) methodological factors (e.g. matching); and (4) length of stay.
Results
Estimates of difference in costs incurred by patients with resistant infections vs. patients without resistant infections varied between -$27,609 (control costs exceeded case costs) and $126,856. Differences were greater when the costs incurred by control subjects were higher (i.e. when the underlying cost of care was high). Study-adjusted cost differences were greater for bloodstream infections (vs. any other infection site), for studies that reported median (vs. mean) costs, for studies that reported total (vs. post-infection or infection-associated) costs, for studies that used uninfected (vs. susceptible-organism-infected) controls, and for studies that did not match or adjust for length of stay prior to infection.
Conclusion
The cost of antimicrobial resistance appears to vary with the underlying cost of care. Increased costs of resistance are partially explained by longer length of stay for patients with resistant infections. Further research is needed to assess whether interventions should be differentially targeted at the highest cost cases.
Keywords: antibiotic resistance, hospital costs, length of stay
INTRODUCTION
Antimicrobial resistance is a problem of increasing proportions in hospitals, communities and long-term care facilities both in the United States and internationally. The prevalence of resistant strains of Staphylococcus aureus, Enterobacter species, and Pseudomonas aeruginosa has now surpassed that of susceptible strains in intensive care settings.1 In addition to greater morbidity and mortality, resistant infections are also associated with higher treatment costs than susceptible infections.2-3 Accurate measures of the cost of resistant infections—both in relation to susceptible infections and in absolute terms—are important for understanding the magnitude of the economic burden of resistance on hospitals, patients and third-party payers; for evaluating the cost effectiveness of initiatives to reduce resistance; and for providing guidance to managers and administrators who seek to target resources to this problem.4
While many studies have examined the economic costs of antimicrobial-resistant infections, the resulting estimates are wide-ranging.5-42 One possible explanation for the variation in cost estimates is that the cost of resistance is dependent on patient characteristics (e.g. primary diagnosis, presence of comorbidities, severity of illness, age) and/or type of care (e.g. long-term vs. acute, intensive vs. standard). It is also likely that differences in study methodology contribute to this disparity. Most economic evaluations of the impact of antimicrobial resistance compare the cost of care incurred by patients with antimicrobial-resistant infections (cases) to the cost of care incurred by patients without antimicrobial-resistant infections (controls). Previous reviews have identified several methodological issues to be considered when conducting and interpreting this type of comparative cost analysis.36, 43-44
One key factor is selection of the control group; if the control group consists of patients with antimicrobial-susceptible infections in the same body site and with the same organism as cases, then the cost difference between cases and controls represents only the cost burden of resistance; however, if the control group consists of patients with no infection, then the cost difference includes costs associated with any infection, not just those uniquely caused by resistant organisms. Therefore, the research question dictates the composition of the control group. Other important considerations for control selection are length of stay and severity of illness prior to infection, since these are independent risk factors for acquiring resistant infections that should be adjusted for by matching and/or multivariate modeling.45-47
Methods of calculating cost outcomes also vary, making it difficult to interpret cost estimates and to compare them across studies. Cost outcomes can be calculated from the perspective of the hospital (direct cost of care), the patient (cost of medical bills, follow-up, lost wages, travel), or society (loss of effective treatment for bacterial infections). Even if the study perspective is similar, cost estimates can represent either the total cost of care or only the cost of certain services. Comparisons of costs in studies conducted at different points in time are confounded by the effects of inflation. Comparisons of costs in studies conducted in different countries are complicated by the effect of currency conversion.
Finally, the literature is unclear about how differences in costs between cases and controls arise. These differences could arise because cases incur a fixed additional cost burden (as implied by a difference of means). This would occur if resistant cases required (on average) a particular regimen of additional care (such as specific costly medications and lab tests, for example), and this regimen did not vary with the setting of care or the underlying severity of disease. Second, resistant cases could incur additional costs because patients with resistant infection spend additional days in the hospital relative to controls (as would be the case if length of stay drove cost differences). Lastly, resistant cases may incur additional costs that vary with the cost of treating the underlying disease itself. This could occur because of differences in the prices of the inputs used to treat these patients or differences in service intensity patterns across hospitals. For example, patients treated for resistant infection in academic medical centers in high cost regions may incur higher costs than otherwise identical patients treated for the same infections in lower cost hospitals. This could also occur if the regimen required for treating resistant infection in severely ill patients is more costly and complex than that required for treating the same infections in less seriously ill patients. These different models may have quite different policy implications. For example, if resistant infections are associated with a fixed increase in expenditures, interventions targeted to low-cost patients may be as cost-effective as those targeted to high cost patients. Conversely, if the cost of resistance varies with underlying costs, it may make more sense to target interventions to the most costly settings and patients.
Differences in the structure of costs also have implications for estimates of the average or national cost of resistant infections. Averaging resistance costs across studies is appropriate if differences are associated with a fixed increase in expenditures, but not if costs increase with the severity and costliness of treatment provided for the underlying condition.
The purpose of this review is to examine how costs incurred by patients with resistant infections (cases) vs. those incurred by non-infected or susceptible-organism-infected control subjects (controls) varied according to (1) costs incurred by control subjects; (2) characteristics of the study population and setting (e.g., type of infection, type of care, etc.); (3) methodological characteristics of the study (e.g., type of control group, type of matching); and (4) length of stay.
METHODS
Search strategy and criteria for inclusion and exclusion
We conducted a literature review to capture original research articles that measured the costs of antibiotic-resistant infections at the patient level using a control group of either patients infected with antibiotic-susceptible organisms or uninfected patients. The search was performed in PubMed using the search term “‘cost’ and ‘resistant’ and ‘infection’” and responses were limited to articles published in English between January 1, 1995 and November 15, 2009. References, citing articles and “related articles” identified by PubMed were also considered for inclusion. Meta-analyses, studies of aggregate costs to healthcare facilities, evaluations of cost-saving interventions, studies that measured only the costs of antibiotic treatment, and studies in which the case group consisted exclusively of patients infected with organisms that were initially susceptible to antibiotics (i.e. resistance emerged over the course of treatment) were excluded. Although definitions of antimicrobial resistance have evolved over time for certain organisms, we included all
Identification of study characteristics
Each study was reviewed and classified according to method of cost calculation (total hospital stay or post-infection/infection-associated costs only); central measure of cost reported (mean or median); case mix (general, surgical or intensive, which included patients in intensive care, burn, or oncology units, and those receiving hemodialysis for end-stage renal disease), infection sites included (bloodstream only or any site/other sites), infecting organisms included (a. Staphylococcus aureus only, b. Enterococcus only, c. Acinetobacter, Pseudomonas or Enterobacter, or d. all organisms/other organisms), control group type (susceptible infection or no infection), and whether pre-infection length of stay and pre-infection primary or secondary diagnoses and/or severity of illness were adjusted for by matching or multivariable modeling. Total sample size and average length of stay for case and control groups were also collected from each article.
Selection and adjustment of cost data
Estimates of the mean costs incurred by patients with resistant infections (cases) and by patients without resistant infections (controls, who were either infected with susceptible organisms or not infected) were identified within each article. Unadjusted estimates of the difference between mean costs for cases and controls (cost differences) were also collected. Adjusted cost differences derived from multivariable modeling were extracted, if available. Where means were not reported, medians were used. If more than one control group was used (i.e. resistant vs. susceptible infection and resistant vs. no infection), the susceptible infection group was included in our analysis. In studies that reported multiple cost outcomes, we selected the mean total cost of hospitalization, if available. Where daily costs were reported, we estimated the total cost for cases and controls by multiplying the daily cost for that group by the group’s average length of stay. For studies conducted within the United States that reported charges billed to patients or third party payers in lieu of actual costs incurred by the healthcare institution, cost-to-charge ratios derived from the Healthcare Cost and Utilization Project of the Agency for Healthcare Research and Quality were applied based on geographic region and closest available year.48 International currencies were converted to U.S. dollars based on the average exchange rate in effect at the time the study was conducted. All costs were converted to 2007 U.S. dollars using the U.S. Department of Labor Bureau of Labor Statistics Consumer Price Index for medical care based on the currency reference year, if provided; otherwise, costs were inflated based on the year in which data were collected. If data collection spanned multiple years, inflated costs were calculated for each year and then averaged.
Data Analysis
We calculated the minimum, 25th percentile, median, 75th percentile, maximum, and mean unadjusted cost estimates for cases and controls. Minimum, maximum, and mean unadjusted cost differences were computed and simple linear regression was used to examine the association between control group costs and cost differences.
Weighted linear regression across studies was used to examine cost differences, controlling for control group costs. Adjusted cost differences were used, if available. Studies were weighted according to sample size. Key characteristics considered were (1) control group costs; (2) method of cost calculation (total hospital costs vs. post-infection or infection-associated costs); (3) measure of central tendency (mean vs. median); (4) case mix (surgical vs. general, intensive vs. general); (5) infection site (bloodstream infections vs. any site or other sites); (6) infecting organisms (Staphylococcus aureus vs. any organism or other organism, Enterococcus vs. any organism or other organism, Acinetobacter, Pseudomonas, or Enterobacter vs. any organism or other organism); (7) control group type (susceptible infection vs. no infection); (8) matching or adjusting for pre-infection length of stay; and (9) matching or adjusting for pre-infection primary or secondary diagnoses and/or severity of illness. In addition to t-tests of the significance of individual characteristics, we conducted F-tests for the combination of cost reporting characteristics (method of cost calculation and measure of central tendency), patient characteristics (case mix, infection site, and infecting organism), and similarity of cases and controls (control group type and matching or adjustment for pre-infection length of stay and primary or secondary diagnoses and/or severity of illness) to assess their importance in determining cost difference after controlling for control group costs. For the studies in which length of stay was reported, the same analysis was repeated including the difference in average length of stay between cases and controls. Statistical analyses were conducted in SAS (SAS Institute, Cary, NC).
RESULTS
Our search terms retrieved 914 articles, of which 36 met the inclusion criteria. In addition, two articles identified by reference and “related article” review were included. The 38 studies were representative of a broad range of patient populations, both geographically and clinically (Table 1).5-42 Six of the 38 studies (16%) included only surgical patients and 8 (21%) consisted of patients requiring intensive care. Thirteen studies (34%) included only bloodstream infections. Eighteen articles (47%) studied patients with Staphylococcus aureus, 8 (21%) studied patients with Enterococcus, and 7 (18%) studied patients with Acinetobacter, Pseudomonas or Enterobacter. Eleven studies (29%) used non-infected controls, 24 studies (63%) controlled for pre-infection primary or secondary diagnoses and/or severity of illness, and 14 (37%) controlled for pre-infection length of stay. The mean cost estimates for case and control groups were $61,593 and $37,080, respectively. Cost estimates for resistant infections ranged from $2,294 to $259,385—a difference of $257,091—and control group estimates ranged from $1,495 to $132,529 (Figure 1). The mean difference between case and control groups was $24,725 and estimates ranged from -$27,609 to $126,856—a range of $154,465.
Table 1. Study sample characteristics and reported costs of resistant infections.
| Year | Setting | Patients | Site | Organism(s) | N | Control | Matching/ modeling |
Cost | Cost of resistant infection |
Cost* difference |
Adjusted cost difference |
|---|---|---|---|---|---|---|---|---|---|---|---|
| 20025 | 1,000-bed ATC hospital, Baltimore, MD | ICU | All | Enterococcus | 22 | S | DX | Total | 51,112 | −27,609 | 17,441 |
| 20076 | 134 acute care hospitals, USA | General | All | S. aureus | 1,058 | S | Neither | Total | 11,373 | −242 | NA |
| 19997 | 320-bed ATC hospital, Boston, MA | General | All | P. aeruginosa | 309 | S | DX, LOS | Total | 10,178 | 627 | 627** |
| 20028 | 2 ATC hospitals, Canada | General | All | S. pneumoniae | 144 | S | Neither | Total | 2,294 | 799 | NA |
| 20099 | 97 hospitals, northeastern US | Surgical | SSI | S. aureus | 3,365 | S | DX | Total | 7,429 | 1,112 | 695 |
| 200310 | 375-bed long-term care facility, Hartford, CT | LTC | All | S. aureus | 90 | S | Neither | IA | 3,355 | 1,641 | NA |
| 200611 | 59 academic & non-teaching hospitals, USA | General | Resp | S. aureus | 154 | S | DX | Total | 18,893 | 1,952 | 3,586 |
| 199912 | Hospitals in 13 metropolitan-area counties of NY | General | All | S. aureus | 13,550 | S | Neither | IA | 54,131 | 3,980 | NA |
| 200413 | NA | General | All | S. aureus | 72 | S | DX, LOS | Total | 22,766 | 5,100 | 5,100** |
| 200514 | 630-bed ATC hospital, Boston, MA | General | BSI | S. aureus | 348 | S | DX | PI | 20,858 | 5,693 | 5,460 |
| 200715 | 31 academic & non-teaching hospitals, North America | General | Resp | S. pneumoniae | 122 | S | Neither | Total | 16,023 | 5,818 | NA |
| 200716 | 900-bed ATC hospital, Taiwan | General | BSI | A. baumannii | 42 | S | DX, LOS | Total | 13,272 | 6,365 | 5,336 |
| 200917 | 11 tertiary-, basic-, and specialized-care hospitals, Germany | General | All | S. aureus | 1,098 | N | DX | Total | 17,638 | 9,301 | 9,301** |
| 200818 | 1,060-bed ATC hospital, Belgium | ICU | BSI | Multiple | 92 | S | Neither | Total | 51,514 | 9,372 | NA |
| 200419 | Tertiary-care center, Ireland | Surgical | All | S. aureus | 55 | N | Neither | Total | 19,351 | 10,242 | NA |
| 199920 | 1,000-bed ATC hospital, France | ICU | All | S. aureus | 54 | N | DX, LOS | Total | 45,229 | 13,879 | 13,879** |
| 200621 | 1,200-bed ATC hospital, Israel | General | BSI | Enterobacteriaceae | 168 | S | DX, LOS | Total | 23,885 | 15,303 | 4,892 |
| 200522 | 279-bed academic level 1 trauma center, Detroit MI | Trauma | BSI | S. aureus | 277 | S | DX, LOS | Total | 30,569 | 15,503 | 13,323 |
| 200523 | 900-bed ATC hospital, Durham, NC | ESRD | BSI | S. aureus | 143 | S | DX | Total | 36,415 | 15,740 | 9,360 |
| 200124 | 650-bed ATC hospital, Westchester, NY | Oncology | BSI | Enterococcus | 74 | N | DX | Total | 32,081 | 16,711 | 16,711** |
| 200225 | Comprehensive cancer center, New York, NY | Leukemia | All | Enterococcus | 68 | N | DX, LOS | PI | 109,693 | 19,466 | 19,466** |
| 200426 | 640-bed tertiary-care hospital, Seattle, WA | General | BSI | S. aureus | 60 | S | Neither | Total | 25,852 | 20,392 | NA |
| 200927 | 719-bed tertiary-care hospital, Providence, RI | General | BSI | S. aureus | 182 | S | DX, LOS | PI | 42,445 | 21,249 | 21,249** |
| 200328 | 900-bed ATC & 350-bed community hospital, Durham, NC | Surgical | SSI | S. aureus | 286 | S | DX, LOS | Total | 56,998 | 24,424 | 6,189 |
| 200629 | Academic medical center, Memphis, TN | ESRD | BSI | S. aureus | 50 | S | Neither | Total | 58,697 | 25,676 | NA |
| 200930 | 725-bed ATC & 344-bed community hospital, Philadelphia, PA | General | All | A. baumannii | 386 | S | LOS | PI | 151,324 | 26,444 | 26,225 |
| 200631 | Academic medical center, United Kingdom | Surgical | SSI | S. aureus | 36 | N | DX | Total | NA | 28,025 | 28,025** |
| 199932 | 1,000-bed ATC and primary-care center, Durham, NC | General | BSI | S. aureus | 16 | S | DX, LOS | Total | NA | 29,030 | 29,030** |
| 200233 | 320-bed ATC hospital, Boston, MA | General | All | Enterococcus | 880 | N | DX, LOS | Total | 84,270 | 32,992 | 20,511 |
| 200634 | 625-bed ATC center, Philadelphia, PA | General | All | P. aeruginosa | 854 | S | Neither | PI | 111,707 | 45,256 | NA |
| 199835 | 588-bed ATC hospital, Chicago, IL | General | BSI | Enterococcus | 51 | S | Neither | Total | 143,581 | 46,533 | NA |
| 200936 | Urban public teaching hospital, Chicago, IL | General | All | Multiple | 1,391 | N | DX | Total | 62,475 | 48,253 | 31,297 |
| 200337 | 1,025-bed ATC hospital, Baltimore, MD | General | BSI | Enterococcus | 554 | S | DX, LOS | Total | 87,087 | 55,867 | 55,867** |
| 200538 | NA | Transplant | All | Enterococcus | 57 | N | DX | Total | 111,404 | 60,988 | 60,988** |
| 200139 | 988-bed ATC hospital, New York, NY | General | All | Enterococcus | 419 | S | Neither | Total | 164,537 | 63,541 | NA |
| 200740 | Academic medical center, Charlottesville, VA | Surgical | All | Multiple | 604 | S | DX, LOS | Total | 116,427 | 73,611 | 14,832 |
| 200741 | 400-bed academic hospital and trauma center, Denver, CO | General | All | A. baumannii | 134 | N | DX, LOS | Total | 143,098 | 79,648 | 28,422 |
| 200442 | Academic public hospital, Indianapolis, IN | Burn | All | A. baumannii | 68 | N | Neither | Total | 259,385 | 126,856 | NA |
Unadjusted, when available.
Adjusted difference equals unadjusted difference when cases and controls were matched.
Cost difference represents difference between costs incurred by patients with resistant infections and costs incurred by control subjects. All costs reported as 2007 U.S. dollars. NA, not available; ATC, academic tertiary-care; ICU, intensive care unit; LTC, long-term care; ESRD, end-stage renal disease; BSI, bloodstream infection; SSI, surgical site infection; Resp, respiratory infection; S, susceptible infection; N, no infection; DX, primary or secondary diagnoses and/or severity of illness; LOS, length of hospital stay prior to infection; IA, infection-associated costs only; PI, post-infection total costs only.
Figure 1.
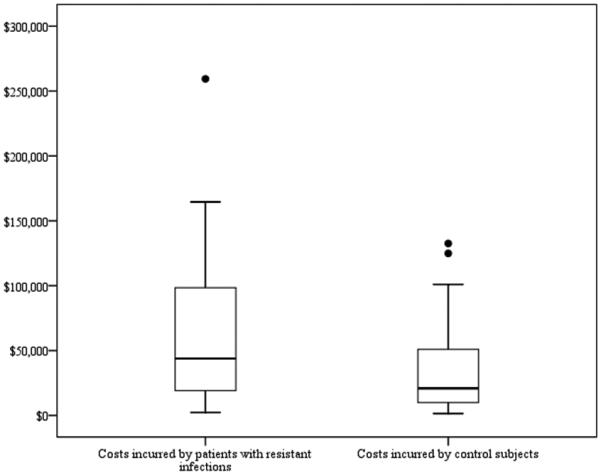
Distribution of estimates of cost of resistant infections and control episodes (N=36). Costs incurred by patients with resistant infections: Mean=$61,593; Minimum=$2,294; 25th percentile=$19,122; Median=$43,837; 75th percentile=$98,390; Maximum=$259,385. Costs incurred by control subjects: Mean=$37,080; Minimum=$1,495; 25th percentile=$9,878; Median=$20,936; 75th percentile=$50,847; Maximum=$132,529. Extreme values greater than three times the interquartile range are represented as individual points. Costs are reported in 2007 U.S. Dollars.
In the simple linear regression model, control cost estimates were somewhat predictive of unadjusted cost difference estimates (R2=0.12, Figure 2). In the weighted linear regression that does not control for differences in overall length of stay, control cost estimates were strongly and significantly positively associated with adjusted cost difference estimates, after controlling for cost calculation methods, patient and infection characteristics, and similarities between cases and controls (p<0.001, Table 2). A $1 increase in average control group costs was associated with a $0.45 increase in adjusted cost difference.
Figure 2.
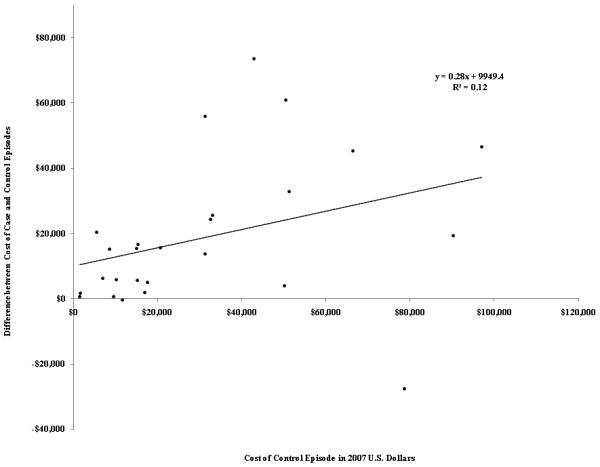
Association between costs incurred by control subjects and the difference in costs incurred by patients with resistant infections and control subjects (N=36).
Table 2. Effects of study sample, methodological characteristics, and difference in length of stay on cost difference between patients with resistant infections and control subjectsa.
| Effects of Study Sample and Methodological Characteristics Only (N=36) |
Effects of Study Sample, Methodological Characteristics, and Length of Stay Difference (N=32) |
|||
|---|---|---|---|---|
| Estimate (standard error) | p-value | Estimate (standard error) | p-value | |
| R2 | 0.84 | ---- | 0.89 | ---- |
| Intercept | 10,355 (7,416) | 0.176 | −3,337 (7,716) | 0.671 |
| Difference in length of stay | ---- | ---- | 1,181 (375) | 0.006 |
| Costs incurred by control subjects | 0.45 (0.12) | <0.001 | 0.42 (0.12) | 0.002 |
| Cost calculation | ||||
| Total cost of care episode | Reference | ---- | Reference | ---- |
| Post-infection/infection-associated costs only | −15,523 (5,750) | 0.013 | −21,687 (8,572) | 0.021 |
| Central measure of cost | ||||
| Mean | Reference | ---- | Reference | ---- |
| Median | 15,805 (6,447) | 0.022 | 15,457 (6,966) | 0.040 |
| Case mix | ||||
| General | Reference | ---- | Reference | ---- |
| Surgical | −7,041 (8,539) | 0.418 | −7,657 (7,448) | 0.318 |
| Intensive b | −15,441 (10,462) | 0.154 | −8,229 (9,952) | 0.419 |
| Infection site | ||||
| Any/other | Reference | ---- | Reference | ---- |
| Bloodstream infection | 22,752 (8,244) | 0.011 | 17,139 (8,873) | 0.069 |
| Organism | ||||
| Any/other | Reference | ---- | Reference | ---- |
| S. aureus | −13,827 (5,611) | 0.022 | −4,351 (5,776) | 0.461 |
| Enterococcus | 1,137 (8,013) | 0.888 | 7,548 (7,246) | 0.311 |
| Acinetobacter, Pseudomonas, or Enterobacter | 1,698 (7,679) | 0.827 | 16,963 (8,267) | 0.055 |
| Control group type | ||||
| Susceptible infection | Reference | ---- | Reference | ---- |
| No Infection | 17,082 (8,363) | 0.053 | 10,221 (8,561) | 0.248 |
| Matching/adjusting for pre-infection length of stay | ||||
| No | Reference | ---- | Reference | ---- |
| Yes | −15,221 (6,038) | 0.019 | −17,673 (5,390) | 0.004 |
| Matching/adjusting for pre-infection primary or secondary diagnoses and/or severity of illness |
||||
| No | Reference | ---- | Reference | ---- |
| Yes | −6,698 (8,997) | 0.464 | −4,095 (7,992) | 0.615 |
Linear regressions of differences between resistant and control group costs using the studies described in Table 1. Study-adjusted cost differences were used when available. Regressions are weighted by sample size and costs are reported in 2007 U.S. Dollars. F-tests are significant at α=0.01 level for influence of cost calculation and central measure of cost; case mix, infection site, and organism; and control group type, matching/adjusting for length of stay prior to infection, and matching/adjusting for primary or secondary diagnoses and/or severity of illness prior to infection.
Includes intensive care, burn, oncology, and end-stage renal disease.
Sample and methodological characteristics were important determinants of cost. Controlling for all other factors, cost differences were $15,523 lower if post-infection or infection-associated costs, rather than total costs, were calculated (p=0.013). The use of median cost estimates, as opposed to mean cost estimates, was associated with a $15,805 increase in the estimated cost difference (p=0.022). Studies that included only bloodstream infections reported $22,752 higher costs than studies that included any infection site (p=0.011), and those that included only infection with S. aureus reported $13,827 lower costs than studies that included any organism (p=0.022). Use of non-infected controls instead of controls with susceptible infections had a coefficient of 17,082, but this only approached significance (p=0.053). Matching or adjusting for primary or secondary diagnoses and/or severity of illness was associated with a $15,221 decrease in cost difference (p=0.019). The F-tests for the joint influences of cost reporting characteristics (method of cost calculation and measure of central tendency), patient characteristics (case mix, infection site, infecting organism), and similarity of cases and controls (control group type, matching/adjustment for pre-infection length of stay and diagnoses/severity of illness) were all significant at the α=0.01 level.
In Table 3, where analyses also control for the difference in overall length of stay between cases and controls, this length of stay difference is significantly associated with the adjusted cost difference. Effects of control group costs, method of cost calculation, measure of central tendency, case mix, and matching or adjusting for pre-infection length of stay or primary or secondary diagnoses and/or severity of illness remained the same after difference in average length of stay was added to the model. However, effects of infection site, infecting organism, and control group type were no longer significant.
DISCUSSION
In this review we sought to quantify the effects of patient characteristics, methodological factors, and length of stay on estimates of the difference in average adjusted costs between patients with resistant infections and susceptible-organism-infected or uninfected controls. Our results reinforce previous findings that cost estimates for resistant infections are extremely divergent, despite adjustments to standardize payer perspective and currency year. Estimates of the costs incurred by control subjects also ranged dramatically, which is consistent with literature that describes the variability of cost estimates for all healthcare-associated infections.49 Since estimates of the costs incurred by control subjects appear to be the most important drivers of resistant cost estimates, it is not surprising that estimates of the cost of resistance are so inconsistent.
Previous findings have suggested that methodological and case differences are important drivers of differences among cost estimates.50 Our results are somewhat consistent with this observation; in combination with control group costs, the methodological and patient-level characteristics included in our analysis explained 84 percent of the variance in cost estimates for resistant infections, whereas control group costs alone only accounted for 12 percent. The cost difference between patients with resistant infections and patients without resistant infections is greater if uninfected controls are used, compared to controls with susceptible infections; when total costs were used, compared to when post-infection costs were used; when studies did not match cases and controls for length of stay prior to infection; and when median costs were used, compared to when mean costs were used. Matching or adjusting for severity of illness was not associated with cost difference after adjusting for length of stay. Some differences in case characteristics—infection site and organism, but not case mix—affected costs differences in the model excluding length of stay. However, the significance of many of these methodological and infection factors was reduced after controlling for length of stay, suggesting that these factors affect estimates of the cost of resistant infections primarily through length of stay.
The studies examined in this review are representative of a wide variety of methodological techniques and clinical features that may affect cost estimates for episodes of infection and hospitalization more generally. However, our sample of 38 articles may not have been sufficiently large to detect statistically significant associations between these factors and cost. In some cases, we were not able to investigate the effects of different methodologies or clinical characteristics on cost because too few studies reported these factors. For example, only two studies focused on respiratory infections and only three focused on surgical site infections, so we were unable to evaluate the cost of those infection sites relative to others. It was also impossible to examine the effects of infection source because only one study looked specifically at community-acquired infections and many studies did not distinguish between infections of community and healthcare origins. Finally, definitions of antimicrobial resistance have evolved over time for many organisms, but we were unable to take these differences into account because several studies did not report the criteria used to determine resistance. Other potential limitations are the large variances—and, in some instances, small sample sizes—reported in the original articles for many of the cost estimates included in this review. Moreover, the studies considered here do not reflect the full range of situations in which resistant infection occurs. To the extent that the relationship between costs of infections associated with resistant organisms and control group costs varies with these situations, our study may not be generalizable.
The relationship between control costs and the difference between case and control costs suggests that the adjusted cost difference is associated with the cost of care for the underlying illness. This finding suggests that an accurate assessment of the adjusted cost burden of resistance will have to take into account the distribution of the underlying cost of care. The cost-effectiveness of particular interventions will depend on the cost and performance of the intervention, as well as the costs of resistant infections that are prevented. This finding implies that the costs of resistant infections avoided by interventions will likely be greatest if interventions are targeted to the highest cost populations and settings.
REFERENCES
- 1.Rosenthal VD, Maki DG, Mehta A, et al. International Nosocomial Infection Control Consortium report, data summary for 2002-2007, issued January 2008. Am J Infect Control. 2008;36:627–637. doi: 10.1016/j.ajic.2008.03.003. [DOI] [PubMed] [Google Scholar]
- 2.Salgado CD, Farr BM. Outcomes associated with vancomycin-resistant enterococci: A meta-analysis. Infect Control Hosp Epidemiol. 2003;24:690–698. doi: 10.1086/502271. [DOI] [PubMed] [Google Scholar]
- 3.Lodise TP, McKinnon PS. Burden of methicillin-resistant Staphylococcus aureus: focus on clinical and economic outcomes. Pharmacotherapy. 2007;27:1001–1012. doi: 10.1592/phco.27.7.1001. [DOI] [PubMed] [Google Scholar]
- 4.Perencevich EN, Stone PW, Wright SB, et al. Raising standards while watching the bottom line: making a business case for infection control. Infect Control Hosp Epidemiol. 2007;28:1121–1133. doi: 10.1086/521852. [DOI] [PubMed] [Google Scholar]
- 5.Pelz RK, Lipsett PA, Swoboda SM, et al. Vancomycin-sensitive and vancomycin-resistant enterococcal infections in the ICU: attributable costs and outcomes. Intensive Care Med. 2002;28:692–7. doi: 10.1007/s00134-002-1276-8. [DOI] [PubMed] [Google Scholar]
- 6.Lipsky BA, Weigelt JA, Gupta V, et al. Skin, soft tissue, bone, and joint infections in hospitalized patients: epidemiology and microbiological, clinical, and economic outcomes. Infect Control Hosp Epidemiol. 2007;28:1290–1298. doi: 10.1086/520743. [DOI] [PubMed] [Google Scholar]
- 7.Carmeli Y, Triollet N, Karchmer AW, et al. Health and economic outcomes of antibiotic resistance in Pseudomonas aeruginosa. Arch Intern Med. 1999;159:1127–1132. doi: 10.1001/archinte.159.10.1127. [DOI] [PubMed] [Google Scholar]
- 8.Quach C, Weiss K, Moore D, et al. Clinical aspects and cost of invasive Streptococcus pneumoniae infections in children: resistant vs. susceptible strains. Int J Antimicrob Agents. 2002;20:113–118. doi: 10.1016/s0924-8579(02)00127-9. [DOI] [PubMed] [Google Scholar]
- 9.Weigelt JA, Lipsky BA, Tabak YP, et al. Surgical site infections: causative pathogens and associated outcomes. Am J Infect Control. 2009 doi: 10.1016/j.ajic.2009.06.010. Epub ahead of print. [DOI] [PubMed] [Google Scholar]
- 10.Capitano B, Leshem OA, Nightingale CH, et al. Cost effect of managing methicillin-resistant Staphylococcus aureus in a long-term care facility. Am Geriatr Soc. 2003;51:10–16. doi: 10.1034/j.1601-5215.2002.51003.x. [DOI] [PubMed] [Google Scholar]
- 11.Shorr AF, Tabak YP, Gupta V, et al. Morbidity and cost burden of methicillin-resistant Staphylococcus aureus in early onset ventilator-associated pneumonia. Crit Care. 2006;10:R97. doi: 10.1186/cc4934. [DOI] [PMC free article] [PubMed] [Google Scholar]
- 12.Rubin RJ, Harrington CA, Poon A, et al. The economic impact of Staphylococcus aureus infection in New York City hospitals. Emerg Infect Dis. 1999;5:9–17. doi: 10.3201/eid0501.990102. [DOI] [PMC free article] [PubMed] [Google Scholar]
- 13.Kopp BJ, Nix DE, Armstrong EP. Clinical and economic analysis of methicillin-susceptible and -resistant Staphylococcus aureus infections. Ann Pharmacother. 2004;38:1377–1382. doi: 10.1345/aph.1E028. [DOI] [PubMed] [Google Scholar]
- 14.Cosgrove SE, Qi Y, Kaye KS, et al. The impact of methicillin resistance in Staphylococcus aureus bacteremia on patient outcomes: mortality, length of stay and hospital charges. Infect Control Hosp Epidemiol. 2005;26:166–174. doi: 10.1086/502522. [DOI] [PubMed] [Google Scholar]
- 15.Paladino JA, Adelman MH, Schentag JJ, et al. Direct costs in patients hospitalized with community-acquired pneumonia after non-response to outpatient treatment with macrolide antibacterials in the US. Pharmacoeconomics. 2007;25:677–683. doi: 10.2165/00019053-200725080-00005. [DOI] [PubMed] [Google Scholar]
- 16.Lee NY, Lee HC, Ko YN, et al. Clinical and economic impact of multidrug resistance in nosocomial Acinetobacter baumannii bacteremia. Infect Control Hosp Epidemiol. 2007;28:713–719. doi: 10.1086/517954. [DOI] [PubMed] [Google Scholar]
- 17.Resch A, Wilke M, Fink C. The cost of resistance: incremental cost of methicillin-resistant Staphylococcus aureus (MRSA) in German hospitals. Eur J Health Econ. 2009;10:287–297. doi: 10.1007/s10198-008-0132-3. [DOI] [PubMed] [Google Scholar]
- 18.Vandijck DM, Blot SI, Decruyenaere JM, et al. Costs and length of stay associated with antimicrobial resistance in acute kidney injury patients with bloodstream infection. Acta Clin Belg. 2008;63:31–38. doi: 10.1179/acb.2008.005. [DOI] [PubMed] [Google Scholar]
- 19.Watters K, O’Dwyer TP, Rowley H. Cost and morbidity of MRSA In head and neck cancer patients: what are the consequences? J Laryngol Otol. 2004;18:694–699. doi: 10.1258/0022215042244732. [DOI] [PubMed] [Google Scholar]
- 20.Chaix C, Durand-Zaleski I, Alberti C, et al. Control of endemic methicillin-resistant Staphylococcus aureus: a cost benefit analysis in an intensive care unit. JAMA. 1999;282:1745–1751. doi: 10.1001/jama.282.18.1745. [DOI] [PubMed] [Google Scholar]
- 21.Schwaber MJ, Navon-Venezia S, Kaye KS, et al. Clinical and economic impact of bacteremia with extended-spectrum-β-lactamase-producing enterobacteriaceae. Antimicrob Agents Chemother. 2006;50:1257–1262. doi: 10.1128/AAC.50.4.1257-1262.2006. [DOI] [PMC free article] [PubMed] [Google Scholar]
- 22.Lodise TP, McKinnon PS. Clinical and economic impact of methicillin resistance in patients with Staphylococcus aureus bacteremia. Diagn Microbiol Infect Dis. 2005;52:113–122. doi: 10.1016/j.diagmicrobio.2005.02.007. [DOI] [PubMed] [Google Scholar]
- 23.Reed SB, Friedman JY, Engemann, et al. Costs and outcomes among hemodialysis-dependent patients with methicillin-resistant or methicillin-susceptible Staphylococcus aureus bacteremia. Infect Control Hosp Epidemiol. 2005;26:175–183. doi: 10.1086/502523. [DOI] [PubMed] [Google Scholar]
- 24.Montecalvo MA, Jarvis WR, Uman J, et al. Costs and savings associated with infection control measures that reduced transmission of vancomycin-resistant enterococci in an endemic setting. Infect Control Hosp Epidemiol. 2001;22:437–442. doi: 10.1086/501931. [DOI] [PubMed] [Google Scholar]
- 25.Bach PB, Malak SF, Jurcic J, et al. Impact of infection by vancomycin-resistant Eneterococcus on survival and resource utilization for patients with leukemia. Infect Control Hosp Epidemiol. 2002;23:471–474. doi: 10.1086/502089. [DOI] [PubMed] [Google Scholar]
- 26.McHugh CG, Riley LW. Risk factors and costs associated with methicillin-resistant Staphylococcus aureus bloodstream infections. Infect Control Hosp Epidemiol. 2004;25:425–430. doi: 10.1086/502417. [DOI] [PubMed] [Google Scholar]
- 27.Ben-David D, Novikov I, Mermel LA. Are there differences in hospital cost between patients with nosocomial methicillin-resistant Staphylococcus aureus bloodstream infection and those with methicillin-susceptible S. aureus bloodstream infection? Infect control Hosp Epidemiol. 2009;30:453–460. doi: 10.1086/596731. [DOI] [PubMed] [Google Scholar]
- 28.Engemann JJ, Carmeli Y, Cosgrove SE, et al. Adverse clinical and economic outcomes attributable to methicillin resistance among patients with Staphylococcus aureus surgical site infection. Clin Infect Dis. 2003;36:592–598. doi: 10.1086/367653. [DOI] [PubMed] [Google Scholar]
- 29.Maclayton DO, Suda KJ, Coval KA, et al. Case-control study of the relationship between MRSA bacteremia with a vancomycin μg/mL and risk factors, costs, and outcomes in inpatients undergoing hemodialysis. Clin Ther. 2006;28:1208–1216. doi: 10.1016/j.clinthera.2006.08.003. [DOI] [PubMed] [Google Scholar]
- 30.Lautenbach E, Synnestvedt M, Weiner MG, et al. Epidemiology and impact of imipenem resistance in Acinetobacter baumannii. Infect Control Hosp Epidemiol. 2009;30:1186–1192. doi: 10.1086/648450. [DOI] [PubMed] [Google Scholar]
- 31.Nixon M, Jackson B, Varghese P, et al. Methicillin-resistant Staphylococcus aureus on orthopaedic wards: incidence, spread, mortality, cost and control. J Bone Joint Surg. 2006;88:812–817. doi: 10.1302/0301-620X.88B6.17544. [DOI] [PubMed] [Google Scholar]
- 32.Abramson MA, Sexton DJ. Nosocomial methicillin-resistant and methicillin-susceptible Staphylococcus aureus primary bacteremia: at what costs? Infect Control Hosp Epidemiol. 1999;20:408–411. doi: 10.1086/501641. [DOI] [PubMed] [Google Scholar]
- 33.Carmeli Y, Eliopoulos G, Mozaffari E, et al. Health and economic outcomes of Vancomycin-resistant enterococci. Arch Intern Med. 2002;162:2223–2228. doi: 10.1001/archinte.162.19.2223. [DOI] [PubMed] [Google Scholar]
- 34.Lautenbach E, Weiner MG, Nachamkin I, et al. Imipenem resistance among Pseudomonas aeruginosa isolates: risk factors for infection and impact of resistance on clinical and economic outcomes. Infect Control Hosp Epidemiol. 2006;27:893–900. doi: 10.1086/507274. [DOI] [PubMed] [Google Scholar]
- 35.Stosor V, Peterson LR, Postelnick M, et al. Enterococcus faecium bacteremia. Arch Intern Med. 1998;158:522–527. doi: 10.1001/archinte.158.5.522. [DOI] [PubMed] [Google Scholar]
- 36.Roberts RR, Hota B, Ahmad I, et al. Hospital and societal costs of antimicrobial-resistant infections in a Chicago teaching hospital: implications for antibiotic stewardship. Clin Infect Dis. 2009;49:1175–1184. doi: 10.1086/605630. [DOI] [PubMed] [Google Scholar]
- 37.Song X, Srinivasan A, Plaut D, et al. Effect of nosocomial vancomycin-resistant enterococcal bacteremia on mortality, length of stay, and costs. Infect Control Hosp Epidemiol. 2003;24:251–256. doi: 10.1086/502196. [DOI] [PubMed] [Google Scholar]
- 38.Gearhart M, Martin J, Rudich S, et al. Consequences of vancomycin-resistant Enterococcus in liver transplant recipients: a matched control study. Clin Transplant. 2005;19:711–716. doi: 10.1111/j.1399-0012.2005.00362.x. [DOI] [PubMed] [Google Scholar]
- 39.Webb M, Riley LW, Roberts RB. Cost of hospitalization and risk factors associated with vancomycin-resistant Enterococcus faecium infection and colonization. Clin Infect Dis. 2001;33:445–452. doi: 10.1086/321891. [DOI] [PubMed] [Google Scholar]
- 40.Evans HL, Lefrak SN, Lyman J, et al. Cost of Gram-negative resistance. Crit Care Med. 2007;35:89–95. doi: 10.1097/01.CCM.0000251496.61520.75. [DOI] [PubMed] [Google Scholar]
- 41.Young LS, Sabel AL, Price CS. Epidemiologic, clinical, and economic evaluation of an outbreak of clonal multidrug-resistant Acinetobacter baumannii Infection in a surgical intensive care unit. Infect Control Hosp Epidemiol. 2007;28:1247–1254. doi: 10.1086/521660. [DOI] [PubMed] [Google Scholar]
- 42.Wilson SJ, Knipe CJ, Zieger MJ, et al. Direct costs of multidrug-resistant Acinetobacter baumannii in the burn unit of a public teaching hospital. Am J Infect Control. 2004;32:342–344. doi: 10.1016/j.ajic.2004.02.008. [DOI] [PubMed] [Google Scholar]
- 43.Cosgrove SE, Carmeli Y. The impact of antimicrobial resistance on health and economic outcomes. Clin Infect Dis. 2003;36:1433–1437. doi: 10.1086/375081. [DOI] [PubMed] [Google Scholar]
- 44.Maragakis LL, Perencevich EN, Cosgrove SE. Clinical and economic burden of antimicrobial resistance. Expert Rev Anti Infect Ther. 2008;6:751–763. doi: 10.1586/14787210.6.5.751. [DOI] [PubMed] [Google Scholar]
- 45.Freeman J, McGowan JE., Jr. Methodologic issues in hospital epidemiology. III. Investigating the modifying effects of time and severity of underlying illness on estimates of cost of nosocomial infection. Rev Infect Dis. 1984;6:285–300. doi: 10.1093/clinids/6.3.285. [DOI] [PubMed] [Google Scholar]
- 46.Lautenbach E, Bilker WB, Brennan PJ. Enterococcal bacteremia: risk factors for vancomycin resistance and predictors of mortality. Infect Control Hosp Epidemiol. 1999;20:318–323. doi: 10.1086/501624. [DOI] [PubMed] [Google Scholar]
- 47.Shay DK, Maloney SA, Montecalvo M, et al. Epidemiology and mortality risk of vancomycin-resistant enterococcal bloodstream infections. J Infect Dis. 1995;172:993–1000. doi: 10.1093/infdis/172.4.993. [DOI] [PubMed] [Google Scholar]
- 48.Agency for Healthcare Research and Quality [Accessed January 5, 2009];Healthcare Cost and Utilization Project. Available at: http://hcupnet.ahrq.gov/
- 49.Scott RD. [Accessed January 5, 2009];The direct medical costs of healthcare-associated infections in U.S. hospitals and the benefits of prevention. Available at: http://www.cdc.gov/ncidod/dhqp/pdf/Scott_CostPaper.pdf.
- 50.Kaye KS, Engemann JJ, Mozaffari E, et al. Reference group choice and antibiotic resistance outcomes. Emerg Infect Dis. 2004;10:1125–1128. doi: 10.3201/eid1006.020665. [DOI] [PMC free article] [PubMed] [Google Scholar]