

Abstract
Objectives
To evaluate the association between protein intake and incident frailty.
Design
Prospective cohort study.
Setting
Subset of the Women’s Health Initiative Observational Study conducted at 40 clinical centers.
Participants
24,417 women aged 65-79 years who were free of frailty at baseline with plausible self-reported energy intakes (600-5000 kcal/day) by Food Frequency Questionnaire (FFQ)
Measurements
Baseline protein intake was estimated from FFQ. Calibrated estimates of energy and protein intake were corrected for measurement error using regression calibration equations estimated from objective measures of total energy expenditure (doubly labeled water) and dietary protein (24-hr urinary nitrogen). After three-years of follow-up, frailty was defined as having at least three of the following components: low physical function (measured by Rand-36 questionnaire), exhaustion, low physical activity, and unintended weight loss. Multinomial logistic regression models estimated associations for both uncalibrated and calibrated protein intake.
Results
Among the 24,417 eligible women, 3,298 (13.5%) developed frailty over three years. After adjustment for confounders, a 20% increase in uncalibrated protein intake (%kcal) was associated with a 12% (95% Confidence Interval (CI)= 8% to 16%) lower risk of frailty, while a 20% increase in calibrated protein was associated with a 32% (95% CI= 23% to 50%) lower risk of frailty.
Conclusion
Higher protein consumption, as a fraction of energy, is associated with a strong, independent, dose-responsive lower risk of incident frailty in older women. Using uncalibrated measures underestimated the strength of the association. Incorporating more protein into the diet may be an intervention target for frailty prevention.
Keywords: frailty, protein, calibration; essential amino acids; measurement error
INTRODUCTION
Frailty is a geriatric syndrome characterized by slowness, weakness, fatigue, low physical activity, and unintentional weight loss1. Frail older individuals are at substantially greater risk of many adverse health outcomes including falls, fractures, development of disabilities, hospitalizations, and death2, 3. Frailty is an increasingly important public health problem with the aging of the United States population: prevalence estimates of frailty from several population-based cohorts of women aged 65 or older range from 7.3 to 16.3%1, 3, 4.
The Health, Aging, and Body Composition Study recently reported that over a 3-year period, those in the highest quintile of protein intake lost approximately 40% less total lean mass compared to those in the lowest quintile5. This supports the hypothesis that increasing protein intake may confer protection against frailty. To date, this hypothesis has not been examined in prospective, observational studies, many of which either lack detailed dietary data or are limited by related measurement issues6, 7. The major question of clinical importance is whether the Institute of Medicine’s Recommended Dietary Allowance (RDA) for protein of 0.8 g/kg/day8 is adequate for elderly individuals, since recommendations were established based primarily on short-term nitrogen balance studies in young men9, 10 and after 14 weeks of consuming 0.8 g/kg/day of protein, older adults lost muscle 11.
We investigated protein intake in relation to incident frailty in the Women’s Health Initiative Observational Study (WHI-OS). To improve upon self-reported protein intake, we employ an approach for statistically correcting for measurement error using biomarkers for total energy and protein12. Thus, in this report we compare association findings from crude self-reported intake with findings obtained using biomarker-calibrated intake estimates. Since higher quality dietary protein is postulated to strengthen the protein frailty association13, we also examine the association between protein intake and frailty stratified by the amount of essential amino acid or protein from animal (versus vegetable) sources.
METHODS
Study Sample
The Women’s Health Initiative consisted of three overlapping clinical trials (Hormone Therapy, Dietary Modification, and Calcium/Vitamin D) and an observational study (WHI-OS). The WHI-OS, a prospective cohort study that enrolled 93,676 women ages 50-79 between 1993 and 1998 at 40 US clinical centers, has been described in detail elsewhere14. Women were eligible if they were postmenopausal, unlikely to relocate or die within 3 years, and were not participating in any clinical trials. The study was reviewed and approved by human subjects review committees at each participating institution, and each study participant provided written, informed consent.
Women were eligible for these frailty analyses if at baseline they were at least 65 years old, were not classified as frail, reported energy intake between 600 and 5000 kilocalories per day on the food frequency questionnaire (FFQ)15and were free of diagnoses or diseases that manifest as frailty or substantially modify protein intake recommendations (Parkinson disease, congestive heart failure, stroke, coronary heart disease, kidney disease, use of antidepressant medications). We also excluded study participants if exclusion criteria could not be assessed or if covariates necessary for computing calibrated protein and energy intake (BMI, age, race, education, income, smoking, physical activity) were missing, yielding a total sample size of 24,417.
Outcome Ascertainment
Frailty was assessed after three years of follow-up, using criteria developed by Fried et al 1and adapted for WHI as previously described3. Briefly, components comprising the frailty outcome were: muscle weakness/slowness, poor endurance/exhaustion, low physical activity, and unintentional weight loss. The Rand-36 Physical Function Scale (range 0-100)16, 17 was used to estimate muscle weakness and slow walking speed. Low physical activity was classified using a separate questionnaire that assessed the frequency and duration of four speeds of walking and activities in the prior week18. Energy expended per kilogram of body weight in a week of leisure time activity (including walking, mild, moderate, and strenuous) was calculated 19. Unintentional weight loss was defined as >5% body weight as measured by the difference between the baseline and year 3 follow-up combined with a self-reported item at the follow-up visit on whether recent weight loss was intentional.
For each of the three questionnaires, one point was assigned if the participant’s assessment fell in the lowest quartile of the distribution for that component. In accordance with Fried’s criteria, poor physical function, assessed as scoring in the lowest quartile on the Rand-36 Physical Function Scale, was scored as two points because it assessed both muscle strength and walking ability. Points were summed and each participant was assigned a frailty score between 0 and 5, and ≥3 was defined as frailty with a score of 1-2 termed intermediate, as previously defined20. This definition of frailty was shown to be previously strongly predictive of death, ADL disability, hospitalization, and hip fractures in this cohort3.
Exposure Measurement
WHI Food Frequency Questionnaire (FFQ)
All WHI-OS women completed the FFQ at baseline. The self-administered FFQ included 122 items for individual foods/food groups, 19 adjustment items, and summary questions15. For the frailty analyses, protein intake was characterized as a percentage of total kilocalorie intake (% kcal), total intake in grams, and as a ratio of grams of daily protein intake per kilogram of body weight8. Type of protein intake was characterized by source (animal versus vegetable). Quality of protein was summarized as the sum of essential amino acids, as defined by having a recommended intake assigned by the Joint FAO/WHO/UNU Expert Consultation (histidine, isoleucine, leucine, lysine, methionine, cysteine, phenylalanine, tyrosine, threonine, tryptophan, valine)21, 22.
Calibrated Protein Estimation
As previously described12, the WHI Nutritional Biomarkers Study (NBS) was conducted in 2004-2005 to further assess the measurement properties of the FFQ by using objective biomarkers of total energy expenditure (equivalent to energy intake in weight stable persons) and protein intake. 544 women from twelve clinical centers of the Dietary Modification trial participated in a doubly-labeled water protocol to estimate total energy expenditure over a two-week period and a urinary nitrogen protocol to estimate protein consumption over a 24-hour period to be compared with concurrent self-reported dietary intake data. Calibrated energy and protein estimates were obtained by inserting FFQ consumption estimates and other characteristics obtained from WHI Observational Study participants at baseline into regression equations, an average of 6.5 years prior to the NBS data collection.
These results demonstrated that FFQ total energy was considerably underestimated and protein was modestly underestimated, while percent of energy from protein was overestimated. Calibration equations were developed separately for energy, protein in grams, and percent of energy from protein by linear regression of log-biomarker estimates on corresponding log-FFQ estimates, body mass index, age, and other participant characteristics. We also constructed a fourth measure of protein intake by multiplying uncalibrated percentage of energy from protein reported on the FFQ by calibrated energy. The regression calibration equations were applied to the baseline FFQ data, and we related the calibrated protein estimates to subsequent frailty incidence.
Potential Confounders
Data on demographic characteristics (age, family income, education, race/ethnicity), medical history (hip fracture, emphysema, treated diabetes, hypertension (on medication and/or blood pressure >140/90 mmHg), arthritis, cancer), and other health-related characteristics (having a current health care provider, number of falls, living alone, general health status, ability to perform activities of daily living, depression) were obtained by self-report at baseline. Body mass index (BMI) was computed using measured height and weight at baseline (weight in kg / height2 in m2). Alcohol, energy, and percent of energy from total fat were estimated from the FFQ. Dietary supplement use was assessed by an inventory-type questionnaire in which study staff recorded nutrients from participants’ bottles brought to a clinic visit, including selected nutrients that may be associated with both protein intake and frailty incidence (multi-vitamin, multi-vitamin with minerals, B vitamins, and iron)23. Smoking status was classified as current, past, or never. Depressive symptoms were assessed by 6-item short form of the Center for Epidemiologic Studies Depression (CESD) Scale24. Postmenopausal hormone therapy was ascertained by interview and categorized as current, past, or never use of any estrogen with or without progestin.
Statistical Analysis
Baseline demographic, medical history, and health-related characteristics were compared according to protein expressed as a percentage of energy intake. A series of multinomial logistic regression models were used to examine associations between protein intake and incident frailty adjusting for the confounding factors stated above. The response variable was coded as not frail (referent), intermediate frailty (frailty score of 1-2), or frail (frailty score of 3-5).
Continuous log-transformed protein intake was scaled to estimate the association of a 20% increase in intake with risk of incident frailty. Models were adjusted for independent predictors of frailty identified previously including age, income, education, race/ethnicity, BMI, smoking status, alcohol consumption, physical activity, hormone therapy use, self-reported health, whether the participant lived alone, and reported medical conditions at baseline3. Separate models were fit that included other aspects of diet (total fat intake as a percent of energy and dietary supplement use) that were potential confounders of the association between protein and frailty. Analyses were also stratified by tertile of animal protein and essential amino acid intake. To assess whether any observed differences varied by protein quality, multiplicative interaction by tertile of animal protein and tertile of essential amino acid intake was evaluated by testing the significance of cross-product terms. Uncalibrated measures were used for these analyses since calibrated estimates were available for total protein only.
Uncalibrated and calibrated consumption estimates are presented to evaluate the influence of the calibration procedure. Standard error estimates of the log-odds for uncalibrated consumption estimates are derived from multinomial regression models. For calibrated log-odds standard error (SE) estimation, a bootstrap procedure (500 bootstrap samples) was applied to account for uncertainty in the calibration equation estimates. The relation between uncalibrated and calibrated measures of protein intake was assessed using Spearman correlations. The association between type of protein intake and incident frailty was examined within tertiles of protein source (animal versus vegetable) and quality (essential amino acids). Evidence for interaction by age, body mass index, and number of chronic diseases was evaluated using models including the cross product between calibrated protein intake and the potential effect modifier. All analyses were conducted in SAS (SAS, Cary, NC, V9.2). Statistical significance was defined as P<0.05.
RESULTS
Higher protein intake was positively associated with measures of socioeconomic status (having more years of education, white race, higher income, more current hormone therapy use, not living alone at baseline, having a current health care provider). Some factors associated with better health were associated with protein intake (being younger, non-smoker, having lower scores on the depression measure, not having a history of cancer or hypertension) while other factors associated with higher protein intake were associated with lower health status (having arthritis and treated diabetes) (Table 1). Mean calibrated percent energy from protein (Mean=14.3%, SD= 1.3%) estimates were lower and less variable than uncalibrated estimates (Mean=17.0%, SD=3.2).
Table 1.
Demographic and health characteristics by quintile (Q) of calibrated* protein intake (%kilocalories) at baseline
| Characteristic | Calibrated Values, N (%) or Mean ± Standard Deviation | ||||
|---|---|---|---|---|---|
| Q1 | Q2 | Q3 | Q4 | Q5 | |
|
%Kilocalories from
Protein |
12.4 (0.7) | 13.6 (0.2) | 14.3 (0.8) | 14.9 (0.2) | 16.0 (0.6) |
|
Age group at baseline,
years | |||||
| 65-69 | 1967 (40) | 2235 (46) | 2481 (51) | 2743 (56) | 3174 (65) |
| 70-79 | 2916 (60) | 2649 (54) | 2402 (49) | 2141 (44) | 1709 (35) |
| Education | |||||
| ≤High School | 1255 (26) | 1044 (22) | 959 (20) | 884 (18) | 807 (17) |
| Some college | 1910 (39) | 1882 (39) | 1747 (36) | 1695 (35) | 1683 (35) |
| ≥College degree | 1694 (35) | 1932 (40) | 2159 (44) | 2281 (47) | 2369 (49) |
| Ethnicity | |||||
| White | 4136 (85) | 4337 (89) | 4411 (90) | 4491 (92) | 4482 (92) |
| Black | 361 (7) | 203 (4) | 170 (4) | 109 (2) | 119 (2) |
| Hispanic | 109 (2) | 89 (2) | 74 (2) | 87 (2) | 85 (2) |
| American Indian | 11 (0.2) | 10 (0.2) | 11 (0.2) | 10 (0.2) | 7 (0.1) |
| Asian/Pacific Islander | 185 (4) | 183 (4) | 152 (3) | 133 (3) | 133 (3) |
| Unknown | 81 (2) | 62 (1) | 65 (1) | 54 (1) | 57 (1) |
| Family Income, per year | |||||
| <$20,000 | 993 (22) | 784 (18) | 686 (15) | 611 (13) | 491 (11) |
| $20,000 to $34,999 | 1411 (31) | 1341 (30) | 1312 (29) | 1250 (28) | 1154 (26) |
| $35,000 to $49,999 | 900 (20) | 975 (22) | 1015 (23) | 1042 (23) | 1061 (24) |
| $50,000 to $74,999 | 700 (16) | 785 (18) | 839 (19) | 906 (20) | 941 (21) |
| >$75,000 | 499 (11) | 591 (13) | 652 (15) | 741 (16) | 831 (19) |
|
Body Mass Index,
kilograms/meters2 | |||||
| Underweight, <18.5 | 73 (2) | 69 (1) | 59 (1) | 60 (1) | 82 (2) |
| Normal, 18.5-24.9 | 1996 (41) | 2071 (42) | 2180 (45) | 2379 (49) | 2479 (51) |
| Overweight, 25.0-29.9 | 1708 (35) | 1807 (37) | 1791 (37) | 1708 (35) | 1705 (35) |
| Obese, ≥ 30 | 1106 (23) | 937 (19) | 853 (17) | 737 (15) | 617 (13) |
|
Physical Activity, MET-
hours/week § | |||||
| ≤5.0 | 1593 (33) | 1363 (28) | 1158 (24) | 1061 (22) | 970 (20) |
| 5.1-12.4 | 1202 (25) | 1240 (26) | 1223 (25) | 1169 (24) | 1101 (23) |
| 12.5-22.4 | 1065 (22) | 1112 (23) | 1244 (26) | 1318 (27) | 1267 (26) |
| ≥22.5 | 960 (20) | 1114 (23) | 1200 (25) | 1294 (27) | 1501 (31) |
| Smoking | |||||
| Never | 2285 (48) | 2690 (56) | 2715 (56) | 2743 (57) | 2696 (56) |
| Past | 1803 (38) | 1966 (41) | 2047 (43) | 2069 (43) | 2109 (44) |
| Current | 727 (15) | 138 (3) | 48 (1) | 22 (1) | 8 (0.2) |
| Living alone at baseline | 1800 (37) | 1576 (33) | 1488 (31) | 1433 (30) | 1382 (29) |
|
Have current health care
provider |
4609 (95) | 4664 (96) | 4689 (97) | 4705 (97) | 4698 (97) |
| General health status | |||||
| Excellent | 905 (19) | 893 (18) | 926 (19) | 1007 (21) | 1074 (22) |
| Very good | 2179 (45) | 2315 (48) | 2379 (49) | 2382 (49) | 2390 (49) |
| Good | 1568 (32) | 1480 (31) | 1405 (29) | 1333 (28) | 1259 (26) |
| Fair/poor | 193 (4) | 157 (3) | 131 (3) | 133 (3) | 130 (3) |
|
Number of falls in the
last year | |||||
| 0 | 3317 (69) | 3325 (69) | 3338 (69) | 3387 (70) | 3376 (70) |
| 1 | 986 (21) | 1009 (21) | 971 (20) | 956 (20) | 1006 (21) |
| 2 | 364 (8) | 349 (7) | 360 (8) | 369 (8) | 328 (7) |
| 3 | 143 (3) | 137 (3) | 147 (3) | 124 (3) | 128 (3) |
|
Activities of Daily Living
disability, ≥1 limitation |
39 (1) | 66 (1) | 45 (1) | 52 (1) | 38 (1) |
|
Depression, CESD
score ‡ | |||||
| 0 | 1396 (29) | 1416 (29) | 1457 (30) | 1458 (30) | 1508 (31) |
| 1-2 | 1820 (38) | 1971 (41) | 1922 (40) | 1961 (41) | 1971 (41) |
| 3-4 | 956 (20) | 937 (20) | 949 (20) | 949 (20) | 889 (19) |
| 5+ | 622 (13) | 488 (10) | 482 (10) | 449 (9) | 432 (9) |
| Medical History | |||||
| Hip Fracture | 33 (1) | 48 (1) | 44 (1) | 44 (1) | 30 (1) |
| Arthritis | 2497 (52) | 2514 (52) | 2526 (52) | 2482 (51) | 2416 (50) |
| Cancer | 706 (15) | 734 (15) | 672 (14) | 660 (14) | 693 (14) |
| Chronic Obstructive | 186 (4) | 137 (3) | 129 (3) | 123 (3) | 139 (3) |
| Diabetes (treated) | 102 (2) | 95 (2) | 119 (2) | 133 (3) | 156 (3) |
| Hypertension | 2433 (51) | 2322 (48) | 2251 (47) | 2162 (45) | 2058 (43) |
| Hormone therapy use | |||||
| Never | 2488 (51) | 2334 (48) | 2214 (44) | 2127 (44) | 2087 (43) |
| Past | 877 (18) | 790 (16) | 828 (17) | 808 (17) | 776 (16) |
| Current | 1516 (31) | 1751 (36) | 1837 (38) | 1943 (40) | 2015 (41) |
| Dietary Intake † | |||||
| Total energy, kcal/d | 2029±207 | 2027 ±169 | 2028 ± 156 | 2024 ±143 | 2018 ±137 |
| Protein, g/kg/d | 1.0 ± 0.2 | 1.1 ±0.2 | 1.1±0.2 | 1.1 ±0.2 | 1.2 ±0.2 |
| Protein, g/d | 67.8 ± 10.7 | 70.8 ±9.2 | 72.8 ±8.7 | 74.4 ±8.3 | 78.5 ±8.2 |
| Essential Amino Acids, g/d |
21.5 ± 9.5 | 25.8 ±10.0 | 28.7 ±10.3 | 31.3 ±10.8 | 35.0 ±12.4 |
| Animal Protein, g/d | 30.9 ± 16.1 | 38.7 ±17.3 | 44.4 ±17.7 | 50.0 ±18.9 | 58.9 ±22.3 |
| Fat, % kcal | 32.4 ±9.0 | 30.9 ±8.1 | 29.5 ±7.7 | 28.5 ±7.5 | 26.5 ±7.5 |
| Alcohol intake | |||||
| Non/past drinker | 1339 (28) | 1308 (27) | 1216 (25) | 1204 (25) | 1292 (27) |
| < 1 drink/week | 1328 (27) | 1436 (30) | 1459 (30) | 1514 (31) | 1652 (34) |
| 1-14 drinks/week | 1681 (35) | 1821 (37) | 1997 (41) | 1977 (41) | 1834 (38) |
| >14 drinks/week | 501 (10) | 300 (6) | 192 (4) | 153 (3) | 77 (2) |
Calibrated protein represents estimates derived from linear regression equations developed on the basis of food frequency questionnaire nutrient measures and participant characteristics.
MET-hours/ week is a summary of total kilocalories expended engaging in leisure time physical activity per kilogram per week.
Depressive symptoms were assessed using the 6-item short form of the Center for Epidemiologic Studies Depression scale (CESD).
kcal/d=kilocalories per day; g/kg/d=grams per kilogram body weight per day
At the year 3 follow-up, 13.5% (N=3,298) of women were classified as frail and 29.8% (N=7,282) met the criteria for “intermediate” status, having one or two frailty components. Uncalibrated protein intake was inversely associated with incident frailty, and calibrating protein and energy intake increased the strength of the association. After adjustment for factors previously described as associated with frailty, a 20% increase in uncalibrated protein intake (%kcal) was associated with a 9% lower risk of intermediate frailty classification and a 12% lower risk of frailty classification (Table 2; Model 2). Additional models (Table 2; Model 3) adjusting for fat intake and intake from other nutrients that may have accounted for the observed association did not qualitatively change estimates. When protein intake was categorized into quintiles, similar associations were observed across the range of protein intake (Figure 1).
Table 2.
Crude and adjusted odds ratios (95% Confidence Interval)* relating calibrated** protein intake by different exposure metrics to risk of frailty
| Not Frail n=13,837 |
Intermediate Frailty n=7,282 |
Frail n=3,298 |
|
|---|---|---|---|
| Protein intake, %kcal/d, per 20% increase | |||
| Model 1 | 1.0 | 0.75 (0.64 to .0.83) | 0.62 (0.47 to .0.73) |
| Model 22 | 1.0 | 0.76 (0.63 to 0.84) | 0.68 (0.50 to 0.77) |
| Model 33 | 1.0 | 0.82 (0.70 to 0.90) | 0.77 (0.58 to 0.87) |
| Protein intake, g/kg/d, per 20% increase | |||
| Model 1 | 1.0 | 0.74 (0.71 to 0.81) | 0.55 (0.50 to 0.63) |
| Model 2 | 1.0 | 0.78 (0.73 to 0.83) | 0.65 (0.58 to 0.72) |
| Model 3 | 1.0 | 0.78 (0.73 to 0.83) | 0.65 (0.58 to 0.71) |
| Protein intake, g/d, per 20% increase | |||
| Model 1 | 1.0 | 0.88 (0.81 to 0.96) | 0.82 (0.73 to 0.94) |
| Model 2 | 1.0 | 1.18 (1.04 to 1.59) | 1.09 (0.92 to 1.49) |
| Model 3 | 1.0 | 1.16 (1.03 to 1.56) | 1.07 (0.90 to 1.45) |
| Uncalibrated Protein (%kcal) * Calibrated Energy (kcal)/d , per 20% increase | |||
| Model 1 | 1.0 | 0.71 (0.57 to 0.79) | 0.62 (0.47 to .0.73) |
| Model 2 | 1.0 | 0.76 (0.63 to 0.85) | 0.68 (0.50 to 0.78) |
| Model 3 | 1.0 | 0.82 (0.70 to 0.90) | 0.77 (0.58 to 0.87) |
Odds ratios derived from multinomial logistic regression models
Calibrated values represent estimates derived from linear regression equations developed on the basis of FFQ nutrient measures and participant characteristics.
Model 1: Adjusted for age, ethnicity, and Body Mass Index (except for g/kg model)
Model 2: Adjusted for Model 1 variables + income, education, having a current health care provider, smoking, alcohol, general health status, history of comorbid conditions (hip fracture, emphysema, treated diabetes, hypertension, arthritis, cancer ), history of hormone therapy use, number of falls, whether participant lives alone, disabled defined by at least 1 activity of daily living affected, depressive symptoms , log-transformed calibrated energy intake
Model 3: adjusted for variables in Model 2 + %kcal from dietary fat (continuous), supplement use(multi-vitamin and mineral, multi-vitamin, stress vitamins, and single supplements(iron, B1,B2, B6,B12)
Figure 1.
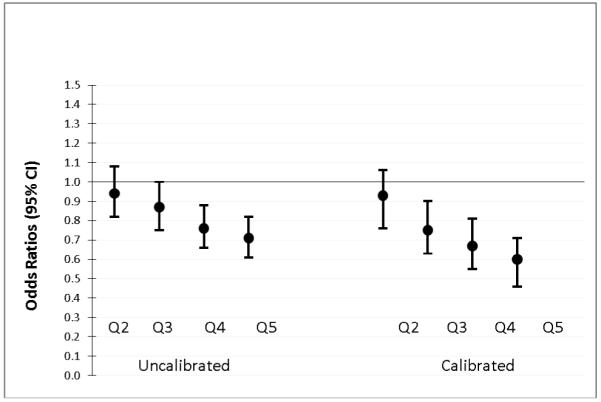
Risk* of frailty compared to lowest quintile (Q) of protein intake (%kcal): uncalibrated versus calibrated protein**.
*Adjusted for age, ethnicity, body mass index, income, education, having a current health care provider, smoking, alcohol, general health status, history of comorbid conditions (hip fracture, emphysema, treated diabetes, hypertension, arthritis, cancer), history of hormone therapy use, number of falls, whether participant lives alone, disabled defined by at least 1 activity of daily living affected, depressive symptoms, log-transformed energy intake (uncalibrated energy for uncalibrated protein models and calibrated energy for calibrated protein models)
**Uncalibrated values represent food frequency questionnaire (FFQ) estimates and calibrated values represent estimates derived from linear regression equations developed on the basis of FFQ nutrient measures and participant characteristics.
The size of the frailty log-odds ratios more than doubled following the calibration procedure, resulting in a 24% lower risk of intermediate frailty and a 32% lower risk of frailty for every 20% increase in calibrated protein intake (%kcal) (data not shown). Adjustment for energy from fat, vitamin and mineral intake resulted in an OR of 0.77 for frailty (95% CI=0.58 to 0.87) (data not shown). Associations were similar when protein was expressed in terms of grams of intake per kilogram of body weight, or when multiplying uncalibrated percentage of energy from protein by calibrated energy intake. When characterizing the exposure as absolute protein intake in grams, the association was either attenuated or in the reverse direction compared to other exposure metrics. This presumably reflects the better ability of the FFQ to assess nutrient consumption as a fraction of total energy, as compared to absolute nutrient consumption. Uncalibrated energy was not independently associated with frailty, but calibrated energy intake was inversely associated with frailty after accounting for BMI.
Spearman correlations between uncalibrated and calibrated measures of protein intake were high (r=0.77 for grams of protein, 0.74 for grams of protein/kilogram body weight and 0.92 for percentage of energy from protein), but the correlation for energy intake was only 0.38 (Table 3). As expected, essential amino acid intake was more highly correlated with grams of animal protein (r=0.97) compared with vegetable protein (r=0.64).
Table 3.
Spearman correlations between uncalibrated and calibrated* measures
| Uncalibrated Protein, %kcal |
Uncalibrated Protein, g/kg |
Uncalibrated Protein, g |
Uncalibrated Energy, kcal |
|
|---|---|---|---|---|
| Calibrated Protein, %kcal |
0.92 | 0.43 | 0.41 | −0.01 |
| Calibrated Protein, g/kg |
0.21 | 0.74 | 0.43 | 0.38 |
| Calibrated Protein, g |
0.38 | 0.52 | 0.77 | 0.65 |
| Calibrated Energy, kcal |
0.10 | 0.05 | 0.39 | 0.38 |
Uncalibrated values represent food frequency questionnaire (FFQ) estimates and calibrated values represent estimates derived from linear regression equations developed on the basis of FFQ nutrient measures and participant characteristics. All dietary intake variables were log transformed. Bold indicates P<0.0001.
After adjustment for confounders, including other dietary factors such as iron and B vitamins found in animal foods, there was no difference in the association between total protein, expressed as a percentage of total energy intake, and incident frailty, among those who consumed low versus high amounts of protein from animal sources (Table 4). The inverse association between protein intake and incident frailty was also similar in each tertile of essential amino acid intake (data not shown). Analyses were repeated excluding cysteine and tyrosine as essential amino acids and results were similar, as the correlation between the two measures of essential amino acid intake was >0.99 (data not shown). There were no significant interactions (P>0.1 for all comparisons) between protein (%kcal) and frailty by tertile of animal protein or essential amino acids (data not shown). There was also no evidence for effect modification in the relation between protein and frailty by age group, body mass index category, or number of chronic diseases (P>0.1 for all comparisons). Trends were similar for both uncalibrated and calibrated protein, but associations were weaker for uncalibrated compared to calibrated protein.
Table 4.
Odds ratios* (95% confidence interval) of association of total calibrated** protein intake (%kcal) with frailty by tertile of animal protein
| Tertile of Animal Protein Intake, (Median g/d) |
Median (IQR†), %kcal |
Not Frail n=13,837 |
Intermediate Frailty n=7,282 |
Frail n=3,298 |
|---|---|---|---|---|
| Model 1 | ||||
| Low (25.2) | 13.5 (12.8, 14.2) | 1.0 | 0.77 (0.67 to 0.86) | 0.67 (0.54 to 0.80) |
| Medium (41.5) | 14.4 (13.7, 15.1) | 1.0 | 0.69 (0.58 to 0.81) | 0.53 (0.41 to 0.70) |
| High (63.0) | 14.9 (14.2, 15.6) | 1.0 | 0.66 (0.55 to 0.77) | 0.49 (0.35 to 0.61) |
| Model 2 | ||||
| Low (25.2) | 13.5 (12.8, 14.2) | 1.0 | 0.71 (0.56 to 0.82) | 0.63 (0.47 to 0.78) |
| Medium (41.5) | 14.4 (13.7, 15.1) | 1.0 | 0.58 (0.43 to 0.72) | 0.53 (0.35 to 0.72) |
| High (63.0) | 14.9 (14.2, 15.6) | 1.0 | 0.62 (0.48 to 0.75) | 0.54 (0.36 to 0.69) |
| Model 3 | ||||
| Low (25.2) | 13.5 (12.8, 14.2) | 1.0 | 0.79 (0.63 to 0.90) | 0.73 (0.55 to 0.89) |
| Medium (41.5) | 14.4 (13.7, 15.1) | 1.0 | 0.64 (0.48 to 0.80) | 0.70 (0.46 to 0.97) |
| High (63.0) | 14.9 (14.2, 15.6) | 1.0 | 0.73 (0.57 to 0.88) | 0.72 (0.49 to 0.94) |
Odds ratios derived from multinomial logistic regression models
Calibrated protein represents estimates derived from linear regression equations developed on the basis of food frequency questionnaire nutrient measures and participant characteristics.
Model 1: Adjusted for age, ethnicity, and Body Mass Index (except for g/kg model)
Model 2: Adjusted for Model 1 variables + income, education, having a current health care provider, smoking, alcohol, general health status, history of comorbid conditions (hip fracture, emphysema, treated diabetes, hypertension, arthritis, cancer ), history of hormone therapy use, number of falls, whether participant lives alone, disabled defined by at least 1 activity of daily living affected, depression , log-transformed calibrated energy intake
Model 3: adjusted for variables in Model 2 + %kcal from dietary fat (continuous), supplement use(multi-vitamin and mineral, multi-vitamin, stress vitamins, and single supplements(iron, B1,B2, B6,B12)
IQR=inter-quartile range
DISCUSSION
In this study of 24,417 women aged 65 to 79 in the WHI-OS, higher protein intake was associated with a reduced risk of frailty. Using a calibrated measure of protein intake exposure resulted in stronger, and presumably unbiased, odds ratios compared to the uncalibrated measure. Associations were independent of the source (animal versus vegetable) and quality (as measured by essential amino acid intake) of protein intake. Frailty is a prognostically important clinical outcome that has previously been associated with future hip fracture, hospitalization, ADL disability, and mortality among women in the WHI-OS3. Data from this report suggest higher protein intake may have a role in frailty prevention. Our findings are consistent with data from the Health ABC cohort reporting positive associations between protein intake and preservation of lean body mass5. In both studies, the mean protein intake was 1.2 g/kg/day in the upper quintile of intake, representing a 50% increase over the current RDA of 0.8 g/kg/day.
Intervention studies support protein supplementation as an approach to reduce losses in muscle mass and improve health outcomes among undernourished elderly individuals. A meta-analysis of 55 trials reported a 34% reduction in mortality (95% CI=10% to 51%) with oral protein supplementation in hospitalized patients25; however, studies examining protein supplementation among healthy elderly individuals have not consistently provided evidence of benefit26. Since we expect the effects of increasing protein intake among healthy individuals to be smaller, trials with large sample sizes and long follow-up periods would be required to detect clinically important differences in health outcomes. Highly controlled clinical trials typically study increases in protein intake using supplements for short (<1 year) periods of time on surrogate endpoints such as changes in lean body mass. Prospective observational studies such as the Women’s Health Initiative can complement findings from highly controlled clinical trials by summarizing relationships between higher protein intake in a typical diet and a myriad of health outcomes. In considering optimal, rather than adequate, protein intake recommendations, it is important to consider long-term implications for morbidity and mortality in addition to short-term changes in health indicators10 . Epidemiologic studies have encountered two common barriers when studying protein intake. First, protein intake doesn’t vary as widely within the population compared to fat and carbohydrate intake and second, measurement error attenuates disease-diet associations7. We had the opportunity to study protein intake on a sample that was large enough to provide heterogeneity in protein intake and where we could correct for measurement error using a novel approach that calibrates self-reported protein and energy intake using recovery biomarkers. Accounting for measurement error in this study resulted in a two-fold increase in the strength of the association. The first application of the biomarker-calibrated energy and protein estimates to investigate associations with cancer within WHI reported weak positive associations for grams of calibrated protein and inverse associations with calibrated percentage of energy from protein with total cancer27. Though there was no association between uncalibrated energy intake and frailty, calibrated energy was positively associated with frailty in models that did not account for BMI and inversely associated with frailty in models controlling for BMI (data not shown). Calibrated energy intake and BMI are highly correlated, and there is a U-shaped curve in the association between BMI and frailty. We compared models that included or excluded BMI from our models, and the direction and magnitude of the association between calibrated protein intake and frailty was similar. These data suggest the inverse association between calibrated energy and frailty occurs at a specified BMI, whereas the inverse association between calibrated protein and frailty is independent of BMI.
Findings from these two applications of the method suggest that biomarker-calibration results in associations that are likely to be free of the distortion often observed with self-reported measures of diet. And as such, calibrated-estimates provide an effect estimate that may be closer to the true biological associations of protein with disease outcomes. Further, the nutrient density estimates of protein intake (i.e. percentage of energy from protein) are consistently more predictive of health outcomes than absolute estimates of protein intake (grams). These findings support establishing intervention targets and recommended levels of protein intake within the context of total kilocalorie intake and/or body size.
Previous studies have investigated potential mechanisms by which protein intake may preserve lean body mass and reduce morbidity and mortality. Dietary protein is comprised of amino acids, which stimulate muscle synthesis28. Data suggest that essential amino acids, which can not be synthesized by humans, are primarily responsible for stimulation of muscle synthesis29. Animal protein is typically rich in essential amino acids relative to vegetable protein, and data from a cross-sectional study suggested diets rich in protein from animal sources were associated with preservation of muscle mass30. Contrary to expectation, protein quality, as measured by essential amino acid intake or source (animal versus vegetable), did not influence the observed inverse association between protein and frailty incidence in the WHI-OS data. However, we were only able to correct for measurement error of total protein, so clinical studies, which can tightly monitor quality and type of protein intake, may be better suited to estimate the effect of protein quality on preservation of muscle mass and other health outcomes.
Strengths of this study include the large and diverse study cohort, the prospective design, and the calibrated estimate of protein intake using appropriate consumption biomarkers. Since we have insufficient data at the higher levels of protein intake recommended by some researchers of 1.5 g/kg/day, we could not estimate whether beneficial associations between protein intake and frailty continue beyond 1.2 g/kg/day. However, the consistency of the association across the continuum of protein intake currently consumed in the United States suggests the optimal level of protein intake for healthy individuals is above current recommendations.
A limitation of observational studies is that we can not be certain that the observed association is free of residual confounding. We observed that higher protein intake was positively associated with measures of socioeconomic status. While our reported associations are robust to adjustment for socioeconomic status, data from long-term intervention trials are needed to be certain that protein intake has causal effects rather than serving as a marker of better overall quality of life or diet quality.
Since individuals with kidney disease and selected diagnoses were excluded from the analysis, we cannot generalize recommendations beyond generally healthy individuals. There is active debate within the scientific community about the effects of increased protein intake on kidney function31 and bone health32which should be more rigorously evaluated in epidemiological studies.
Available data from both this large prospective study of older women as well as the Health ABC cohort5 suggest optimal protein intake may be above current recommended guidelines. Increasing protein recommendations to 1.5 g/kg/day, or about 15-20% of total calorie intake, has been recommended based on maximizing muscle protein synthesis28. Clinical trials evaluating the risks and benefits of increased protein consumption among older adults at risk for frailty with a range of kidney function is warranted. In the meantime, the emerging evidence suggests that older adults with low protein intakes could be encouraged to increase their protein intakes to recommended levels to reduce their risk of becoming frail.
ACKNOWLEDGMENTS
Program Office: (National Heart, Lung, and Blood Institute, Bethesda, Maryland) Elizabeth Nabel, Jacques Rossouw, Shari Ludlam, Joan McGowan, Leslie Ford, and Nancy Geller.
Clinical Coordinating Center: (Fred Hutchinson Cancer Research Center, Seattle, WA) Ross Prentice, Garnet Anderson, Andrea LaCroix, Charles L. Kooperberg, Ruth E. Patterson, Anne McTiernan; (Medical Research Labs, Highland Heights, KY) Evan Stein; (University of California at San Francisco, San Francisco, CA) Steven Cummings.
Clinical Centers: (Albert Einstein College of Medicine, Bronx, NY) Sylvia Wassertheil-Smoller; (Baylor College of Medicine, Houston, TX) Aleksandar Rajkovic; (Brigham and Women’s Hospital, Harvard Medical School, Boston, MA) JoAnn E. Manson; (Brown University, Providence, RI) Charles B. Eaton; (Emory University, Atlanta, GA) Lawrence Phillips; (Fred Hutchinson Cancer Research Center, Seattle, WA) Shirley Beresford; (George Washington University Medical Center, Washington, DC) Lisa Martin; (Los Angeles Biomedical Research Institute at Harbor- UCLA Medical Center, Torrance, CA) Rowan Chlebowski; (Kaiser Permanente Center for Health Research, Portland, OR) Yvonne Michael; (Kaiser Permanente Division of Research, Oakland, CA) Bette Caan; (Medical College of Wisconsin, Milwaukee, WI) Jane Morley Kotchen; (MedStar Research Institute/Howard University, Washington, DC) Barbara V. Howard; (Northwestern University, Chicago/Evanston, IL) Linda Van Horn; (Rush Medical Center, Chicago, IL) Henry Black; (Stanford Prevention Research Center, Stanford, CA) Marcia L. Stefanick; (State University of New York at Stony Brook, Stony Brook, NY) Dorothy Lane; (The Ohio State University, Columbus, OH) Rebecca Jackson; (University of Alabama at Birmingham, Birmingham, AL) Cora E. Lewis; (University of Arizona, Tucson/Phoenix, AZ) Cynthia A Thomson; (University at Buffalo, Buffalo, NY) Jean Wactawski-Wende; (University of California at Davis, Sacramento, CA) John Robbins; (University of California at Irvine, CA) F. Allan Hubbell; (University of California at Los Angeles, Los Angeles, CA) Lauren Nathan; (University of California at San Diego, LaJolla/Chula Vista, CA) Robert D. Langer; (University of Cincinnati, Cincinnati, OH) Margery Gass; (University of Florida, Gainesville/Jacksonville, FL) Marian Limacher; (University of Hawaii, Honolulu, HI) J. David Curb; (University of Iowa, Iowa City/Davenport, IA) Robert Wallace; (University of Massachusetts/Fallon Clinic, Worcester, MA) Judith Ockene; (University of Medicine and Dentistry of New Jersey, Newark, NJ) Norman Lasser; (University of Miami, Miami, FL) Mary Jo O’Sullivan; (University of Minnesota, Minneapolis, MN) Karen Margolis; (University of Nevada, Reno, NV) Robert Brunner; (University of North Carolina, Chapel Hill, NC) Gerardo Heiss; (University of Pittsburgh, Pittsburgh, PA) Lewis Kuller; (University of Tennessee Health Science Center, Memphis, TN) Karen C. Johnson; (University of Texas Health Science Center, San Antonio, TX) Robert Brzyski; (University of Wisconsin, Madison, WI) Gloria E. Sarto; (Wake Forest University School of Medicine, Winston-Salem, NC) Mara Vitolins; (Wayne State University School of Medicine/Hutzel Hospital, Detroit, MI) Michael Simon.
Women’s Health Initiative Memory Study: (Wake Forest University School of Medicine, Winston-Salem, NC) Sally Shumaker.
Footnotes
This work was presented in April 2009 at the Experimental Biology Meeting in New Orleans, LA.
Conflict of Interest
The authors have no conflicts of interest to declare. All authors contributed significantly to the manuscript. The WHI program is funded by the National Heart, Lung, and Blood Institute, National Institutes of Health, U.S. Department of Health and Human Services through contracts N01WH22110, 24152, 32100-2, 32105-6, 32108-9, 32111-13, 32115, 32118-32119, 32122, 42107-26, 42129-32, and 44221 This work was also supported by PO1 CA53996, 5R01AG025441-03 and T32 AG027677.
JMB: Dr. Beasley worked on this manuscript while employed at the Group Health Research Institute and Fred Hutchinson Cancer Research Center and is supported by the T32 AG027677 fellowship sponsored by the National Institute of Aging.
AZL: Dr. LaCroix worked on this manuscript while employed at the Fred Hutchinson Cancer Research Center and this work was supported by 5R01AG025441-03 sponsored by the National Institute of Aging.
RP: Dr. Prentice worked on this manuscript while employed at the Fred Hutchinson Cancer Research Center and this work was supported by a NHLBI contract(NO1WH22110) and a NCI program grant (CA53996),for which he serves as PI.
JDC: Dr. Curb was employed by the University of Hawaii and was partially supported by funds from the Women’s Health Initiative contract N01-WH-4-2130
Sponsor’s Role: None
REFERENCES
- 1.Fried LP, Tangen CM, Walston J, et al. Frailty in older adults: Evidence for a phenotype. J Gerontol A Biol Sci Med Sci. 2001;56:M146–156. doi: 10.1093/gerona/56.3.m146. [DOI] [PubMed] [Google Scholar]
- 2.Ensrud KE, Ewing SK, Taylor BC, et al. Frailty and risk of falls, fracture, and mortality in older women: The study of osteoporotic fractures. J Gerontol A Biol Sci Med Sci. 2007;62:744–751. doi: 10.1093/gerona/62.7.744. [DOI] [PubMed] [Google Scholar]
- 3.Woods NF, LaCroix AZ, Gray SL, et al. Frailty: emergence and consequences in women aged 65 and older in the Women’s Health Initiative Observational Study. J Am Geriatr Soc. 2005;53:1321–1330. doi: 10.1111/j.1532-5415.2005.53405.x. [DOI] [PubMed] [Google Scholar]
- 4.Ensrud KE, Ewing SK, Taylor BC, et al. Comparison of 2 frailty indexes for prediction of falls, disability, fractures, and death in older women. Arch Intern Med. 2008;168:382–389. doi: 10.1001/archinternmed.2007.113. [DOI] [PubMed] [Google Scholar]
- 5.Houston DK, Nicklas BJ, Ding J, et al. Dietary protein intake is associated with lean mass change in older, community-dwelling adults: The Health, Aging, and Body Composition (Health ABC) Study. Am J Clin Nutr. 2008;87:150–155. doi: 10.1093/ajcn/87.1.150. [DOI] [PubMed] [Google Scholar]
- 6.Kipnis V, Subar AF, Midthune D, et al. Structure of dietary measurement error: results of the OPEN biomarker study. Am J Epidemiol. 2003;158:14–21. doi: 10.1093/aje/kwg091. discussion 22-16. [DOI] [PubMed] [Google Scholar]
- 7.Subar AF, Kipnis V, Troiano RP, et al. Using intake biomarkers to evaluate the extent of dietary misreporting in a large sample of adults: the OPEN study. Am J Epidemiol. 2003;158:1–13. doi: 10.1093/aje/kwg092. [DOI] [PubMed] [Google Scholar]
- 8.Dietary Reference Intakes for Energy, Carbohydrate, Fiber, Fat, Fatty Acids, Cholesterol, Protein, and Amino Acids (Macronutrients) National Academies Press; Washington, D.C.: 2005. A Report of the Panel on Macronutrients SoURLoN, Interpretation, Uses of Dietary Reference I, et al; p. 589. [Google Scholar]
- 9.Paddon-Jones D, Short KR, Campbell WW, et al. Role of dietary protein in the sarcopenia of aging. Am J Clin Nutr. 2008;87:1562S–1566S. doi: 10.1093/ajcn/87.5.1562S. [DOI] [PubMed] [Google Scholar]
- 10.Walrand S, Boirie Y. Optimizing protein intake in aging. Curr Opin Clin Nutr Metab Care. 2005;8:89–94. doi: 10.1097/00075197-200501000-00014. [DOI] [PubMed] [Google Scholar]
- 11.Campbell WW, Trappe TA, Wolfe RR, et al. The recommended dietary allowance for protein may not be adequate for older people to maintain skeletal muscle. J Gerontol A Biol Sci Med Sci. 2001;56:M373–380. doi: 10.1093/gerona/56.6.m373. [DOI] [PubMed] [Google Scholar]
- 12.Neuhouser ML, Tinker L, Shaw PA, et al. Use of recovery biomarkers to calibrate nutrient consumption self-reports in the Women’s Health Initiative. Am J Epidemiol. 2008;167:1247–1259. doi: 10.1093/aje/kwn026. [DOI] [PubMed] [Google Scholar]
- 13.Paddon-Jones D, Sheffield-Moore M, Cree MG, et al. Atrophy and impaired muscle protein synthesis during prolonged inactivity and stress. J Clin Endocrinol Metab. 2006;91:4836–4841. doi: 10.1210/jc.2006-0651. [DOI] [PubMed] [Google Scholar]
- 14.The Women’s Health Initiative Study Group Design of the Women’s Health Initiative clinical trial and observational study. Control Clin Trials. 1998;19:61–109. doi: 10.1016/s0197-2456(97)00078-0. [DOI] [PubMed] [Google Scholar]
- 15.Patterson RE, Kristal AR, Tinker LF, et al. Measurement characteristics of the Women’s Health Initiative food frequency questionnaire. Ann Epidemiol. 1999;9:178–187. doi: 10.1016/s1047-2797(98)00055-6. [DOI] [PubMed] [Google Scholar]
- 16.McHorney CA, Ware JE, Jr., Lu JF, et al. The MOS 36-item Short-Form Health Survey (SF-36): III. Tests of data quality, scaling assumptions, and reliability across diverse patient groups. Med Care. 1994;32:40–66. doi: 10.1097/00005650-199401000-00004. [DOI] [PubMed] [Google Scholar]
- 17.Ware JE, Jr., Sherbourne CD. The MOS 36-item short-form health survey (SF-36). I. Conceptual framework and item selection. Med Care. 1992;30:473–483. [PubMed] [Google Scholar]
- 18.Anderson GL, Manson J, Wallace R, et al. Implementation of the Women’s Health Initiative study design. Ann Epidemiol. 2003;13:S5–17. doi: 10.1016/s1047-2797(03)00043-7. [DOI] [PubMed] [Google Scholar]
- 19.Ainsworth BE, Haskell WL, Leon AS, et al. Compendium of physical activities: classification of energy costs of human physical activities. Med Sci Sports Exerc. 1993;25:71–80. doi: 10.1249/00005768-199301000-00011. [DOI] [PubMed] [Google Scholar]
- 20.Lacroix AZ, Gray SL, Aragaki A, et al. Statin Use and Incident Frailty in Women Aged 65 Years or Older: Prospective Findings From the Women’s Health Initiative Observational Study. J Am Geriatr Soc. 2008;63:369–375. doi: 10.1093/gerona/63.4.369. [DOI] [PubMed] [Google Scholar]
- 21.Joint FAO/WHO/UNU/EC . Energy and protein requirements. Vol. 2008 1985. [Google Scholar]
- 22.World Health Organization . Protein and amino acid requirements in human nutrition: Report of a FAO/WHO/UNU consultation. WHO Press; 2007. p. 150. WHO Technical Report Series. [PubMed] [Google Scholar]
- 23.Patterson RE, Levy L, Tinker LF, et al. Evaluation of a simplified vitamin supplement inventory developed for the Women’s Health Initiative. Public Health Nutr. 1999;2:273–276. doi: 10.1017/s1368980099000361. [DOI] [PubMed] [Google Scholar]
- 24.Tuunainen A, Langer RD, Klauber MR, et al. Short version of the CES-D (Burnam screen) for depression in reference to the structured psychiatric interview. Psychiatry Res. 2001;103:261–270. doi: 10.1016/s0165-1781(01)00278-5. [DOI] [PubMed] [Google Scholar]
- 25.Milne AC, Avenell A, Potter J. Meta-analysis: Protein and energy supplementation in older people. Ann Intern Med. 2006;144:37–48. doi: 10.7326/0003-4819-144-1-200601030-00008. [DOI] [PubMed] [Google Scholar]
- 26.Smoliner C, Norman K, Scheufele R, et al. Effects of food fortification on nutritional and functional status in frail elderly nursing home residents at risk of malnutrition. Nutrition. 2008;24:1139–1144. doi: 10.1016/j.nut.2008.06.024. [DOI] [PubMed] [Google Scholar]
- 27.Prentice RL, Shaw PA, Bingham SA, et al. Biomarker-calibrated energy and protein consumption and increased cancer risk among postmenopausal women. Am J Epidemiol. 2009;169:977–989. doi: 10.1093/aje/kwp008. [DOI] [PMC free article] [PubMed] [Google Scholar]
- 28.Wolfe RR, Miller SL, Miller KB. Optimal protein intake in the elderly. Clin Nutr. 2008;27:675–684. doi: 10.1016/j.clnu.2008.06.008. [DOI] [PubMed] [Google Scholar]
- 29.Volpi E, Kobayashi H, Sheffield-Moore M, et al. Essential amino acids are primarily responsible for the amino acid stimulation of muscle protein anabolism in healthy elderly adults. Am J Clin Nutr. 2003;78:250–258. doi: 10.1093/ajcn/78.2.250. [DOI] [PMC free article] [PubMed] [Google Scholar]
- 30.Lord C, Chaput JP, Aubertin-Leheudre M, et al. Dietary animal protein intake: association with muscle mass index in older women. J Nutr Health Aging. 2007;11:383–387. [PubMed] [Google Scholar]
- 31.Menon V, Kopple JD, Wang X, et al. Effect of a very low-protein diet on outcomes: long-term follow-up of the Modification of Diet in Renal Disease (MDRD) Study. Am J Kidney Dis. 2009;53:208–217. doi: 10.1053/j.ajkd.2008.08.009. [DOI] [PubMed] [Google Scholar]
- 32.Heaney RP, Layman DK. Amount and type of protein influences bone health. Am J Clin Nutr. 2008;87:1567S–1570S. doi: 10.1093/ajcn/87.5.1567S. [DOI] [PubMed] [Google Scholar]