Abstract
A key feature in the molecular pathogenesis of liver fibrosis requires maintenance of the activated hepatic stellate cell (HSC) phenotype by both proliferation and inhibition of apoptosis. We provide evidence that leptin is a potent HSC mitogen and dramatically inhibits stellate cell apoptosis. Leptin proved to be as potent an HSC mitogen as platelet-derived growth factor (PDGF) as assessed by bromodeoxyuridine (BrdU) incorporation in isolated primary HSCs; data using fluorescent propidium iodide (PI) uptake revealed that leptin, like PDGF, increased HSC populations in the S- and G2/M-phases of the cell cycle. Leptin resulted in a robust increase in cyclin D1 expression. Using the chemical inhibitor of Janus kinase 2 (Jak2) activity, AG 490, and overexpression of the suppressor of cytokine signaling 3 (SOCS-3), we show that blockade of leptin receptor (Ob-Rb) phosphorylation blocks leptin-induced HSC proliferation. Leptin-associated phosphorylation of both extracellular regulated kinase (p44/p42, Erk) and Akt is also prohibited. Further, the PI-3 kinase inhibitor LY294002 and MAPK inhibitor PD98059 were found to significantly reduce leptin-induced HSC proliferation, thereby indicating that leptin induced HSC proliferation is Akt- and Erk-dependent. Akt was also protective against HSC apoptosis. Leptin abolished both cycloheximide-induced and tumor necrosis factor-related apoptosis-inducing ligand (TRAIL)-induced apoptosis, demonstrated by reduced caspase-3 activity, HSC-TUNEL staining, and DNA fragmentation. We conclude that leptin acts as a direct hepatic stellate cell survival agonist. Importantly, we have demonstrated that leptin-induced HSC proliferation and survival by Ob-Rb phosphorylation are both Erk- and Akt-dependent.
Keywords: nonalcoholic steohepatitis (NASH), liver fibrosis, proliferation, MAP kinase, PI-3 kinase
The role of leptin, a 16 kDa protein hormone, in liver disease may be distinctly important as human obesity and diabetes mellitus type II become more prevalent (1). Nonalcoholic steatohepatitis (NASH) is characterized by fatty change of the liver with various degrees of inflammation and fibrosis (2, 3). The exact mechanism by which leptin promotes liver fibrosis is unknown. Recently, a role for leptin in the molecular pathogenesis of mammalian fibrosis has been substantiated in glomerulosclerosis (4) as well as in liver fibrosis (5-8). In peripheral tissues, leptin exerts control on body weight homeostasis via inhibitory actions on glucose metabolism and insulin secretion (9). Ob-Rb is the functional form of the membrane-associated leptin receptor. It is related to the class II cytokine group receptors binding interleukin-2, interferon, and growth hormone and is closely related to the gp130 signal-transducing component of the interleukin-6 and the G-CSF receptor (10, 11). The long form of the leptin receptor, Ob-Rb, is present in various peripheral organs, including inflammatory blood cells, lung, kidney, liver, and intestine (10-13). Upon leptin interaction with Ob-Rb, activation of the Janus kinase 2 (Jak-2) occurs via trans-phosphorylation of the receptor as well as subsequent phosphorylation of the signal transducers and activators of transcription (Stat) proteins. A short, but crucial, amino acid motif is required for Jak-2 activation, which is absent, in short form sequences of Ob-R (14). Two Ob-Rb tyrosine residues have been shown to undergo phosphorylation during receptor activation mediating distinct signal transduction pathways, including the mitogen-activated protein kinase (MAPK) pathways (15). Leptin has been shown to increase cell proliferation in hematopoietic and embryonic stem cells and CD4+ human T lymphocytes (12, 16-18). The serine/threonine kinase Akt (protein kinase B or Rac kinase) is known to influence various cellular processes and cell survival (19, 20). Leptin is able to enhance Akt phosphorylation in endothelial cells, isolated vessels, and several other tissues (21-24).
Activation of HSCs into a highly proliferative and profibrogenic cell is a seminal event in hepatic fibrogenesis (25, 26). We have recently demonstrated that leptin can bind to cultured rat HSC in vitro, activate Stat3 phosphorylation through Ob-Rb, and increase total mRNA for the α2(I) collagen gene (8). We also have shown that leptin is produced by activated, but not quiescent, HSCs (27). In addition, we have demonstrated that in carbon tetrachloride-induced liver injury, leptin is required for liver fibrosis in the lean littermates of ob/ob mice, which do not produce leptin (8). The organization of stellate cell activation, now defined into a temporal sequence, provides a framework to study molecular mechanisms by which leptin promotes liver fibrosis. (25). Well-characterized growth factors, or cytokines, such as platelet-derived growth factor (PDGF) are known to play key roles in HSC proliferation and resolution of the fibrogenic response via apoptosis (25). Few recent studies have shown that the elimination of activated HSCs by apoptosis might be an important mechanism of terminating and potentially reversing liver fibrosis (28, 29). Taken together, stellate cell survival via mitogenesis and failure to undergo apoptosis are central events leading to liver fibrosis (30-33). In this study, we tested the hypothesis that leptin plays a novel role in hepatic fibrogenesis by inducing HSC proliferation and cell survival via Ob-Rb-induced Erk and Akt signaling.
MATERIALS AND METHODS
Isolation and culture of HSCs and culture conditions
HSCs were extracted from normal rat by sequential in situ perfusion with collagenase (80 mg/dl) and Pronase E (200 mg/dl) followed by density gradient centrifugation with Nycodenz (Sigma, St. Louis, MO) as described elsewhere (34, 35). The Institutional Animal Care and Use Committees of the University of Maryland and Emory University School of Medicine approved the performed protocols. Sprague-Dawley rats were purchased from Charles River Laboratories (Wilmington, MA). Cells were seeded at 1.3 × 10⁶/ml on uncoated tissue culture plates for 7–10 days until a confluent monolayer of activated HSCs was formed. Highly activated cells were obtained by serial passage (second to fourth passage). HSCs were cultured in Dulbecco’s modified Eagle’s medium (DMEM)(Gibco-BRL, Rockville, MD) supplemented with 4 mM l-glutamine, 20% fetal bovine serum (FBS) (HyClone, Logan, UT), and 1% penicillin-streptomycin (Gibco-BRL). Culture medium was changed every 24 h, and confirmation of viability was assessed by propidium iodide (PI) staining and auto-fluorescence at the time of isolation. Assessment of activation was performed by α-smooth muscle actin staining (α-SMA) of cells. Rat HSCs were used for experiments after activation in primary culture or less than four passages. Cultures were initiated at a cell density of 1 × 10⁵ cells/ml, and all the treatments were given after cells were synchronized by serum starvation for 24 h, unless otherwise mentioned.
Culture treatment conditions and concentrations of culture additives
The following treatments were administered for different sets of experiments presented. Except where noted, treatments were given for 24 h. All the treatments were administered with serum-free media (designated as “U”) in which cells were kept in DMEM with 0.1% FBS except where noted. After serum starvation, HSC cultures were treated with rat recombinant leptin (L) (Sigma) at 100 ng/ml or human platelet-derived growth factor (P) (Sigma) at 30 ng/ml, which served as a positive control for proliferation, or cycloheximide (C) (Sigma) at 50 μM, which acted as a positive control for apoptosis. Tumor necrosis factor-related apoptosis-inducing ligand (TRAIL) (T) (Calbiochem, San Diego, CA) at 25 ng/ml was also used as another apoptotic agent. Cycloheximide, or TRAIL, was used in conjunction with leptin to determine the potential for leptin to rescue HSCs from apoptosis. Z-VAD-fmk (Enzyme Systems Products, Livermore, CA) was used (100 nM) as a pan-caspase inhibitor to serve as a negative control for apoptosis. AG490 (Calbiochem) was used as a chemical inhibitor for Jak kinase activity (36).
Quantification of DNA/cell proliferation assay by bromodeoxyuridine (BrdU) incorporation
BrdU incorporation analysis was performed using an enzyme-linked immunosorbent assay (ELISA) (Roche Diagnostics, Indianapolis, IN). Approximately 5 × 10² HSCs were cultured in the presence of PDGF or leptin in 96-well tissue culture plates; culture conditions were as described previously for 24 h. Cells, grown in serum-free media, served as a negative control for proliferation. In another set of experiments, to determine a direct role of Akt or Erk in HSC proliferation, we cultured ~5 × 10² HSCs in serum-free media (U) (0.1% FBS) or PDGF (P) (30 ng/ml), which served as positive control for proliferation. The PI-3 kinase inhibitor LY294002 (LY) (600 nM) and the MAPK inhibitor PD98059 (PD) (6 μM) were in the presence or absence of recombinant leptin (L) (100 ng/ml) for 40 h. Cells, grown in serum-free media, served as a negative control for proliferation, and BrdU incorporation assays were performed as described previously. Subsequently, BrdU was added to the HSC cultures for 4 h. HSCs were fixed and DNA denatured. The anti-BrdU-POD monoclonal antibody from mouse-mouse hybrid cells conjugated with peroxidase was used at 1:100 and binds to the BrdU incorporated in newly synthesized cellular DNA. Resultant immune complexes were quantified by emitted light measurements using a microplate luminometer (Becton-Dickinson, Franklin Lakes, NJ) with photomultiplier technology. Relative light units/seconds (RLU/s) directly correlate to the amount of DNA synthesis and the number of proliferating HSCs.
Fluorescence-activated cell sorting (FACS) analysis/cellular DNA flow cytometry using PI S-phase analysis
Flow cytometry analysis of HSC cell cycle was carried out using cellular DNA flow cytometry analysis (Roche, Indianapolis, IN), as per the manufacturer’s instructions. Cells were grown as described previously and subsequently treated for 15 h as outlined in Figure 1B. After 15 h of treatment, cells were harvested, adjusted to equal cell numbers, fixed in 70% ethanol for 30 min at -20°C, and suspended in 500 μl PBS containing RNase A (5 prime→ 3 Prime, Inc., Boulder, CO) (250 mg/l) for 30 min at 4°C. Fixed cells were stained with PI (100 mg/l) before FACS analysis as described elsewhere (37). Briefly, after excitation of PI at 485 nm, red fluorescence from PI was collected through a 580 nm long pass filter and recorded to measure HSC DNA content. After counting 3.5 × 10⁴ cells, the number of cells in each phase of cell cycles (G0/G1, S, and G2/M) was analyzed to assess the respective DNA content. The HSC cycle profile was determined using a Becton Dickinson FACScan, and data were analyzed using ModFit LT 3.1 (Verity Software House, Topsham, ME).
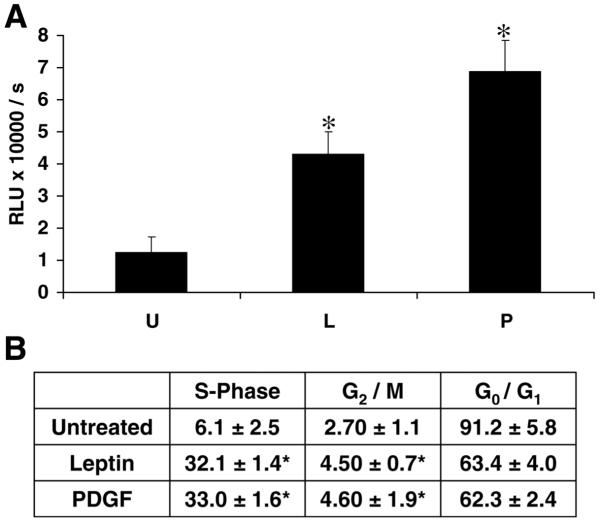
Figure 1. Leptin is mitogenic for hepatic stellate cells.
A) Leptin treatment increased BrdU incorporation in HSCs. HSCs were incubated for 48 h in 10% FBS/DMEM and successively maintained for 24 h in SF-DMEM. In the study, PDGF (30 ng/ml) served as a positive control for HSC mitogenesis. Treatments were introduced for 24 h. BrdU was added (10 μM), and HSCs were allowed to grow for an additional 24 h. Incorporation of BrdU into newly synthesized DNA was assessed as relative light units, and is shown as the mean ± se of three independent experiments performed in triplicate. *P<0.01, compared with untreated control cells grown in SF media. U, untreated (0.01% FBS); L, rat recombinant leptin (100 ng/ml); P, PDGF-bb (30 ng/ml). B) Leptin increased the fraction of HSCs in S-phase of the cell cycle. HSCs were synchronized by serum starvation in a medium containing 0.1% serum for 24 h. Serum-starved cells were exposed to PDGF-bb (30 ng/ml) or leptin (100 ng/ml) or SF media (0.1% FBS). After 24 h, the distribution of HSCs in the cell cycle was determined by flow cytometry using PI-stained nuclei. The results indicate the distribution of HSCs in various phases after serum starvation, leptin, or PDGF treatment. Mean values ± se are the results of three independent experiments performed in triplicate. *P<0.01, compared with serum-starved conditions.
Overexpression of suppressor of cytokine signaling 3 (SOCS-3) and AG490 in leptin-mediated HSC proliferation via Erk and Akt phosphorylation
To determine whether Ob-Rb phosphorylation was central to leptin-induced HSC proliferation and whether Ob-Rb phosphorylation induced Erk and Akt phosphorylation to promote mitogenesis, we overexpressed SOCS-3 and used the pharmacologic inhibitor of Jak2 kinase activity, AG490. As described previously, we performed BrdU incorporation as well as immunoblot analysis to probe for p-Erk and p-Akt. BrdU and immunoblot methods were described previously. HSC-SOCS 3 transfection of pEF-FLAG-1/mSOCS-3 (a kind gift of Dr. D. Hilton, Victoria, Australia [41]) was performed as follows. Approximately 5 × 10² HSCs were cultured, and 1.0 μg of DNA plasmid of pEF-FLAG-1/mSOCS-3 or empty vector (control) was transfected with LipofectAMINE PLUS (Invitrogen, Carlsbad, CA). Co-transfection with the mammalian vector pEGFP-N1 was also used to determine transfection efficiency. The period of transfection was 48 h. Cell viability was scored for all transfection studies, and the number of green fluorescent protein (GFP)-positive cells was counted and transfection efficiency calculated based on the total number of cells per microfield. The transfection efficiency was calculated using data from 10 microfields per transfection sample and was found to be 38.2 ± 1.7%. The transfected cells were serum starved for 15 h in DMEM with 0.1% FBS. Synchronized HSCs were subjected to leptin treatment for 4 h. In another set of experiments, HSCs were grown to 80% confluence, serum starved for 15 h, and treated with AG490 (50 μM) with and without leptin (100 ng/ml). For both experiments, untreated HSCs in 0.1% FBS served as a negative control or time 0. BrdU was added at a final concentration of 10 μM for 24 h.
To assay for p-Erk or p-Akt, we cultured ~5 × 10⁵ HSCs in 100 mm plates, and 4 μg of pEF-FLAG-1/mSOCS-3, or empty vector, was used for transfection by LipofectAMINE PLUS (Invitrogen) as described previously. After 3 h transfection, cells were supplemented with complete medium for 24 h. The transfection efficiency was calculated as described above and was found to be 35 ± 2.7%. Transfected cells were subsequently placed in serum-free media as described previously. Synchronized HSCs following transfection were subjected to leptin treatment for 24 h. Whole cell lysates were extracted using RIPA lysis buffer and were subjected to immunoprecipitation with p-Erk or p-Akt, as described above. Equal protein loading was controlled by immunoblot of the corresponding nonphosphorylated species, using rabbit polyclonal antibodies against the respective proteins. Analysis of resolved proteins was performed as described below.
Apoptosis analysis
Determination of primary HSC apoptosis through the PI-3 kinase-dependent pathway by internucleosomal DNA cleavage and Hoechst staining method
For DNA fragmentation and Hoechst staining, activated primary HSCs were cultured as described previously. Cells were serum starved for 16 h and subsequently exposed to serum-free medium (U) (0.1% FBS), leptin (L) (100 ng/ml), LY294002 (LY) (600 nM), or leptin plus LY294002 (L+LY) for 40 h. Subsequently, HSCs were processed for DNA fragmentation analysis as described below. Cells were also evaluated for apoptosis using the Hoechst method (38). Briefly, cells were stained with Hoechst 33258 (2.5 mg/ml) for 3 min at 25°C, and percent apoptosis was assessed using fluorescence microscopy. Each experiment was performed in triplicate, and for each treatment condition, 200 cells were counted and the percentage of apoptotic cells was assessed based on evidence of nuclear fragmentation and condensation.
Terminal deoxynucleotide transferase (TdT)-mediated dUTP-fluorescein nick end labeling (TUNEL) assay
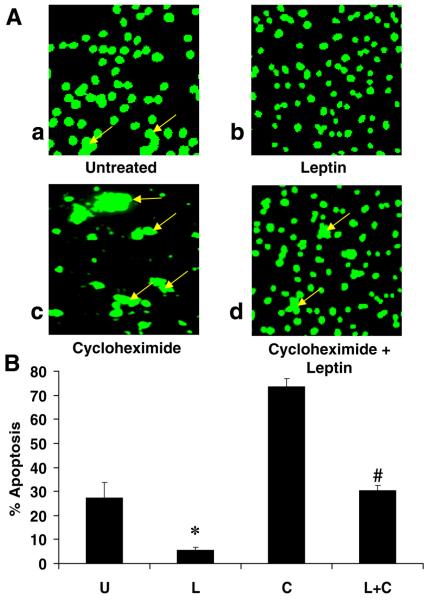
TUNEL staining was performed using an in situ cell death detection system (Roche) as per the manufacturer’s instructions. Primary HSCs were grown to 50% confluence and were treated with serum-free media containing cycloheximide or cycloheximide and leptin as described previously. After 4 h treatment, cells were harvested and fixed in 2% paraformaldehyde and subjected to permeabilization. Cells were suspended in TUNEL reaction mixture containing TdT and fluorescein-labeled dUTP. Resultant HSC samples were analyzed by flow cytometry for fluorescence intensity using Becton-Dickinson FACScan. HSC apoptosis was quantified using Cell Quest software (Becton-Dickinson) in which fluorescence intensity is directly proportional to the number of apoptotic cells.
Fluorescent microscopy was also performed to visualize TUNEL staining. HSCs were cultured in plastic chamber slides (Nunc International, Rochester, NY) and exposed to cycloheximide in the presence and absence of leptin for 24 h. At the conclusion of the experiment, cells were fixed in 2% paraformaldehyde. The percentage of apoptotic HSCs was determined by counting 10 microfields at a magnification of 40× and photomicrographs recorded.
Caspase-3 activity assay
To complement data obtained with cycloheximide from TUNEL and PI staining experiments, we assayed caspase-3 activity in HSCs in the presence of leptin and cycloheximide. Caspase-3 activity assay (Roche) was used following the manufacturer’s instructions. HSCs were cultured in the presence of the various test substances for 24 h. HSC lysate caspase-3 activity was captured with a monoclonal antibody to caspase-3. The substrate (Ac-DEVD-AFC, a sequence of amino acids Ac-DEVD attached to AFC, is cleaved by caspase-3, releasing fluorescent AFC) was added to the HSC lysate. Caspase-3 activity was measured by monitoring change in fluorescence (excitation at 360 nm and emission at 460 nm) at hourly intervals, converted to pmol of AFC released using a standard curve, and normalized for protein concentration.
Cell viability assay in the presence of TRAIL
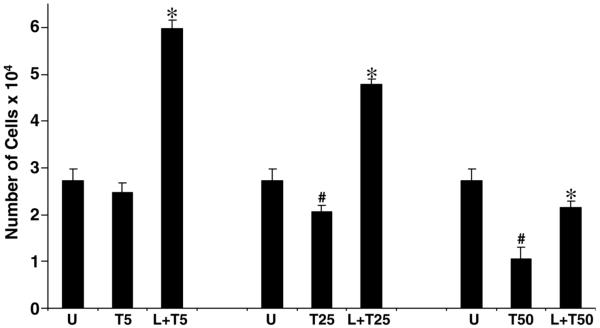
Cell viability analysis was also performed by estimating reduction of XTT (2, 3-bis(2-methoxy-4-nitro-5-sulfophenyl)-2H-tetrazolium-5-carboxyanilide), using a commercially available kit (Roche) and executed according to the manufacturer’s instructions. Primary HSCs were plated at into 96-well plates at an initial density of 5 × 10³ for 16 h, serum starved in 0.1% FBS-DMEM for 15 h followed by treatment under serum-free conditions, TRAIL (5–50 ng/ml), or TRAIL (5–50 ng/ml) plus leptin for 24 h. XTT labeling reagent was added to each culture well to attain a final concentration of 0.3 mg/ml. After 4 h exposure at 37°C, absorbance was measured at 450 and 690 nm using a 96-well plate reader (PowerwaveX 340; Bio-Tek Instruments, Inc., Summit, NJ). Pilot experiments verified that the cell densities used in experiments performed were within the linear range of the XTT assay. A standard curve was prepared using cell densities from 1 × 10³ to 1 × 10⁶, and the results were calculated with respect to the number of cells.
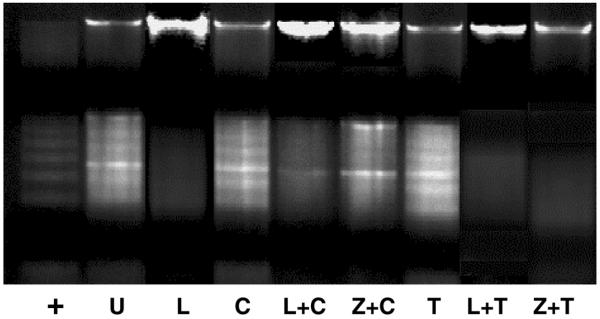
Determination of internucleosomal DNA cleavage or DNA fragmentation as induced by TRAIL or cycloheximide
HSCs, as previously treated, were harvested and lysed in 7 M guanidine hydrochloride. The lysate was mixed with 1 ml of Wizard Miniprep resin (Promega, Madison, WI), incubated at room temperature for 15 min, and centrifuged at 10,000g for 5 min. The resulting pellet was resuspended in 2 ml of wash buffer (90 mM NaCl, 9 mM Tris-HCl [pH 7.4], 2.25 mM EDTA, 55% [v/v] ethanol) and drawn by vacuum through a Wizard Minicolumn (Promega). The column was washed twice with 4 ml of washing solution and dried by centrifugation at 10,000g. DNA was eluted from the column by the addition of 50 μl of deionized H2O, incubation at room temperature for 15 min, and then centrifugation at 10,000g for 5 min. Residual RNA in the eluate was removed by incubation with 10 μg of RNase A (5 Prime→ 3 Prime) at 37°C for 30 min. DNA samples were loaded onto a 1.5% agarose gel in Tris borate-EDTA buffer and subjected to electrophoresis. DNA ladders were visualized by staining with ethidium bromide (0.5 μg/ml), and images were captured with the Bio-Rad (Hercules, CA) Gel Documentation System.
Preparation of cell extracts, immunoprecipitation, and immunoblot analysis
HSCs were harvested following leptin exposure for the time intervals indicated in Figure 4. Cells were collected by rubber policeman, washed in PBS, and resuspended in ice-cold RIPA buffer (10 μM Tris-HCl, pH 8.0, 100 mM NaCl, 1 mM EDTA, 1% Nonidet P-40, 0.5% sodium deoxycholate, 0.1% SDS, and 10 μl/ml protease inhibitor cocktail [Sigma]) for 30 min on ice. HSC lysates were centrifuged at 14,000 rpm for 30 min at 4°C. The supernatant was harvested, and protein concentrations were determined using Bradford reagent (Sigma) (39). For immunoprecipitation, cell lysates were pre-cleared with protein A/G-agarose beads (Santa Cruz Biotecnology, Santa Cruz, CA). Precleared HSC lysates were incubated with anti-phosphoserine antibody for pAkt (Phospho-Akt-Ser473) (anti-pAkt) or anti-Akt antibodies as well as anti-phosphotyrosine-antibody for pErk (Phospho-p44/42 MAPK-Thr202/Tyr204) (anti p-p44/p42) (overnight at 4°C). HSC immune complexes, or proteins, were resolved on 10% SDS-PAGE and transferred to nitrocellulose membranes (40). Membranes were stained with Ponceau S (0.1%) to verify equal loading and transfer of proteins. After blocking with 1% BSA in TBS-Tween 20, membranes were incubated for 2 h at room temperature with the following primary antibodies: cyclin D1 (1:500, Cell Signaling, Beverly, MA), p44/p42 and p-p44/p42 (1:400, Cell Signaling), and anti-Akt and anti pAkt (1:500, Cell Signaling). Specific antibody binding was detected with HRP-conjugated secondary antibodies (1:5000) (Santa Cruz Biotechnology). Equal protein loading was controlled by immunoblot of the corresponding nonphosphorylated Erk and Akt, using rabbit polyclonal antibodies against the respective proteins. Immunoreactive proteins were revealed with SuperSignal West Pico Chemiluminescence Substrate kit (Pierce, Rockford, IL) and then exposed to X-ray film. Signal intensities were analyzed using the Fluorchem 8000 Advanced Fluorescence, Chemiluminescence, and Visible Light Imaging (Alpha Innotech Corp., San Leandro, CA).
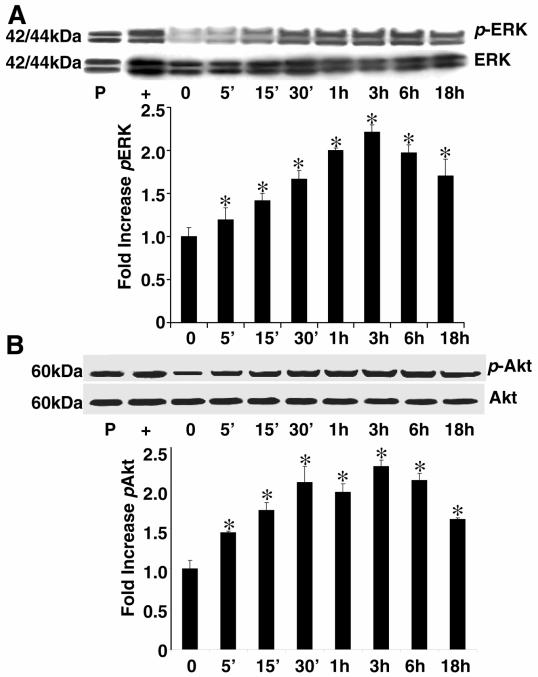
Figure 4. Leptin stimulates phosphorylation of p44/p42 (extracellular regulated kinase, or Erk) and Akt.
HSCs were grown to 70% confluence as described previously, and a time course of Erk and Akt phosphorylation was conducted at the times indicated for leptin treatment (100 ng/ml). Time zero represented the absence of leptin exposure. Cell lysates that were subjected to immunoprecipitation (IP) with anti-Erk or anti-pErk antibodies (A) or anti-Akt or anti-pAkt antibodies (B). Protein from PDGF-treated HSCs for 18 h served as a positive control (P) for both experiments. Protein from epidermal growth factor (EGF)-treated HSCs served as a positive control (+) for phospho-Erk experiments; Jurkat cell extract, prepared with the PI-3K inhibitor LY294002, served as a positive control for phospho-Akt (+). The representative histogram is the densitometric analysis of bands demonstrating fold increase in levels of pErk with respect to Erk, and pAkt with respect to Akt, at various time intervals of leptin treatment. These data are representative of multiple independent experiments; *P<0.01, compared with untreated (time 0) HSC extracts.
Statistical analysis
All experiments were independently performed three times in triplicate. Data were analyzed using paired Student’s t test. Data were considered to be statistically significant if P<0.05. Data are expressed as means ± se.
RESULTS
Leptin increases DNA synthesis in HSCs and the proportion of cells in S- and G2/M-phase of the cell cycle
Leptin treatment of HSCs resulted in significantly higher BrdU incorporation compared with untreated HSCs in culture (Fig. 1A). PDGF, a potent positive control for HSC mitogenesis, resulted in a sixfold increase in BrdU incorporation while leptin resulted in a fourfold increase in HSC-BrdU incorporation, compared with serum-free conditions alone. BrdU incorporation studies, also measured at 4, 12, and 36 h, resulted in similar data, shown here for the 24 h study. The proportion of cells in either S-phase (Fig. 1B) or G2/M-phase (Fig. 1B) was increased by leptin when compared with proportion of HSCs maintained in serum-free conditions. The leptin-treated HSC populations in both the S-phase and G2/M-phase were not significantly different than HSC populations exposed to PDGF-BB (Fig. 1B).
Leptin increases cyclin D1 protein
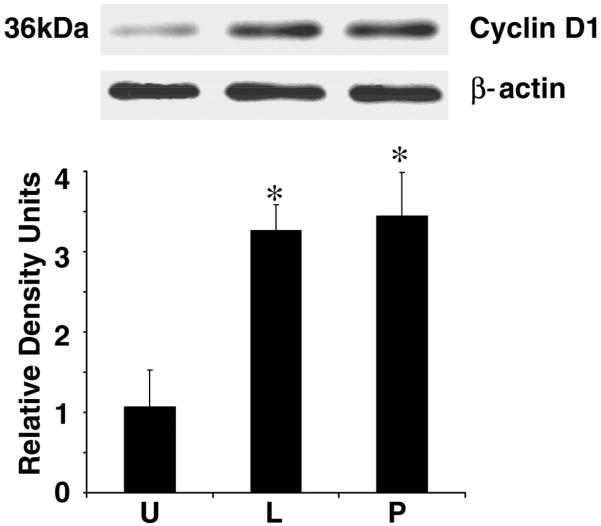
To determine whether leptin acts to increase a key cell cycle-signaling protein, immunoblot analysis was performed with quantitative densitometry demonstrating that leptin increased cyclin D1 protein, and these data were not statistically different when compared with PDGF (Fig. 2). Both leptin and PDGF nearly tripled HSC-cyclin D1 content compared with serum-free conditions. Taken together, these data demonstrate that leptin is a potent HSC mitogen. D-type cyclins play a critical role in HSC cycle progression especially at early G1-phase (42).
Figure 2. Leptin increases cyclin D1 production in HSCs.
HSCs were grown to 80% confluence, serum starved for 24 h in DMEM, and incubated in the presence or absence of leptin (L), PDGF (P), or SF media (U). Cell lysates were prepared and normalized for protein content; 100 μg of protein was resolved on 10% SDS-PAGE, followed by immunoblot analysis with antibodies against cyclin D1. β-Actin served as a loading control. Shown is a representative immunoblot for cyclin D1. The band intensity of cyclin D1 was quantified by densitometry and normalized to β-actin. These data are representative of multiple independent experiments. *P<0.05, compared with untreated (U) controls.
Leptin-induced proliferation of HSCs requires phosphorylation of Ob-Rb
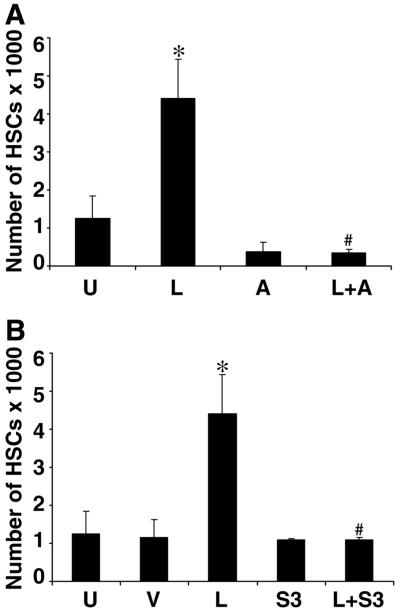
To determine whether leptin-induced HSC proliferation was dependent on Ob-Rb phosphorylation, we used AG490 (A), a chemical inhibitor of Jak2 kinase activity, and SOCS-3, a physiological inhibitor of Ob-Rb phosphorylation (Fig. 3). Either chemical inhibition by AG490 (L+A, Fig. 3A) or overexpression of SOCS-3 (L+S3, Fig. 3B) abolished leptin-induced HSC proliferation as assessed by BrdU incorporation. As also shown, except for leptin-induced HSC proliferation, leptin failed to induce HSC proliferation over serum-free conditions (U) in the presence of AG490 or SOCS-3. These results indicate that failure of Ob-Rb phosphorylation will abolish HSC proliferation.
Figure 3. Leptin fails to induce proliferation of HSCs in the absence of OB-Rb phosphorylation.
Two mechanisms were used to inhibit phosphorylation of OB-Rb and to determine whether leptin-induced HSC proliferation, as assessed by BrdU incorporation, would be abolished. The chemical inhibitor, AG490 (50 μM) (A), and pEF-FLAG-1/mSOCS-3 (S3) (B) were used to block OB-Rb phosphorylation. HSCs were synchronized by serum starvation and treated with leptin alone (L) or in SF media (U) as a negative control. A) HSCs were grown as described previously and treated with AG490 with (L+A) and without leptin (A). B) An empty pEF-FLAG vector (V) was used as a control for SOCS-3 transfection, otherwise the experiment was conducted as with AG490. Incorporation of BrdU into newly synthesized DNA was assessed as described previously and is shown as the means ± se for three independent experiments performed in triplicate. *P< 0.001, compared with control (U) cells; #P< 0.005, compared with treatment with leptin alone.
Leptin increases phosphorylation of both ERK and Akt
To determine potential intracellular signaling mechanisms that are responsible for the mitogenic effect of leptin, we examined immunoprecipitation of phosphorylated signal transduction factors, Erk and Akt. Additional studies were performed to examine whether leptin resulted in increased phosphorylation of Stat1, Stat 5, p38, or JNK over the same course. However, we did not find significant increases in the phosphorylation of Stats 1 and 5 or in the stress-activated protein kinases (SAPKs) p38 and JNK (data not shown). As reported previously, phosphorylation of Stat3 did occur in leptin-treated stellate cells (8). As shown in Figure 4, leptin increased both Erk (Fig. 4A) and Akt (Fig. 4B) phosphorylation, which was maximal at 3 h treatment and was detected up to 24 and 36 h time points (data not shown).
Leptin-induced HSC proliferation is also abolished by LY294002 and PD980059
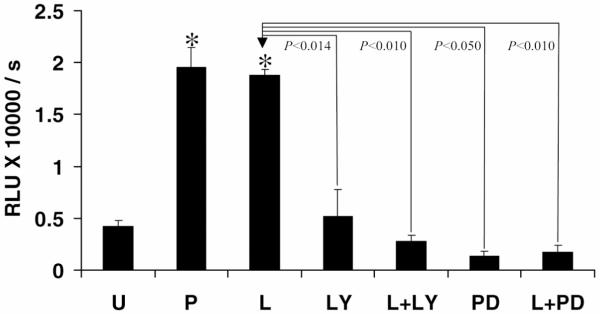
Since leptin-induced HSC proliferation was dependent on Ob-Rb activation and leptin resulted in Erk and Akt phosphorylation, we determined whether leptin-mediated HSC proliferation was either Erk- or Akt-dependent. We used the PI-3 kinase inhibitor LY294002 and the Erk inhibitor PD98059 to determine whether blockade of these pathways abolished leptin-induced BrdU incorporation in HSCs. As is demonstrated in Figure 5, leptin, either in the presence of LY (L+LY) or PD (L+PD), failed to induce HSC-BrdU incorporation as compared with leptin or PDGF, indicating that leptin-induced HSC proliferation was dependent on Erk and/or Akt.
Figure 5. Leptin fails to induce HSC proliferation in the presence of LY or PD.
BrdU incorporation in HSCs was assayed as described previously. Representative histogram shows significantly (*P<0.001) increased DNA synthesis in the presence of either PDGF (P) or leptin (L) as compared with untreated (U) and decreased DNA synthesis in the presence of either LY294002 or PD98059 as compared with leptin treatment alone (L). Leptin failed to rescue DNA synthesis when HSCs were treated with LY294002 (L+LY) or PD98059 (L+PD) as compared with leptin treatment alone (L). No significant difference was observed in BrdU incorporation when comparing LY or PD exposure alone to LY or PD and leptin.
Inhibition of Ob-Rb phosphorylation by SOCS-3 abolishes leptin-induced phosphorylation of Akt and Erk
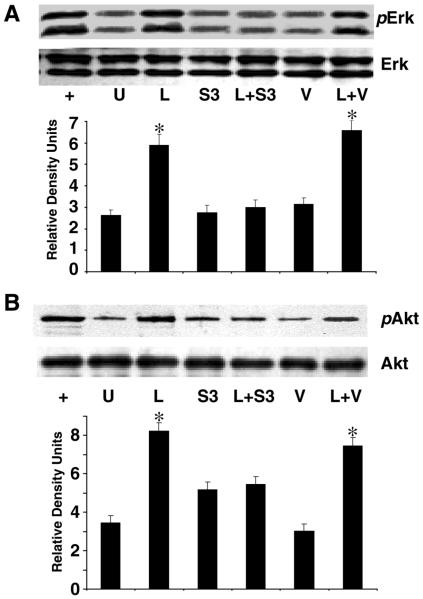
Since both chemical inhibition of Jak2 kinase (Fig. 3) phosphorylation of Ob-Rb and overexpression of SOCS-3 abolished HSC proliferation, and chemical inhibition of Erk and Akt phosphorylation, abolished HSC-BrdU incorporation (Fig. 5), we determined whether inhibition of Ob-Rb phosphorylation would prohibit Akt and Erk phosphorylation, and thus determine if leptin-mediated HSC proliferation was Akt- and/or Erk-dependent. Overexpression of SOCS-3 (S3, Fig. 6A, 6B) abolished phosphorylation of both Akt and Erk, which was not restored by leptin (L+S3, Fig. 6A, 6B). Conversely, the presence of leptin (L, Fig. 6A, 6B) or leptin and the empty vector (L+V) resulted in phosphorylation of both Akt and Erk.
Figure 6. Leptin also fails to induce phosphorylation of Erk and Akt in absence of OB-Rb phosphorylation.
HSCs were grown as described previously; 4 μg of plasmid DNA containing SOCS-3 (S3) was transfected as described elsewhere. PDGF (+), positive control; U, SF media only; L, 100 ng/ml leptin treatment; S3, SOCS-3 expression vector in SF media; L+S3. SOCS-3 expression vector and leptin (100 ng/ml); V, empty vector (negative control); L+V, empty vector and leptin. Transfected HSCs were subjected to leptin treatment for 4 h followed by immunoprecipitation for pErk or Erk (A) and pAkt or Akt (B). The immunoblots and corresponding densitometry are representative of three independent experiments performed in triplicate.*P<0.01, compared with untreated (U) HSCs. Transfection efficiency was determined as described in Materials and Methods, 35.0 ± 2.7%.
In summary, we have shown that leptin-induced HSC proliferation requires both Ob-Rb phosphorylation as well as Erk and Akt phosphorylation, since blockade of Erk phosphorylation by PD98059 or blockade of Akt phosphorylation by LY294002 also blocks HSC proliferation. Importantly, by demonstrating that HSC proliferation is Erk- and Akt-dependent, and HSC-proliferation, Erk, and Akt phosphorylation are essentially abolished by either AG490 or SOCS-3 overexpression, we conclude that leptin-induced Ob-Rb phosphorylation and Erk and Akt phosphorylation are linked as signaling mechanisms responsible for leptin-induced HSC proliferation.
Leptin prevents primary HSC apoptosis through a PI-3 kinase-dependent pathway
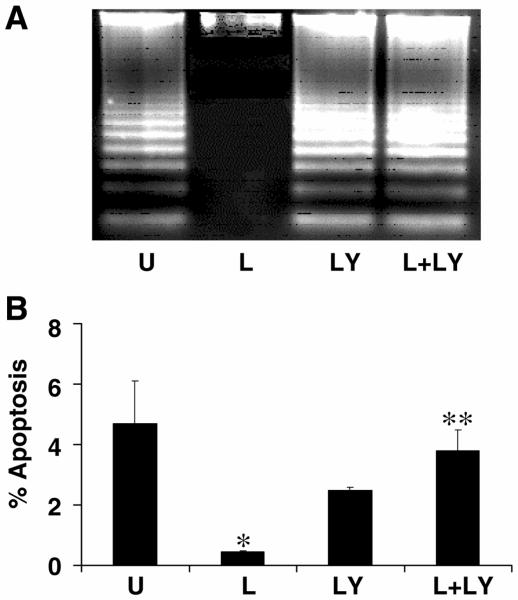
Since the PI-3 kinase pathway is a well-established cell-survival signaling pathway, we determined the effect of leptin on apoptosis of primary activated HSCs using the PI-3 kinase inhibitor LY294002 (LY) (Fig. 7). Assessment by DNA fragmentation (Fig. 7A) or Hoechst staining (Fig. 7B) revealed that compared with serum-free conditions, leptin significantly reduced apoptosis. LY alone resulted in significant apoptosis, resulting in DNA fragmentation associated with serum starvation (U) (Fig. 7A). Graphically, using Hoechst staining, LY alone did not result in an increase in apoptosis compared with control (% apoptosis, LY294002: 2.5+0.1, P=0.18 compared with control: 4.7+1.4, Fig. 7B); however, leptin alone significantly decreased the percentage of apoptosis in HSCs compared with control (% apoptosis, leptin: 0.46+0.01, P<0.05 compared with control). Suppression of apoptosis by leptin was lost in the presence of the PI-3 kinase inhibitor LY (% apoptosis, leptin + LY294002: 3.8+0.7, P<0.01 compared with leptin treatment alone). Thus, leptin appears to inhibit apoptosis in HSCs by a PI-3 kinase-dependent pathway. Importantly, Akt appears to be protective against apoptosis in HSCs.
Figure 7. Leptin prevents primary hepatic stellate cell apoptosis through a PI-3-kinase-dependent pathway.
Primary hepatic stellate cells were serum starved for 16 h and subsequently exposed to SF media (U) (0.1% FBS); leptin (L) (100 ng/ml); LY294002 (LY) (600 nM), and leptin (100 ng/ml) plus LY294002 (L+LY)(600 nM) for 40 h. A) Apoptosis was evaluated by DNA fragmentation and revealed that LY resulted in apoptosis that was not significantly different compared with control and that leptin failed to rescue HSCs from apoptosis caused by LY (L+LY). B) The percent of HSC apoptosis was quantified using the Hoechst method as described in Materials and Methods. The data also revealed that the PI-3-kinase inhibitor LY294002 alone (LY) did not result in an increase in apoptosis compared with control (U), P=0.18. Leptin significantly decreased the percentage of apoptosis in HSCs compared with control (L vs. U, *P<0.05). The suppression of apoptosis by leptin was lost in the presence of the PI-3-kinase inhibitor LY294002 (L+LY vs. LY **P<0.01).
Leptin suppresses HSC apoptosis in vitro
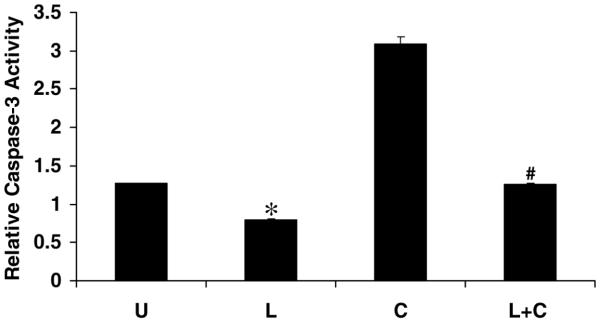
We further examined leptin suppression of apoptosis. Three approaches were used to determine whether leptin reduced apoptotic activity, and more importantly, whether leptin could rescue stellate cells from pretreatment with known HSC-apoptotic stimuli, cycloheximide (42), and TRAIL (43). Leptin did statistically reduce caspase-3 activity (Fig. 8) when compared with serum-starved cells (P<0.05), and leptin also significantly reduced caspase-3 activity induced by cycloheximide up to 66% (Fig. 8). Complementary data from TUNEL staining confirmed that leptin resulted in a 50% reduction in the number of apoptotic bodies counted per high power field compared with cycloheximide alone (Fig. 9). DNA fragmentation analysis also corroborated these findings (Fig. 10); leptin reduced DNA fragmentation associated with serum starvation (L, Fig. 10), and cycloheximide-induced DNA fragmentation (L+C, Fig. 10), just as the pan-caspase inhibitor zVAD-fmk inhibited DNA fragmentation regardless of treatment. TRAIL, a physiological relevant HSC-apoptotic stimulus, was also used to induce cell death. Leptin significantly rescued HSCs from the apoptotic effect of TRAIL (5–50 ng/ml) as assessed by XTT assay (Fig. 11) and DNA fragmentation (Fig. 10) analysis. These results are consistent with results from cycloheximide-induced apoptosis and demonstrate that leptin improved cell viability. Even at supraphysiologic concentrations of TRAIL (T-100+Lep, data not shown), leptin improved the number of viable HSCs, though the data did not reach statistical significance.
Figure 8. Leptin reduces caspase-3 activity in HSCs exposed to cycloheximide.
HSCs were cultured, serum starved (U), and treated with cycloheximide (C) with or without leptin pretreatment (L+C) or leptin alone (L) for 24 h. The concentration of leptin was 100 ng/ml. Cells were lysed, and caspase-3 activity was analyzed as described in Materials and Methods. Caspase-3 activity of cell extracts from HSCs, treated with cycloheximide, with or without leptin, was compared with HSC in serum starvation (U). Leptin alone reduced caspase-3 activity compared with serum-starvation, *P<0.05, whereas leptin pretreatment (L+C) significantly reduced caspase-3 activity by 66% when compared with cycloheximide exposure alone (C), #P<0.001. Data are expressed as means ± se. The assay is representative of three independent experiments performed in triplicate.
Figure 9. TUNEL assay reveals leptin rescue of HSCs from cycloheximide.
A) Fluorescent photomicrograph of HSC demonstrating apoptotic bodies (arrows) induced by cycloheximide and identified in situ by TUNEL. Cells were cultured and treated as described previously. Untreated (absolute serum-starvation) (a); leptin only (b); cycloheximide (c); leptin plus cycloheximide (d). After treatment, HSCs were subjected to TUNEL staining. Apoptotic bodies were visible (arrows) in untreated HSCs (a) and following cycloheximide exposure (c); leptin significantly reduced the number of apoptotic bodies induced by cycloheximide (d); magnification 40×. B) TUNEL-positive cells were scored for respective quantitation. The percentage of apoptotic HSCs represents the means ± se of 10 high-power fields of three independent experiments performed in triplicate. Percent of apoptotic HSCs exposed to leptin alone was negligible as compared with serum-starved HSCs (U), *P<0.01. Percent of apoptotic HSCs resulting from cycloheximide (80%) was significantly reduced by leptin (L+C), #P<0.01.
Figure 10. Cycloheximide- or TRAIL-induced DNA fragmentation in HSCs was abolished by leptin, and zVAD-fmk, the pan-caspase inhibitor.
HSCs were treated with TRAIL or cycloheximide for 24 h followed by leptin or zVAD-fmk for 24 h. HSCs were harvested, and DNA was extracted as described in Materials and Methods. Fragmented DNA was analyzed by electrophoresis across a 1.2% agarose gel containing 0.1% ethidium bromide. The experiment was repeated three times. Lyophilized apoptotic U937 cells (treated with camptothecin) were used as positive control (+) for DNA fragmentation. U, absolute serum starvation; L, leptin in SF media; C, cycloheximide in SF media; L+C, leptin plus cycloheximide; Z+C, zVAD-fmk plus cycloheximide in SF media; T, TRAIL in SF media; L+T, TRAIL and leptin in SF media; Z+T, zVAD-fmk and TRAIL in SF media.
Figure 11. Leptin rescues the HSCs from TRAIL-induced apoptosis.
HSCs were incubated for 24 h in 10% FBS/DMEM and successively maintained for 15 h in SF-DMEM. Serum-starved cells were exposed to various concentrations of TRAIL (5, 25, and 50 ng/ml) in the presence or absence of leptin (100 ng/ml). After 24 h of TRAIL exposure, XTT was added and absorbance was measured. The histogram represents the number of viable HSCs under conditions of serum starvation (U), TRAIL (5 ng/ml) (T5), TRAIL (25 ng/ml) (T25), TRAIL (50 ng/ml) (T50), and TRAIL (various concentrations) plus leptin (L+T). Data represent means ± se of three independent experiments performed in triplicate, (T25, T50 vs. U, #P<0.01), (L+T vs. respective T doses, *P<0.01).
DISCUSSION
We have undertaken an exhaustive series of experiments using the established model of primary, activated HSCs in tissue culture and analyzed the influence of leptin on HSC mitogenesis and apoptosis. We have demonstrated that leptin promotes stellate cell mitogenesis and cell survival, two seminal events that are thought to promote liver fibrosis upon chronic stimuli, resulting in liver injury. Our previous (8) and current data, therefore, provide cogent cellular and molecular evidence that leptin plays a unique role in the development of liver fibrosis. We report here that leptin-induced phosphorylation of the long form of the leptin receptor via Jak2 kinase activation results in phosphorylation of Erk and Akt, two key signal transduction elements associated with cell growth. Abolishing leptin-induced phosphorylation, either by SOCS-3 overexpression or pharmacologic inhibition, prevents Erk and Akt phosphorylation. In addition, SOCS-3 clearly blocks HSC proliferation and Ob-Rb phosphorylation. Consequently, not only does leptin appear to promote liver fibrosis by activating known extracellular matrix response genes, as has been previously reported (6, 7, 25), but it also perpetuates the fibrogenic process by directly inducing stellate cell proliferation and resistance to a timely death by apoptosis.
Recent data indicate that Jak2 represents the unique Jak kinase involved in signaling by the intracellular domain of Ob-Rb (44). In this regard, however, the relationship of leptin to key mitogenic and anti-apoptotic signaling systems, including Erk and Akt, has only recently been examined, and not in HSCs.
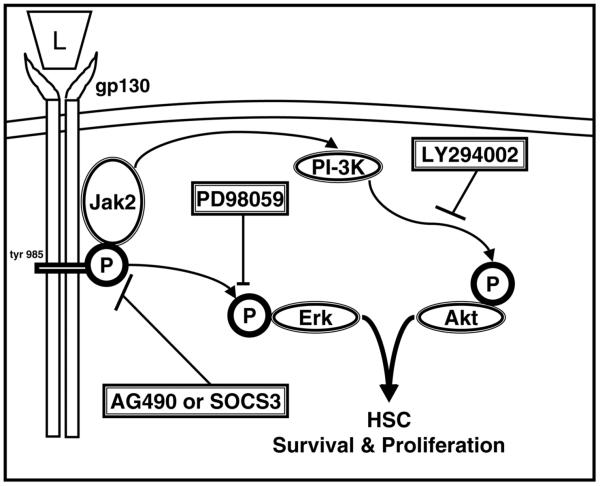
AG490 was used in the presence of leptin to block Jak2 tyrosine phosphorylation of Ob-Rb to prevent tyrosine phosphorylation of residue 985. Phosphorylated Tyr985 is known to recruit the SH2-containing tyrosine phosphatase SHP-2 to activate the signaling pathway that culminates in Erk activation (45, 46). The mitogenic effect of leptin was abolished by chemical inhibition with AG490. We found similar results with overexpression of SOCS-3—a feedback inhibitor of Ob-Rb signal transduction—which, as anticipated, completely blocked leptin-mediated HSC proliferation. Since Erk and Akt phosphorylation were increased in leptin-treated HSCs as shown, and respective chemical inhibition of Erk (PD098059) and Akt phosphorylation (PI-3 kinase inhibition with LY294002) abolished leptin-induced mitogenesis, we have demonstrated that prevention of Ob-Rb phosphorylation suppresses both HSC proliferation and Erk and/or Akt phosphorylation, as is demonstrated by the overexpression of SOCS-3. Taken together, our data demonstrate that Ob-Rb phosphorylation and HSC mitogenesis are linked to Erk and Akt phosphorylation. These findings, to our knowledge, are the first to report a molecular link between leptin signal transduction and Erk- and Akt-mediated action in HSC proliferation and survival. This novel paradigm in HSC biology is illustrated in Figure 12. Further studies will need to be performed to determine whether both Erk and Akt play an equal role in leptin-induced HSC mitogenesis.
Figure 12. Schematic diagram for leptin-induced HSC profibrogenic mechanisms induced by Jak activation and OB-Rb phosphorylation.
Leptin (L) signals as any gp130 cytokine primarily by Jak2 phosphorylation of several key tyrosine residues (46). OB-Rb phosphorylation promotes HSC proliferation and survival by Erk and Akt activation. SOCS-3, a feedback inhibitor of OB-Rb signaling, and AG490, a chemical inhibitor of Jak2 kinase activity, both block HSC proliferation and survival by blocking phosphorylation of either Erk or Akt. HSC survival was inhibited by the PI3-kinase inhibitor LY294002. Importantly, HSC proliferation was blocked by the MAPK inhibitor PD98059, the PI3-kinase inhibitor LY294002, as well as pharmacologic and biologic OB-Rb signal blockade. Leptin could not suppress apoptosis in the presence of LY, indicating that Akt is highly protective against HSC apoptosis.
The present studies not only implicate leptin in promoting HSC proliferation, but importantly, we report for the first time leptin appears to promote HSC survival against apoptosis, and this appears to be mediated by the PI-3 kinase pathway. Although leptin could overcome both cycloheximide- and TRAIL-mediated apoptosis, the presence of leptin could not suppress apoptosis induced by LY294002, a potent inhibitor of the downstream phosphorylation of Akt. These data indicate that the PI-3 kinase/Akt pathway is highly protective against HSC apoptosis. Resistance to apoptosis provides an important escape mechanism by which stellate cells in injured liver continue to promote fibrotic changes that lead to cirrhosis. Therefore, HSC apoptosis is fundamental to sustaining liver fibrosis. Iredale and colleagues have clearly delineated HSC resistance to apoptosis (33, 34) to support this role. Hence by using cycloheximide or TRAIL in some of the experiments presented here, we provide evidence that leptin will prevent apoptosis, even in the face of highly potent HSC pro-apoptotic stimuli.
HSCs can also undergo an activation-induced death analogous to that of T cells via a Fas/Fas ligand-dependent mechanism (47, 48). However, since hepatocytes are very susceptible to Fas-induced cell death, the use of Fas/Fas ligand has less biologic relevance or therapeutic application in HSC apoptosis. HSCs also express another death receptor (DR), low-affinity nerve growth factor (p75), and its stimulation also results in apoptosis (30). TRAIL receptors are another important family of DRs that show selectivity between normal and activated cell types (49), and two recent reports indicate that hepatocytes are not likely to be susceptible to apoptosis by TRAIL (47, 50) because they lack the TRAIL DR. HSCs show activation-dependent TRAIL/DR5 expression and TRAIL-mediated apoptosis (51). Here, we show for the first time that the effect of the biologically relevant pro-apoptotic HSC mediator, TRAIL, is also abolished by leptin.
Finally, these data have important clinical as well as biological implications. Nonalcoholic fatty liver disease is a major health problem and may account for a significant number of patients with “cryptogenic” cirrhosis. These conditions are associated with increased serum leptin levels. Future work will be needed to elucidate whether leptin can induce activation of stellate cells from the quiescent phenotype to the activated one. A fundamental biologic process observed is that leptin-receptor signal activation of Akt or Erk, usually associated with metabolism and appetite, is multifaceted, promoting stellate cell survival and proliferation. Thus, as in the behavior of neoplastic cells, leptin has the potential to establish dangerous longevity of the activated stellate cell and therefore impede resolution of abnormal extracellular matrix that composes scar tissue in cirrhosis. These data therefore provide strong evidence that leptin is mechanistically important in promoting fibrosis and, in concert with our previous work, convincingly prove that leptin is a novel multi-faceted profibrogenic cytokine.
ACKNOWLEDGMENTS
This work was supported by National Institutes of Health grants AA 12933 and DK 062092 awarded to FAA (Emory University School of Medicine) and DK 02802 and DK 064644 awarded to SVS (Emory University School of Medicine).
REFERENCES
- 1.Alberti KG, Zimmet PZ. Definition, diagnosis and classification of diabetes mellitus and its complications. Part 1: diagnosis and classification of diabetes mellitus provisional report of a WHO consultation. Diabet. Med. 1998;15:539–553. doi: 10.1002/(SICI)1096-9136(199807)15:7<539::AID-DIA668>3.0.CO;2-S. [DOI] [PubMed] [Google Scholar]
- 2.Diehl AM. Nonalcoholic steatohepatitis. Semin. Liver Dis. 1999;19:221–229. doi: 10.1055/s-2007-1007111. [DOI] [PubMed] [Google Scholar]
- 3.Contos MJ, Sanyal AJ. The clinicopathologic spectrum and management of nonalcoholic fatty liver disease. Adv. Anat. Pathol. 2002;9:37–51. doi: 10.1097/00125480-200201000-00005. [DOI] [PubMed] [Google Scholar]
- 4.Wolf G, Chen S, Han DC, Ziyadeh F. Leptin and renal disease. Am. J. Kidney Dis. 2002;39:1–11. doi: 10.1053/ajkd.2002.29865. [DOI] [PubMed] [Google Scholar]
- 5.Honda H, Ikejima K, Hirose M, Yoshikawa M, Lang T, Enomoto N, Kitamura T, Takei Y, Sato N. Leptin augments inflammatory and profibrogenic responses in the murine liver induced by hepatotoxic chemicals. Hepatology. 2002;36:12–21. doi: 10.1053/jhep.2001.26518. [DOI] [PubMed] [Google Scholar]
- 6.Ikejima K, Takei Y, Honda H, Hirose M, Yoshikawa M, Zang YJ, Lang T, Fakuda T, Yamashina S, Kitamura T, et al. Leptin receptor-mediated signaling regulates hepatic fibrogenesis and remodeling of extracellular matrix in the rat. Gastroenterology. 2002;122:1399–1410. doi: 10.1053/gast.2002.32995. [DOI] [PubMed] [Google Scholar]
- 7.Leclercq IA, Farrell GC, Schriemer R, Robertson GR. Leptin is essential for the hepatic fibrogenic response to chronic liver injury. J. Hepatol. 2002;37:206–213. doi: 10.1016/s0168-8278(02)00102-2. [DOI] [PubMed] [Google Scholar]
- 8.Saxena NK, Ikeda K, Rockey DC, Friedman SL, Anania FA. Leptin in hepatic fibrosis: evidence for increased collagen production in stellate cells and lean littermates of ob/ob mice. J. Hepatol. 2002;37:206–213. doi: 10.1053/jhep.2002.32029. [DOI] [PMC free article] [PubMed] [Google Scholar]
- 9.Tartaglia LA, Dembski M, Weng X, Deng N, Culpepper J, Devos R, Richards GJ, Clark FT, Deeds J. Identification and expression cloning of a leptin receptor, OB-R. Cell. 1995;83:1263–1271. doi: 10.1016/0092-8674(95)90151-5. [DOI] [PubMed] [Google Scholar]
- 10.Baumann H, Morella KK, White DW, Dembski M, Bailonn PS, Kim H, Lai C-F, Tartaglia LA. The full-length leptin receptor has signaling capabilities of interleukin 6-type cytokine receptors. Proc. Natl. Acad. Sci. USA. 1996;93:8374–8378. doi: 10.1073/pnas.93.16.8374. [DOI] [PMC free article] [PubMed] [Google Scholar]
- 11.Friedman JM, Halaas JL. Leptin and the regulation of body weight in mammals. Nature. 1998;395:763–770. doi: 10.1038/27376. [DOI] [PubMed] [Google Scholar]
- 12.Gainsford T, Willson TA, Metcalf D, Handman E, McFarlane C, Ng A, Nicola NA, Alexander WS, Hilton DJ. Leptin can induce proliferation, differentiation, and functional activation of hemopoietic cells. Proc. Natl. Acad. Sci. USA. 1996;93:14564–14568. doi: 10.1073/pnas.93.25.14564. [DOI] [PMC free article] [PubMed] [Google Scholar]
- 13.Morton NM, Emilsson V, Liu YL, Cawthorne MA. Leptin action in intestinal cells. J. Biol. Chem. 1998;273:26194–26201. doi: 10.1074/jbc.273.40.26194. [DOI] [PubMed] [Google Scholar]
- 14.Ghilardi N, Ziegler S, Wiestner A, Stoffel R, Heim MH, Skoda RC. Defective STAT signaling by the leptin receptor in diabetic mice. Proc. Natl. Acad. Sci. USA. 1996;93:6231–6235. doi: 10.1073/pnas.93.13.6231. [DOI] [PMC free article] [PubMed] [Google Scholar]
- 15.Takahashi Y, Okimura Y, Mizuno I, Iida K, Takahashi T, Kaji H, Abe H, Chihara K. Leptin induces mitogen-activated protein kinase-dependent proliferation of C3H10T1/2 cells. J. Biol. Chem. 1997;272:12897–12900. doi: 10.1074/jbc.272.20.12897. [DOI] [PubMed] [Google Scholar]
- 16.Ghilardi N, Skoda RC. The leptin receptor activates Janus kinase 2 and signals for proliferation in a factor-dependent cell line. Mol. Endocrinol. 1997;11:393–399. doi: 10.1210/mend.11.4.9907. [DOI] [PubMed] [Google Scholar]
- 17.Bennett BD, Solar GP, Yuan JQ, Mathias J, Thomas RG, Matthews W. A role for leptin and its cognate receptor in hematopoiesis. Curr. Biol. 1996;6:1170–1180. doi: 10.1016/s0960-9822(02)70684-2. [DOI] [PubMed] [Google Scholar]
- 18.Lord GM, Matarese G, Howard JK, Baker RJ, Bloom SR, Lechler RI. Leptin modulates the T-cell immune response and reverses starvation-induced immunosuppression. Nature. 1998;394:897–900. doi: 10.1038/29795. [DOI] [PubMed] [Google Scholar]
- 19.Zhou H, Xin-Ming L, Meinkoth J, Pittman RN. Akt regulates cell survival and apoptosis at a postmitochondrial level. J. Cell Biol. 2000;151:483–494. doi: 10.1083/jcb.151.3.483. [DOI] [PMC free article] [PubMed] [Google Scholar]
- 20.Deregibus MC, Buttiglieri S, Russo S, Bussolati B, Camussi G. CD40-dependent activation of phosphatidylinositol 3-kinase/Akt pathway mediates endothelial cell survival and in vitro angiogenesis. J. Biol. Chem. 2003;278:18008–18014. doi: 10.1074/jbc.M300711200. [DOI] [PubMed] [Google Scholar]
- 21.Szanto I, Kann CR. Selective interaction between leptin and insulin signaling pathways in a hepatic cell line. Proc. Natl. Acad. Sci. USA. 2000;97:2355–2360. doi: 10.1073/pnas.050580497. [DOI] [PMC free article] [PubMed] [Google Scholar]
- 22.Kim YB, Uotani S, Pierroz DD, Flier JS, Kahn BB. In vivo administration of leptin activates signal transduction directly in insulin-sensitive tissues: overlapping but distinct pathways from insulin. Endocrinology. 2000;141:2328–2339. doi: 10.1210/endo.141.7.7536. [DOI] [PubMed] [Google Scholar]
- 23.Zhao AZ, Shinohara MM, Huang D, Shimizu M, Eldar-Finkelman H, Krebs EG, Beavo JA, Bornfeldt KE. Leptin induces insulin-like signaling that antagonizes cAMP elevation by glucagon in hepatocytes. J. Biol. Chem. 2000;275:11348–11354. doi: 10.1074/jbc.275.15.11348. [DOI] [PubMed] [Google Scholar]
- 24.Vecchione C, Maffei A, Colella S, Aretini A, Poulet R, Frati G, Gentile MT, Fratta L, Trimarco V, Trimarco B, et al. Leptin effect on endothelial nitric oxide is mediated through Akt-endothelial nitric oxide synthase phosphorylation pathway. Diabetes. 2002;51:168–173. doi: 10.2337/diabetes.51.1.168. [DOI] [PubMed] [Google Scholar]
- 25.Friedman SL. Molecular regulation of hepatic fibrosis, an integrated cellular response to tissue injury. J. Biol. Chem. 2000;275:2247–2250. doi: 10.1074/jbc.275.4.2247. [DOI] [PubMed] [Google Scholar]
- 26.Friedman SL. Cytokines and fibrogenesis. Semin. Liver Dis. 1999;19:129–140. doi: 10.1055/s-2007-1007105. [DOI] [PubMed] [Google Scholar]
- 27.Potter JJ, Womack L, Mezey E, Anania FA. Transdifferentiation of rat hepatic stellate cells results in leptin expression. Biochem. Biophys. Res. Commun. 1998;244:178–182. doi: 10.1006/bbrc.1997.8193. [DOI] [PubMed] [Google Scholar]
- 28.Pinzani M, Milani S, Herbst H, DeFranco R, Grappone C, Gentilini A, Caligiuri A, Pellegrini G, Ngo DV, Romanelli RG, et al. Expression of platelet-derived growth factor and its receptors in normal human liver and during active hepatic fibrogenesis. Am. J. Pathol. 1996;148:785–800. [PMC free article] [PubMed] [Google Scholar]
- 29.Casini A, Pinzani M, Milani S, Grappone C, Galli G, Jezequel AM, Schuppan D, Rotella CM, Surrenti C. Regulation of extracellular matrix synthesis by transforming growth factor beta 1 in human fat-storing cells. Gastroenterology. 1993;105:245–253. doi: 10.1016/0016-5085(93)90033-9. [DOI] [PubMed] [Google Scholar]
- 30.Trim N, Morgan S, Evans M, Issa R, Fine D, Afford S, Wilkins B, Iredale J. Hepatic stellate cells express the low affinity nerve growth factor receptor p75 and undergo apoptosis in response to nerve growth factor stimulation. Am. J. Path. 2000;156:1235–1243. doi: 10.1016/S0002-9440(10)64994-2. [DOI] [PMC free article] [PubMed] [Google Scholar]
- 31.Issa R, Williams E, Trim N, Kendall T, Arthur MJ, Reichen J, Benyon RC, Iredale JP. Apoptosis of hepatic stellate cells: involvement in resolution of biliary fibrosis and regulation by soluble growth factors. Gut. 2001;48:548–557. doi: 10.1136/gut.48.4.548. [DOI] [PMC free article] [PubMed] [Google Scholar]
- 32.Murphy FR, Issa R, Zhou X, Ratnarajah S, Nagase H, Arthur MJP, Benyon C, Iredale JP. Inhibition of apoptosis of activated hepatic stellate cells by tissue inhibitor of metalloproteinase-1 is mediated via effects on matrix metalloproteinase inhibition: implications for reversibility of liver fibrosis. J. Biol. Chem. 2002;277:11069–11076. doi: 10.1074/jbc.M111490200. [DOI] [PubMed] [Google Scholar]
- 33.Iredale JP, Benyon RC, Pickering J, McCullen M, Northrop M, Pawley S, Hovell C, Arthur MJ. Mechanisms of spontaneous resolution of rat liver fibrosis. Hepatic stellate cell apoptosis and reduced hepatic expression of metalloproteinase inhibitors. J. Clin. Invest. 1998;102:538–549. doi: 10.1172/JCI1018. [DOI] [PMC free article] [PubMed] [Google Scholar]
- 34.Anania FA, Potter JJ, Rennie-Tankersley L, Mezey E. Effects of acetaldehyde on nuclear protein binding to the nuclear factor I consensus sequence in the alpha 2(I) collagen promoter. Hepatology. 1995;21:1640–1648. [PubMed] [Google Scholar]
- 35.Friedman SL, Roll FJ. Isolation and culture of hepatic lipocytes, Kupffer cells, and sinusoidal endothelial cells by density gradient centrifugation with Stractan. Anal. Biochem. 1987;161:207–218. doi: 10.1016/0003-2697(87)90673-7. [DOI] [PubMed] [Google Scholar]
- 36.Burysek L, Syrovets T, Simmet T. The serine protease plasmin triggers expression of MCP-1 and CD40 in human primary monocytes via activation of p38 MAPK and janus kinase (JAK)/STAT signaling pathways. J. Biol. Chem. 2002;277:33509–33517. doi: 10.1074/jbc.M201941200. [DOI] [PubMed] [Google Scholar]
- 37.Ormerod MG. The study of apoptotic cells by flow cytometry. Leukemia. 1998;12:1013–1025. doi: 10.1038/sj.leu.2401061. [DOI] [PubMed] [Google Scholar]
- 38.Dudek H, Datta SR, Franke TF, Birnbaum RY, Cooper GM, Segal RA, Kaplan DR, Greenberg ME. Regulation of Neural Survival by the Serine-Threonine Protein Kinase Akt. Science. 1997;275:661–665. doi: 10.1126/science.275.5300.661. [DOI] [PubMed] [Google Scholar]
- 39.Bradford MM. A rapid and sensitive method for the quantitation of microgram quantities of protein utilizing the principle of protein-dye binding. Anal. Biochem. 1976;72:248–254. doi: 10.1016/0003-2697(76)90527-3. [DOI] [PubMed] [Google Scholar]
- 40.Laemmli UK. Cleavage of structural proteins during the assembly of the head of bacteriophage T4. Nature. 1970;227:680–685. doi: 10.1038/227680a0. [DOI] [PubMed] [Google Scholar]
- 41.Starr R, Willson TA, Viney EM, Murray LJ, Rayner JR, Jenkins BJ, Gonda TJ, Alexander WS, Metcalf D, Nicola NA, Hilton DJ. A family of cytokine-inducible inhibitors of signalling. Nature. 1997;387:917–921. doi: 10.1038/43206. [DOI] [PubMed] [Google Scholar]
- 42.Kawada N, Ikeda K, Seki S, Kuroki T. Expression of cyclins D1, D2 and E correlates with proliferation of rat stellate cells in culture. J. Hepatol. 1999;30:1057–1064. doi: 10.1016/s0168-8278(99)80260-8. [DOI] [PubMed] [Google Scholar]
- 43.Alessenko AV, Boikov PYa., Filippova GN, Khrenov AV, Loginov AS, Makarieva ED. Mechanisms of cycloheximide-induced apoptosis in liver cells. FEBS Lett. 1997;416:113–116. doi: 10.1016/s0014-5793(97)01161-7. [DOI] [PubMed] [Google Scholar]
- 44.Kloek C, Haq AK, Dunn SL. Regulation of Jak kinases by intracellular leptin receptor sequences. J. Biol. Chem. 2002;277:41547–41555. doi: 10.1074/jbc.M205148200. [DOI] [PubMed] [Google Scholar]
- 45.Banks AS, Davis SM, Bates SH. Activation of downstream signals by the long form of the leptin receptor. J. Biol. Chem. 2000;275:14563–14572. doi: 10.1074/jbc.275.19.14563. [DOI] [PubMed] [Google Scholar]
- 46.Myers MG. Leptin receptor signaling and the regulation of mammalian physiology. Recent Prog. Horm. Res. 2004;59:287–304. doi: 10.1210/rp.59.1.287. [DOI] [PubMed] [Google Scholar]
- 47.Taimr P, Higuchi H, Kocova E, Rippe RA, Friedman S, Gores GJ. Activated stellate cells express the TRAIL receptor-2/death receptor-5 and undergo TRAIL-mediated apoptosis. Hepatology. 2003;37:87–95. doi: 10.1053/jhep.2003.50002. [DOI] [PubMed] [Google Scholar]
- 48.Saile B, Knittel T, Matthes N, Schott P, Ramadori G. CD95/CD95L mediated apoptosis of the hepatic stellate cell. A mechanism terminating uncontrolled hepatic stellate cell proliferation during hepatic tissue repair. Am. J. Pathol. 1997;151:1265–1272. [PMC free article] [PubMed] [Google Scholar]
- 49.Krammer PH. CD95’s deadly mission in the immune system. Nature. 2000;407:789–795. doi: 10.1038/35037728. [DOI] [PubMed] [Google Scholar]
- 50.Wang J, Zheng L, Lobito A, Chan FK, Dale J, Sneller M, Yao X, Puck JM, Straus SE, Lenardo MJ. Inherited human Caspase 10 mutations underlie defective lymphocyte and dendritic cell apoptosis in autoimmune lymphoproliferative syndrome type II. Cell. 1999;98:47–58. doi: 10.1016/S0092-8674(00)80605-4. [DOI] [PubMed] [Google Scholar]
- 51.Gores GJ, Kaufmann SH. Is TRAIL hepatotoxic? Hepatology. 2001;34:3–6. doi: 10.1053/jhep.2001.25173. [DOI] [PubMed] [Google Scholar]


