Self-rated health status (SRHS) reflects both objective information about physical and mental health and subjective interpretation of that information.1,2 Although SRHS may differ from physician ratings of health status, among adults, SRHS is a valuable predictor of health-care utilization1 and has been shown in numerous studies to predict subsequent morbidity and mortality, independent of known medical risk factors.3–5
While the determinants and predictive value of SRHS among adults have been studied extensively, adolescent SRHS is not as well understood. Despite having much lower rates of chronic disease and disability, adolescents report only marginally better SRHS than adults.6 This discrepancy suggests that adolescent SRHS may be influenced by factors more salient to adolescents, such as health risk behavior participation,2 psychological well-being, and competence in areas such as school achievement, sports, and exercise.6–8 Patterns of health risk behaviors are often established during adolescence, extend into adulthood, and are precursors for health-care use, morbidity, and mortality among young people and adults.9,10 Adolescence is also a crucial period in the formation of health status ratings,7,10,11 which studies show remain moderately stable into young adulthood; for example, during a one- or four-year period, adolescents' initial SRHS was a stronger predictor of future SRHS than initial physical or mental health or changes in physical or mental health.12,13 Therefore, it is important to identify factors associated with adolescent SRHS, as they may have implications for current and future health-care utilization, morbidity, and mortality.
Associations between risk behaviors and adolescent SRHS have been documented. Specifically, studies have found associations between poorer SRHS and cigarette smoking,6,8,11,14–17 physical inactivity,7,16–19 being overweight or obese,11,17,20 and violence exposure.21 Associations of SRHS with alcohol and other drug use have been inconsistent.6,8,11,14,15,17 Associations between SRHS and other important risk behaviors, such as sexual behaviors, have not been studied.
Most previous studies were conducted among Canadian and European populations,6,8,11,16–19,22 and focused exclusively on correlates of fair or poor SRHS. Few have sought to identify correlates of excellent SRHS, which studies among adults show are not simply the inverse of the correlates of fair or poor SRHS.23–25 Furthermore, though several studies have found differences in SRHS by sex and race/ethnicity among U.S. adolescents,7,8,14,20 few have examined whether associations of risk behaviors with SRHS vary by sex20 or race/ethnicity.14
Therefore, the purpose of this study was to determine whether selected risk behaviors are associated with excellent and fair or poor SRHS and to determine whether these associations vary by sex and race/ethnicity among a nationally representative sample of U.S. high school students. Research on the associations of SRHS with risk behaviors, as well as categories of risk behaviors, could shed light on the factors that influence adolescents' perceived health status.
METHODS
Sample and survey administration
We obtained data from the 2007 national school-based Youth Risk Behavior Survey (YRBS). The Centers for Disease Control and Prevention (CDC) developed the YRBS to monitor the prevalence of priority risk behaviors among young people. In 2007, a three-stage cluster sample design was used to obtain a nationally representative sample of U.S. students in grades nine through 12. Sampling strategies and psychometric properties of the questionnaire have been reported elsewhere.9,26,27
Student participation in the survey was anonymous and voluntary, and local parental permission procedures were followed. CDC's Institutional Review Board granted approval for the survey. Students completed the self-administered, 98-item questionnaire during a regular class period. Responses were recorded directly on a computer-scannable questionnaire booklet. Usable questionnaires were obtained from 14,041 students. The school response rate was 81%, the student response rate was 84%, and the overall response rate was 68%. Missing data were not imputed. A weighting factor was applied to each student record to adjust for nonresponse and oversampling of black and Hispanic students.
Measures
Demographic variables
Demographic variables included student sex, race/ethnicity, and grade.
Self-rated health status
The dependent variable, SRHS, was measured by the question, “How would you describe your health in general?” Response options included “excellent,” “very good,” “good,” “fair,” or “poor.” Response options were collapsed into three categories: excellent, very good or good, and fair or poor.
Risk behaviors
Independent variables included 29 risk behaviors, selected to capture a variety of risk behaviors in the following categories: behaviors that contribute to unintentional injury and violence; tobacco, alcohol, and other drug use; sexual behaviors; dietary behaviors; physical activity; body weight and weight control; and other health-related topics. Each behavior was measured by a single question, and response options were collapsed to create a dichotomous variable indicating the presence or absence of the behavior, with the following exceptions:
Responses to questions measuring lifetime cigarette use (i.e., ever tried cigarette smoking) and current cigarette use (i.e., smoked cigarettes on at least one day during the 30 days before the survey) were combined to create a single variable with the following mutually exclusive categories: never used cigarettes, lifetime cigarette use (but not current cigarette use), and current cigarette use. Categorical variables for alcohol and marijuana use were derived similarly. Other illicit drug use was derived from questions about lifetime use of cocaine, inhalants, heroin, methamphetamines, ecstasy, hallucinogenic drugs, steroids, and injection drugs; responses were combined to create a dichotomous variable coded as having ever used one or more illicit drugs vs. never having used any illicit drug.
Responses to questions that assessed lifetime sexual activity (i.e., ever had sexual intercourse) and current sexual activity (i.e., had sexual intercourse with at least one person during the three months before the survey) were combined to create a single variable with the following mutually exclusive categories: never had sexual intercourse, lifetime sexual activity (but not currently sexually active), and current sexual activity.
Body mass index (BMI), calculated from self-reported height and weight data, was categorized based on age- and sex-specific growth curves and standard definitions from CDC;28 students with a BMI ≥95th percentile were considered obese, those with a BMI ≥85th but, <95th percentile were considered overweight, those with a BMI ≥15th but, <85th percentile were considered normal weight, and those with a BMI, <15th percentile were considered underweight. Normal BMI was the referent. A dichotomous variable for engaging in unhealthy weight-control practices was created from responses to three questions about fasting (i.e., going without eating for 24 hours or more); taking diet pills, powders, or liquids without a doctor's advice; and vomiting or taking laxatives. Students who engaged in one or more of these practices were compared with those who engaged in none.
Responses to two questions regarding lifetime asthma (i.e., ever been told by a doctor or nurse that they had asthma) and current asthma (i.e., still had asthma) were combined to create a single asthma variable with the following mutually exclusive categories: never had asthma, lifetime (but not current) asthma, and current asthma.
All dichotomous variables were coded such that participation in the risk behavior was the response of interest and not participating was the referent. Cigarette use, alcohol use, marijuana use, and sexual activity were coded such that never engaging in the behavior was the referent category.
Analysis
The final sample included 12,193 students who responded to the SRHS question. To account for the complex sample design, we conducted all analyses using SUDAAN®.29 Pairwise differences in prevalence estimates by sex, race/ethnicity, and grade were determined using t-tests and considered significant at p<0.05.
For each risk behavior, we ran multinomial regression models, controlling for sex, race/ethnicity, and grade. Very good or good SRHS was the referent category for the dependent variable. We calculated the odds of excellent SRHS compared with the referent and the odds of fair or poor SRHS compared with the referent. Next, we ran multinomial regression models testing for interactions by sex and race/ethnicity. To account for the number of interactions tested, we considered interactions significant at p<0.01. Preliminary analyses revealed interactions by sex for five of 29 risk behaviors and interactions by race/ethnicity for nine of 29 risk behaviors. Because we found nearly twice as many interactions for race/ethnicity as for sex, all analyses were stratified by race/ethnicity. We then ran separate multinomial regression models among white, black, and Hispanic students (the numbers of students from other racial/ethnic groups were too small for stable analyses) for each risk behavior, controlling for sex and grade.
Finally, within each racial/ethnic stratum, we tested whether associations varied by sex. When a significant interaction term (p<0.01) was present, we further stratified the racial/ethnic-specific multinomial regression model by sex.
RESULTS
Distribution of SRHS by demographic subgroup
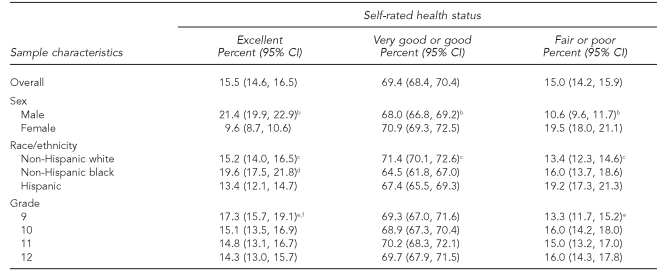
Overall, 15.5% of students rated their health as excellent (Table 1). Most students (69.4%) reported very good or good SRHS, while 15.0% reported fair or poor SRHS. SRHS varied by sex and race/ethnicity. The prevalence of excellent SRHS was higher among male students, and the prevalence of fair or poor SRHS was higher among female students. Black students had a higher prevalence of excellent SRHS than white and Hispanic students; additionally, white students had a higher prevalence of excellent SRHS than Hispanic students. The prevalence of fair or poor SRHS was higher among black and Hispanic students than among white students. Comparisons by grade showed the prevalence of excellent SRHS was higher among ninth-grade students than among 10th- and 12th-grade students, and the prevalence of fair or poor SRHS was higher among 12th-grade students than among ninth-grade students.
Table 1.
Prevalence of self-rated health status overall and by sex, race/ethnicity,a and grade: U.S. Youth Risk Behavior Survey, 2007
aData for American Indian/Alaska Native, Asian, Native Hawaiian or other Pacific Islander, and multiple race (non-Hispanic) not shown due to small numbers of students in these subgroups.
bStatistically significant at p<0.05 for differences by sex
cStatistically significant at p<0.05 for the following differences by race/ethnicity: non-Hispanic white vs. non-Hispanic black; non-Hispanic white vs. Hispanic
dStatistically significant at p<0.05 for the following differences by race/ethnicity: non-Hispanic black vs. Hispanic
eStatistically significant at p<0.05 for the following differences by grade: ninth vs. 10th grade
fStatistically significant at p<0.05 for the following differences by grade: ninth vs. 12th grade
CI = confidence interval
Associations between risk behaviors and SRHS by race/ethnicity
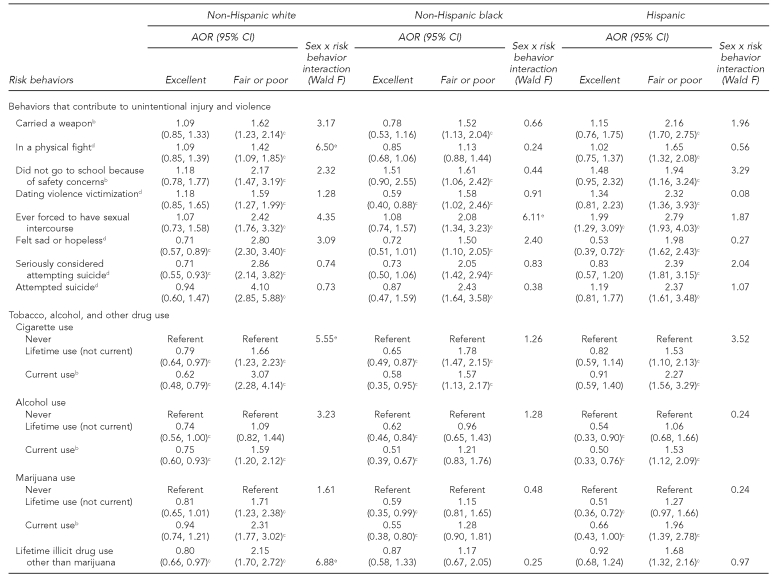
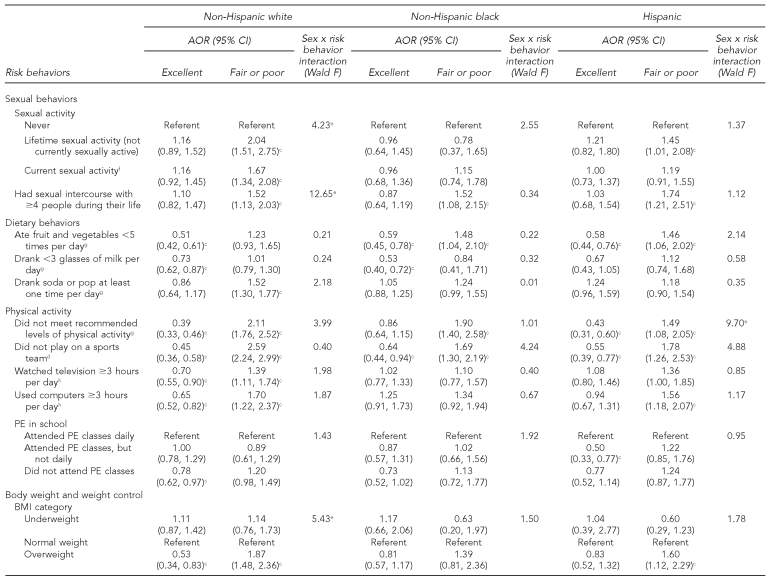
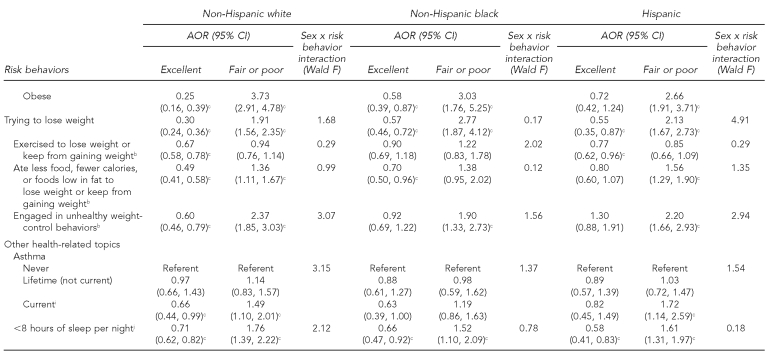
A wide range of risk behaviors was associated with SRHS, though patterns of association differed by race/ethnicity and among behavior categories (Table 2). Among white students, associations were found with SRHS for all 29 risk behaviors; 15 were associated with both excellent and fair or poor SRHS, four were associated with only excellent SRHS, and 10 were associated with only fair or poor SRHS. Among black students, 20 of 29 behaviors were associated with SRHS; seven were associated with excellent and fair or poor SRHS, four were associated with only excellent SRHS, and nine were associated with only fair or poor SRHS. Among Hispanic students, 26 of 29 behaviors were associated with SRHS; nine were associated with excellent and fair or poor SRHS, two were associated with only excellent SRHS, and 15 were associated with only fair or poor SRHS. For every significant association, students who engaged in the risk behavior had lower odds of excellent SRHS and higher odds of fair or poor SRHS as compared with those who did not engage in the risk behavior; the only exception was Hispanic students who had ever been forced to have sexual intercourse—they had higher odds of excellent SRHS than those who had not been forced to have sexual intercourse.
Table 2.
Adjusted odds ratios and 95% CIs for excellent and fair or poor self-rated health status by race/ethnicity:a U.S. Youth Risk Behavior Survey, 2007
aModels adjusted for sex and grade. Referent category is very good or good self-rated health status.
bDuring the 30 days before the survey
cAOR statistically significant at p<0.05
dDuring the 12 months before the survey
eSex × risk behavior interaction term statistically significant at p<0.01
fDuring the three months before the survey
gDuring the seven days before the survey
hOn an average school day
iEver told by a doctor or nurse that they had asthma and still have asthma
jOn an average school night
CI = confidence interval
AOR = adjusted odds ratio
PE = physical education
BMI = body mass index
Looking at the results by behavior category, the pattern of association between behaviors that contribute to unintentional injury and violence and SRHS was similar across racial/ethnic groups. Among all groups, these behaviors were predominantly associated with only fair or poor SRHS.
The relationship between SRHS and the four tobacco, alcohol, and other drug use behaviors differed across racial/ethnic groups. Among white students, three behaviors (cigarette use, alcohol use, and other illicit drug use) were associated with excellent and fair or poor SRHS; marijuana use was associated with only fair or poor SRHS. Among black students, cigarette use was associated with excellent and fair or poor SRHS and alcohol and marijuana use were associated with only excellent SRHS. Among Hispanic students, alcohol and marijuana use were associated with excellent and fair or poor SRHS, and cigarette and other illicit drug use were associated with only fair or poor SRHS.
Among all racial/ethnic groups, sexual risk behaviors were associated with only fair or poor SRHS. The only exception was among black students: sexual intercourse was not associated with SRHS.
Associations between dietary behaviors and SRHS differed across racial/ethnic groups. Among white students, eating fruit and vegetables fewer than five times per day and drinking fewer than three glasses of milk per day were associated with only excellent SRHS, while daily soda consumption was associated with only fair or poor SRHS. Among black students, eating fruit and vegetables fewer than five times per day was associated with excellent and fair or poor SRHS; drinking fewer than three glasses of milk per day was associated only with excellent SRHS. Among Hispanic students, eating fruit and vegetables fewer than five times per day was associated with excellent and fair or poor SRHS.
Associations of physical inactivity behaviors with SRHS differed by race/ethnicity. Among all racial/ethnic groups, not playing on a sports team was associated with excellent and fair or poor SRHS. In addition, among white students, associations with excellent and fair or poor SRHS were found for four of the five physical inactivity behaviors; not attending physical education classes was associated with only excellent SRHS. Among black students, other physical inactivity behaviors were generally not associated with SRHS. Among Hispanic students, associations with SRHS were varied. Not meeting recommended levels of physical activity and participating in physical education classes on a less than daily basis were associated with only excellent SRHS, and using computers for three or more hours per day was associated with only fair or poor SRHS.
Associations between SRHS and body weight and weight-control behaviors also differed by race/ethnicity, though among each racial/ethnic group, trying to lose weight was associated with excellent and fair or poor SRHS. Among white students, associations with excellent and fair or poor SRHS were found for being overweight or obese and for all weight-control behaviors, except exercising to lose weight or to keep from gaining weight, which was associated with only fair or poor SRHS. Among black students, being obese was associated with excellent and fair or poor SRHS, and three of four weight-control behaviors were associated with SRHS, although associations did not follow a clear pattern. Among Hispanic students, being overweight or obese was associated with only fair or poor SRHS. All four weight-control behaviors were associated with SRHS, but did not follow a clear pattern.
Current asthma was associated with excellent and fair or poor SRHS among white students and fair or poor SRHS among Hispanic students. Among all racial/ethnic groups, students who slept fewer than eight hours per night had lower odds of excellent SRHS and higher odds of fair or poor SRHS.
Interactions by sex within racial/ethnic subgroups
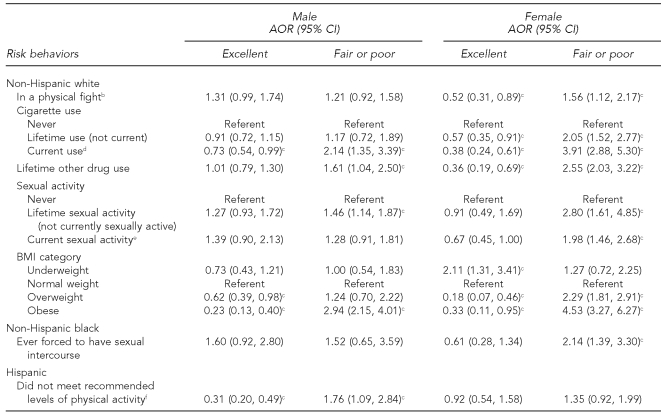
Among white students, associations with SRHS (Table 2) varied by sex for five of 29 risk behaviors. Results stratified by sex (Table 3) showed that, among white female students, these risk behaviors were consistently associated with excellent and fair or poor SRHS, while among white male students, associations with SRHS were less consistent.
Table 3.
Adjusted odds ratios and 95% CIs for excellent and fair or poor self-rated health status by sex and race/ethnicity:a U.S. Youth Risk Behavior Survey, 2007
aOnly those risk behaviors whose association with self-rated health status varied by sex are included in this table. Models are adjusted for grade. Referent is very good or good self-rated health status.
bDuring the 12 months before the survey
cAOR statistically significant at p<0.05
dDuring the 30 days before the survey
eDuring the three months before the survey
fDuring the seven days before the survey
CI = confidence interval
AOR = adjusted odds ratio
BMI = body mass index
Among black and Hispanic students, there was one significant interaction by sex (Table 2). Among black students, forced sexual intercourse was associated with fair or poor SRHS among females, but was not significant among males (Table 3). Among Hispanic students, not meeting recommended levels of physical activity was associated with excellent and fair or poor SRHS among males, but was not significant among females.
DISCUSSION
Overall, most students rated their health as very good or good (69%), while similar percentages of students rated their health as excellent (16%) and fair or poor (15%). SRHS varied by demographic subgroup. As in other U.S. studies,7,8,14,20,21 SRHS was higher among male than among female students. We found that the prevalence of excellent SRHS was highest among black students, followed by white students, and then Hispanic students, while the prevalence of fair or poor SRHS was higher among black and Hispanic students than among white students. Previous studies have not examined racial/ethnic variation in excellent SRHS, although one study found that mean SRHS was higher among black students than among white students, even after controlling for factors such as school achievement, depressed mood, and self-esteem.7 Similar racial/ethnic variations in fair or poor SRHS have been reported among nationally representative samples of adolescents.20,21 We found some differences in SRHS by grade level; previous U.S. studies have had inconsistent findings with regard to differences by grade level or age.7,8,14,20
We found that patterns of association between risk behaviors and SRHS varied by race/ethnicity. Among white students, 15 of 29 risk behaviors examined were associated with both excellent and fair or poor SRHS, while about half as many risk behaviors were associated with excellent and fair or poor SRHS among black (n=7) and Hispanic (n=8) students. This finding suggests that risk behaviors influence both positive and negative health status ratings to a greater extent among white vs. black or Hispanic students, particularly among white female students, for whom associations with both excellent and fair or poor SRHS were more consistent than among white male students. Behaviors that were associated with excellent and fair or poor SRHS among white but not black or Hispanic students included alcohol use, illicit drug use, sedentary behaviors (watching television or using a computer three or more hours per day), and several weight-control behaviors. The reasons for these racial/ethnic differences are unclear. White students may be more aware of the health consequences of these behaviors and benefits of not participating in these behaviors than black and Hispanic students and, therefore, are more likely to consider these behaviors when rating their health. In contrast, when rating their health, black and Hispanic students may give greater weight to factors such as actual or perceived socioeconomic status, child-parent relationships, or school achievement. These factors have been shown to be associated with adolescent SRHS in other studies.8,11,15,22,30
Despite these differences, three behaviors were associated with both excellent and fair or poor SRHS among all racial/ethnic subgroups. Not playing on a sports team, trying to lose weight, and sleeping fewer than eight hours per night were each associated with lower odds of excellent SRHS and higher odds of fair or poor SRHS among white, black, and Hispanic students. Our findings support a previous study showing that not participating in sports and trying to lose weight were associated with both positive and negative health ratings.18 Although the association of insufficient sleep with adolescent SRHS previously has not been studied, insufficient sleep affects academic performance and psychological functioning,31,32 which have been shown to influence adolescent SRHS.7
Additionally, we found that among all racial/ethnic groups, more risk behaviors were associated with fair or poor SRHS than excellent SRHS. The determinants of excellent SRHS among adolescents have been relatively unstudied, but our findings suggest that factors other than risk behaviors contribute to perceptions of excellent health. This assertion may be particularly true among Hispanic students, among whom we found the greatest difference in the number of behaviors associated with fair or poor and excellent SRHS. Risk behaviors associated with only fair or poor SRHS among all racial/ethnic groups predominantly fell into two categories: (1) behaviors leading to unintentional injuries and violence and (2) sexual behaviors. These findings enhance our understanding of the behaviors associated with adolescent SRHS, as few previous studies have included them.
Limitations
Our study was subject to several limitations. First, the data were cross-sectional and, therefore, we could not infer causality. Second, we did not have data on other contextual sociodemographic and personal characteristics that might influence SRHS. Third, SRHS ratings in our study could have been affected by the format and context of the questionnaire; it is unlikely, however, that this would affect associations between risk behaviors and SRHS.1
CONCLUSIONS
Health status perceptions formed during adolescence persist into young adulthood12,13 and may have implications for current and future health-care utilization, morbidity, and mortality,1,3–5,10 underscoring the importance of understanding the factors associated with adolescent SRHS. This study of U.S. high school students provides important information about how categories of behaviors and individual risk behaviors are associated with excellent and fair or poor SRHS, including information about similarities and differences in these associations by race/ethnicity and sex. We found that patterns of associations varied by race/ethnicity, with about twice as many risk behaviors associated with both excellent and fair or poor SRHS among white students compared with black and Hispanic students. These findings suggest that risk behaviors influence subjective ratings of health status to a greater extent among white students than among black or Hispanic students. Black and Hispanic students may give greater weight in their health assessments to factors such as actual or perceived socioeconomic status, child-parent relationships, or school achievement. Additional research that examines how these factors are associated with SRHS, particularly among black and Hispanic students, is needed.
Footnotes
The findings and conclusions in this article are those of the authors and do not necessarily represent the official position of CDC.
REFERENCES
- 1.Davies AR, Ware JE., Jr. Measuring health perceptions in the health insurance experiment. Santa Monica (CA): Rand Corp.; 1981. [Google Scholar]
- 2.Krause NM, Jay GM. What do global self-rated health items measure? Med Care. 1994;32:930–42. doi: 10.1097/00005650-199409000-00004. [DOI] [PubMed] [Google Scholar]
- 3.Idler EL, Benyamini Y. Self-rated health and mortality: a review of twenty-seven community studies. J Health Soc Behav. 1997;38:21–37. [PubMed] [Google Scholar]
- 4.Kaplan GA, Goldberg DE, Everson SA, Cohen RD, Salonen R, Tuomilehto J, et al. Perceived health status and morbidity and mortality: evidence from the Kuopio ischaemic heart disease risk factor study. Int J Epidemiol. 1996;25:259–65. doi: 10.1093/ije/25.2.259. [DOI] [PubMed] [Google Scholar]
- 5.Ferraro KF, Farmer MM, Wybraniec JA. Health trajectories: long-term dynamics among black and white adults. J Health Soc Behav. 1997;38:38–54. [PubMed] [Google Scholar]
- 6.Vingilis E, Wade TJ, Adlaf E. What factors predict student self-rated physical health? J Adolesc. 1998;21:83–97. doi: 10.1006/jado.1997.0131. [DOI] [PubMed] [Google Scholar]
- 7.Mechanic D, Hansell S. Adolescent competence, psychological well-being, and self-assessed physical health. J Health Soc Behav. 1987;28:364–74. [PubMed] [Google Scholar]
- 8.Wade TJ, Pevalin DJ, Vingilis E. Revisiting student self-rated physical health. J Adolesc. 2000;23:785–91. doi: 10.1006/jado.2000.0359. [DOI] [PubMed] [Google Scholar]
- 9.Eaton DK, Kann L, Kinchen S, Shanklin S, Ross J, Hawkins J, et al. Youth risk behavior surveillance—United States, 2007. MMWR Surveill Summ. 2008;57(4):1–131. [PubMed] [Google Scholar]
- 10.Vingilis E, Wade T, Seeley J. Predictors of adolescent health care utilization. J Adolesc. 2007;30:773–800. doi: 10.1016/j.adolescence.2006.10.001. [DOI] [PubMed] [Google Scholar]
- 11.Vingilis ER, Wade TJ, Seeley JS. Predictors of adolescent self-rated health. Analysis of the National Population Health Survey. Can J Public Health. 2002;93:193–7. doi: 10.1007/BF03404999. [DOI] [PMC free article] [PubMed] [Google Scholar]
- 12.Boardman JD. Self-rated health among U.S. adolescents. J Adolesc Health. 2006;38:401–8. doi: 10.1016/j.jadohealth.2005.01.006. [DOI] [PMC free article] [PubMed] [Google Scholar]
- 13.Breidablik HJ, Meland E, Lydersen S. Self-rated health during adolescence: stability and predictors of change (Young-HUNT study, Norway) Eur J Public Health. 2009;19:73–8. doi: 10.1093/eurpub/ckn111. [DOI] [PMC free article] [PubMed] [Google Scholar]
- 14.Johnson PB, Richter L. The relationship between smoking, drinking, and adolescents' self-perceived health and frequency of hospitalization: analyses from the 1997 National Household Survey on Drug Abuse. J Adolesc Health. 2002;30:175–83. doi: 10.1016/s1054-139x(01)00317-2. [DOI] [PubMed] [Google Scholar]
- 15.Wade TJ, Vingilis E. The development of self-rated health during adolescence: an exploration of inter- and intra-cohort effects. Can J Public Health. 1999;90:90–4. doi: 10.1007/BF03404108. [DOI] [PMC free article] [PubMed] [Google Scholar]
- 16.Thorlindsson T, Vilhjalmsson R, Valgeirsson G. Sport participation and perceived health status: a study of adolescents. Soc Sci Med. 1990;31:551–6. doi: 10.1016/0277-9536(90)90090-f. [DOI] [PubMed] [Google Scholar]
- 17.Tremblay S, Dahinten S, Kohen D. Factors related to adolescents' self-perceived health. Health Rep. 2003;14(Suppl):7–16. [PubMed] [Google Scholar]
- 18.Breidablik HJ, Meland E, Lydersen S. Self-rated health in adolescence: a multifactorial composite. Scan J Public Health. 2008;36:12–20. doi: 10.1177/1403494807085306. [DOI] [PubMed] [Google Scholar]
- 19.Pastor Y, Balaguer I, Pons D, Garcia-Merita M. Testing direct and indirect effects of sports participation on perceived health in Spanish adolescents between 15 and 18 years of age. J Adolesc. 2003;26:717–30. doi: 10.1016/j.adolescence.2003.07.001. [DOI] [PubMed] [Google Scholar]
- 20.Swallen KC, Reither EN, Haas SA, Meier AM. Overweight, obesity, and health-related quality of life among adolescents: the National Longitudinal Study of Adolescent Health. Pediatrics. 2005;115:340–7. doi: 10.1542/peds.2004-0678. [DOI] [PubMed] [Google Scholar]
- 21.Boynton-Jarrett R, Ryan LM, Berkman LF, Wright RJ. Cumulative violence exposure and self-rated health: longitudinal study of adolescents in the United States. Pediatrics. 2008;122:961–70. doi: 10.1542/peds.2007-3063. [DOI] [PMC free article] [PubMed] [Google Scholar]
- 22.Piko BF. Self-perceived health among adolescents: the role of gender and psychosocial factors. Eur J Pediatr. 2007;166:701–8. doi: 10.1007/s00431-006-0311-0. [DOI] [PubMed] [Google Scholar]
- 23.Benyamini Y, Leventhal EA, Leventhal H. Elderly people's ratings of the importance of health-related factors to their self-assessments of health. Soc Sci Med. 2003;56:1661–7. doi: 10.1016/s0277-9536(02)00175-2. [DOI] [PubMed] [Google Scholar]
- 24.Shields M, Shooshtari S. Determinants of self-perceived health. Health Rep. 2001;13:35–52. [PubMed] [Google Scholar]
- 25.Shooshtari S, Menec V, Tate R. Comparing predictors of positive and negative self-rated health between younger (25–54) and older (55+) Canadian adults. Res Aging. 2007;29:512–54. [Google Scholar]
- 26.Brener ND, Kann L, McManus T, Kinchen SA, Sundberg EC, Ross JG. Reliability of the 1999 Youth Risk Behavior Survey questionnaire. J Adolesc Health. 2002;31:336–42. doi: 10.1016/s1054-139x(02)00339-7. [DOI] [PubMed] [Google Scholar]
- 27.Brener ND, Kann L, Kinchen SA, Grunbaum JA, Whalen L, Eaton D, et al. Methodology of the youth risk behavior surveillance system. MMWR Recomm Rep. 2004;53(RR-12):1–13. [PubMed] [Google Scholar]
- 28.Kuczmarski RJ, Ogden CL, Grummer-Strawn LM, Flegal KM, Guo SS, Wei R, et al. CDC growth charts: United States. Adv Data. 2000;314:1–27. [PubMed] [Google Scholar]
- 29.Research Triangle Institute, Inc. SUDAAN®: Version 9.0.1 for Windows. Research Triangle Park (NC): Research Triangle Institute, Inc.; 2005. [Google Scholar]
- 30.Goodman E, Huang B, Schafer-Kalkhoff T, Adler NE. Perceived socioeconomic status: a new type of identity that influences adolescents' self-rated health. J Adolesc Health. 2007;41:479–87. doi: 10.1016/j.jadohealth.2007.05.020. [DOI] [PMC free article] [PubMed] [Google Scholar]
- 31.Moore M, Meltzer LJ. The sleepy adolescent: causes and consequences of sleepiness in teens. Paediatric Respir Rev. 2008;9:114–20. doi: 10.1016/j.prrv.2008.01.001. quiz 120-1. [DOI] [PubMed] [Google Scholar]
- 32.Smaldone A, Honig JC, Byrne MW. Sleepless in America: inadequate sleep and relationships to health and well-being of our nation's children. Pediatrics. 2007;119(Suppl 1):S29–37. doi: 10.1542/peds.2006-2089F. [DOI] [PubMed] [Google Scholar]


