

Abstract
Treacher Collins syndrome is an autosomal-dominant mandibulofacial dysostosis caused by haploinsufficiency of the TCOF1 gene product treacle. Mouse Tcof1 protein is approximately 61% identical and 71% similar to treacle, and heterozygous knockout of Tcof1 causes craniofacial malformation. Tcof1 expression is high in developing neural crest, but much lower in other tissues. To investigate this dual regulation, highly conserved regions upstream of TCOF1 homologs were tested through deletion and mutation reporter assays, and conserved predicted transcription factor binding sites were assessed through chromatin binding studies. Assays were performed in mouse P19 embryonic carcinoma cells and in HEK293 cells to determine differential activation in cell types at different stages of differentiation. Binding of Cebpb, Zfp161, and Sp1 transcription factors was specific to the Tcof1 regulatory region in P19 cells. The Zfp161 binding site demonstrated P19 cell–specific repression, while the Sp1/Sp3 candidate site demonstrated HEK293 cell–specific activation. Moreover, presence of c-myb and Zfp161 transcripts was specific to P19 cells. A minimal promoter fragment from −253 to +43 bp directs constitutive expression in both cell types, and dual regulation of Tcof1 appears to be through differential repression of this minimal promoter. The CpG island at the transcription start site remains unmethylated in P19 cells, 11.5 dpc mouse embryonic tissue, and adult mouse ear, which supports constitutive activation of the Tcof1 promoter.
Introduction
Treacher Collins syndrome (TCS) is an autosomal-dominant disorder of craniofacial development with highly variable expressivity. The phenotype is limited to tissues derived from the neural crest, specifically the first and second branchial arch derivatives. TCS is characterized by micrognathia, sometimes with secondary tracheal insufficiency, middle ear ossicle malformation often with conductive hearing loss with or without absence or malformation of the outer ear, hypoplastic zygomatic arches, flattened maxilla, downslanting palpebral fissures with coloboma of the lower eyelid, and sometimes cleft palate. In addition, there is no mental deficiency associated with TCS (OMIM accession no. 154500; Marsh and Dixon, 2000; Marszalek et al., 2002).
The human TCOF1 gene is localized to chromosome 5q32 and consists of 28 exons, some of which are alternatively spliced across and among species, and encodes the nucleolar phosphoprotein treacle (The Treacher Collins Syndrome Collaborative Group, 1996; Dixon et al., 1997a, 2006; Isaac et al., 2000; So et al., 2004; Splendore et al., 2005; Shows et al., 2006). TCS has been associated with several nonsense mutations within the TCOF1 gene, as well as missense mutations within conserved domains of the coding region (Gladwin et al., 1996; Edwards et al., 1997; Wise et al., 1997; Splendore et al., 2000, 2002; Marszalek et al., 2003). Nonsense mutations in TCOF1 likely cause haploinsufficiency of full-length treacle, either through nonsense-mediated mRNA decay (NMD) or through protein truncation that eliminates nuclear and nucleolar localization signals so that the protein is mislocalized (Marsh et al., 1998; Winokur and Shiang, 1998; Frischmeyer et al., 2002). However, TCS families with linkage to the 5q32 locus without mutations in the TCOF1 coding region could have defective expression of TCOF1 that could cause haploinsufficiency of transcript and result in TCS (unpublished data; Splendore et al., 2000). Understanding normal regulation of TCOF1 enables screening for abnormal regulation. Moreover, factors that regulate TCOF1 may contribute to the phenotypic heterogeneity inherent in TCS, including variable expressivity.
The mouse Tcof1 gene is well conserved and has 71.1% similarity at the amino acid level to its human counterpart TCOF1 (Dixon et al., 1997b; Paznekas et al., 1997). Haploinsufficiency of Tcof1 in heterozygous knockout mice causes a TCS-like phenotype, although defects vary from mild to severe depending on the mouse strain, thus modifying factors influence the heterogeneous phenotype (Dixon and Dixon, 2004; Teber et al., 2004). Tcof1 is expressed at high levels ubiquitously until E6, when the high expression becomes tissue-restricted to the developing neural crest, with highest expression at E8.5 as cells begin to migrate (unpublished data; Dixon et al., 1997b, 2000; Paznekas et al., 1997). After E11, expression then decreases and continues unrestricted in various tissues (unpublished data; Dixon et al., 1997b, 2000; Paznekas et al., 1997). Tcof1 is thus regulated both developmentally and tissue specifically in mice.
Tissue-restricted high levels of treacle are likely involved in ribosome biogenesis during survival and/or proliferation of developing neural crest cells to ensure proper development of neural crest-derived structures (Winokur and Shiang, 1998; Dixon et al., 2000, 2006; Hayano et al., 2003; Valdez et al., 2004; Gonzalez et al., 2005). However, low constitutive expression of Tcof1 suggests the necessity for Tcof1 in other tissues under a different regulatory scheme, as evidenced in the embryonic lethal phenotype of Tcof1−/− homozygous knockout mice (Dixon et al., 1997b). Investigation of both high tissue-restricted and low unrestricted expression of Tcof1 will help to elucidate the need for Tcof1 in different tissues. In this study we utilize mouse Tcof1 to investigate regulation, because it models human TCOF1 regulation. Furthermore, Tcof1 and its upstream region show remarkable homology across many different mammal species, so that it can be used to study species-specific effects in vertebrate craniofacial development.
In this paper we identify sequences upstream of Tcof1 that are highly conserved across mammalian species, and then determine the regulatory region and minimal promoter for constitutive expression of Tcof1 through deletion analysis of conserved sequences. We then identify candidate transcription factor binding sites within the regulatory region, and assess the specificity of these sites through mutation analysis and in vivo transcription factor binding studies. We then investigate cell-specific differences in Tcof1 regulation by comparing expression in mouse P19 embryonic carcinoma cells to HEK293 cells, and determine differential expression of candidate transcription factor transcripts in these cell lines. Finally, we investigate the role of CpG dinucleotide methylation in the GC-rich minimal promoter to further support constitutive activation of Tcof1.
Materials and Methods
Bioinformatics of upstream Tcof1 homology
To investigate mammalian sequence conservation of the TCOF1 regulatory region, genomic sequences including several kilobases (kb) upstream of the transcription start site (TSS) for human (GenBank accession no. AY460334), mouse (GenBank accession no. NM_011552), chimpanzee (GenBank accession no. XM_527074), rat (GenBank accession no. AA875103), dog (GenBank accession no. NM_001003057), and rhesus macaque (GenBank accession no. NM_001039952) were compared using the NCBI BLAST BL2seq tool for sequence identities (Dixon et al., 1997a, 1997b; Tatusova and Madden, 1999; Haworth et al., 2001; Kent et al., 2002; Shows et al., 2006).
Reverse transcription PCR of neural crest precursor marker transcripts
To ensure that the P19 cell line contained appropriate marker transcripts, total RNA was extracted from P19 cell pellets using the Trizol method for tissue culture cells as recommended by the manufacturer (Invitrogen, Carlsbad, CA). Total RNA was treated with 20 units of RQ1 DNase in 1× RQ1 buffer to remove DNA contamination as recommended by the manufacturer (Promega, Madison, WI). First strand cDNA was generated using approximately 500 ng DNase-treated total RNA with 5 ng/μL both oligo dT and random primers, and 0.5 mM dNTPs then heated to 65°C for 5 min and quick-cooled on ice; to this was added 1× First-strand buffer, 0.01 M DTT, and 40 units RNase inhibitor (Promega) and incubated at 37°C for 2 min; then to this was added 200 units Moloney-murine leukemia virus reverse transcriptase (M-MLV-RT) and was incubated at 37°C for 50 min with a final incubation at 70°C for 15 min. Transcript-specific primers used in reverse transcription (RT)-PCR are given 5′ to 3′: GAPDH RT-F acttcaacagcgacacccactc and GAPDH RT-R ccctgttgctgtagccaaattc; mAP-2 RT-F caatgagcaagtggcaagaa and mAP-2 RT-R agggcctcggtgagatagtt; mFoxd3 RT-F tcttacatcgcgctcatcac and mFoxd3 RT-R tcttgacgaagcagtcgttg; mMsx1 RT-F ctctcggccatttctcagtc and mMsx1 RT-R tactgcttctggcggaactt; mSlug RT-F gcactgtgatgcccagtcta and mSlug RT-R cagtgagggcaagagaaagg; mSnail1 RT-F cttgtgtctgcacgacctgt and mSnail1 RT-R cttcacatccgagtgggttt; mTwist RT-F ccccactttttgacgaagaa and mTwist RT-R cagtttgatcccagcgtttt; and mWnt-1 RT-F acagcaaccacagtcgtcag and mWnt-1 RT-R gaatccgtcaacaggttcgt. Standard PCR was accomplished in 12.5 μL reactions in 1× PCR buffer (CLP, San Diego, CA), 0.5 mM dNTPs, 3.125 pmol each primer, 0.25 units Taq polymerase (GeneChoice), and 1.5 μL of a 1:10 dilution of cDNA. Cycling conditions were denaturation at 94°C for 2 min; then 22 cycles of 94°C for 30 s, 60°C for 30 s, and 72°C for 30 s; and then extension at 72°C for 7 min.
Cloning of Tcof1 promoter regions
Eighteen clones represent serial deletions of seven highly conserved sequences within the 2.1 kb full-length upstream fragment comprising construct 1C (Fig. 1A). Control plasmids used were pGL3-control encoding the recombinant firefly luciferase gene under control of the strong SV40 promoter; negative control pGL3-basic, containing no promoter; and pCMV-βgal, containing the bacterial β-galactosidase gene under control of the strong CMV promoter (Promega). Cloning of the upstream region −1751 to +1000 bp of Tcof1 was accomplished using restriction endonuclease digestion by KpnI and XhoI of the previously cloned mouse genomic Tcof1 (clone pm7c2HSI), to generate a 2.8 kb fragment that was inserted into the pBluescript II/SK+(pBSSK+) vector (Stratagene, La Jolla, CA). After sequence verification, part of the upstream region in pBSSK+ was then released with KpnI and NheI and inserted into the pGL3-basic vector (Promega) to create clone 1A. Clone 1C was created by inserting a 2.8 kb upstream fragment from KpnI to NcoI into pGL3-basic. The clone 1B was created by inserting the KpnI to SmaI fragment from 1C into pGL3-basic. The full-length clone 1C was then digested with various restriction endonucleases, and fragments were blunt-end subcloned into SmaI-digested and dephosphorylated pGL3-basic: for clone 2B NdeI/SmaI digestion with Klenow fill-in of the 5′ end; for clone 3B SspI/SmaI digestion; for clone 4B HincII/SmaI digestion; for clone 5B SfoI/SmaI digestion; and for clone 6B PvuII/SmaI digestion (New England Biolabs, Ipswich, MA) (Fig. 1A). For clones 4A, 5A, and 6A fragments were released with NheI digestion and inserted into the NheI site of pGL3-basic; for clones 2A and 3A fragments were released with SpeI and NcoI to replace a 520 bp fragment with the 458 bp SpeI to NcoI fragment from 1A (New England Biolabs). Clones 2C, 3C, 4C, 5C, and 6C were created by digestion with KpnI and SmaI to replace the KpnI to SmaI fragment in 1C. Digest products were separated through 0.8% agarose in 1× TAE for gel extraction with Freeze N’ Squeeze columns (Bio-Rad, Hercules, CA). Ligations were performed using 200 units of T4 DNA ligase (New England Biolabs) in 1× ligation buffer (50 mM Tris, pH 7.5; 10 mM MgCl2; 5% PEG 8000; 1 mM ATP; 1 mM DTT), with approximately 20 ng vector and approximately 50 ng insert, and incubated overnight at 16°C or for 1 h at room temperature. After sequence verification of the entire insert, plasmid DNA was purified using the Qiagen Qiafilter midi-prep kit as recommended by the manufacturer (Valencia, CA).
FIG. 1.
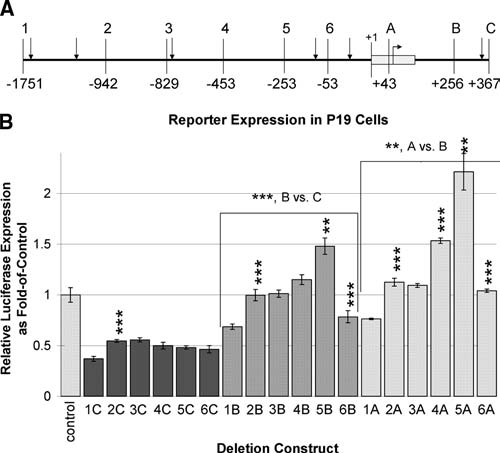
Deletion analysis of the mouse Tcof1 regulatory region. Deletions from the 5′ and 3′ ends of the regulatory region show different effects on expression of the reporter gene luciferase in vitro. (A) Schematic representation of the inserts used in deletion clones is shown. Six different 5′ ends are labeled 1–6, while three different 3′ ends are labeled a, b, and c, and position relative to the TSS (+1) is indicated below. Fragments were inserted into pGL3-basic, and are named using the combination of the numbered 5′ end and the lettered 3′ end. Corresponding restriction sites are 1, KpnI; 2, NdeI; 3, SspI; 4, HincII; 5, HaeII; 6, PvuII; a, NheI; b, SmaI; and c, NcoI. Vertical arrows indicate peaks of areas of conservation among vertebrates. A bent arrow indicates the initiator ATG codon, and the gray box indicates exon 1. (B) Transient transfection luciferase expression analysis of deletion clones in P19 mouse embryonic carcinoma cells. Transfections were performed in triplicate and are shown as a fold-of-control value with standard deviations. Comparisons of results are pairwise, with each construct compared to the immediate longer construct to assess specific effects of deletion. Bracketed groups assess significance of 3′ deletions by comparing pairwise 5′ deletions within the group and testing significance of the group. Significance of comparisons is determined using the appropriate Student's t-test with *p < 0.01, **p < 0.005, or ***p < 0.001.
Tissue culture and transient transfection
Mouse P19 cells were grown in Modified Eagle's Medium (MEM-α) supplemented with 7.5% bovine calf serum, 2.5% fetal bovine serum (FBS), and 50 μg/mL gentamicin (Invitrogen). Cells were passaged once at approximately 50–65% confluency, then plated for transfections at a density of 1 × 10⁴ cells per well in a six-well plate. Cloned reporter plasmids were transiently transfected in triplicate into P19 cells using Lipofectamine 2000 reagent (Invitrogen) following the manufacturer's protocol. Cells were cotransfected with pCMV-β-gal in order to assess transfection efficiency and normalize data points. Transfection medium was replaced after 4 h with incubation at 37°C in 5% CO2. Transfections were incubated for 24 h prior to cell lysis.
Expression analysis
Cells were lysed in Tropix 1× reporter lysis buffer and assayed using the Promega Luciferase Assay System and the Tropix Galacto-Star system (Applied Biosystems, Foster City, CA) as recommended by the manufacturer. Assays were read in a Wallac Victor2 1420 Multilabel Counter plate reader (PerkinElmer, Waltham, MA). The ratio of luciferase to β-gal expression was calculated for each well and normalized by the ratio of luciferase to β-gal expression for pGL3-basic. Each normalized ratio was divided by the normalized pGL3-control ratio to achieve the fold-of-control value, and standard deviations were calculated for each triplicate mean. Means were compared for significance using a two-tailed paired or non-paired homoscedastic or heteroscedastic Student's t-test, where appropriate.
Identification of candidate transcription factor binding sites
Regions of homology were then examined for putative transcription factor binding sites using the Transcription Element String Search (TESS) program, which uses the TRANSFAC database (Schug, 2003). Sites identical and near-identical in all species in sequence and approximate distance from the TSS were selected for further study, including from 5′ to 3′ LVa, Ikaros-1, c-myb, CCAAT, Zfp161, Sp1/Sp3, and AP2α putative binding sites (Fig. 2).
FIG. 2.

Conserved putative transcription factor binding sites within the Tcof1 regulatory region. Consensus sites for conserved predicted transcription factor binding sites are given on the top row, with species names in the left column. Consensus binding site direction is shown as forward (+) or reverse (−) relative to the Tcof1 open reading frame. Nonconsensus nucleotides are in lower case and bold type, while consensus nucleotides are in upper case. The position indicated at the bottom is for the mouse Tcof1 sequence.
Mutation of candidate transcription factor binding sites
Mutations of putative binding sites in the Tcof1 promoter were generated using the oligonucleotide-directed GeneEditor II mutagenesis system (Promega) as recommended by the manufacturer. Mutation oligos are given in Table 1. Restriction positive clones were sequence verified to contain the mutation. Mutation clones were transfected, and expression was analyzed exactly as above.
Table 1.
Site-Directed Mutation Oligonucleotides
| |
Oligo sequence |
|
|---|---|---|
| Candidate trans-factor | Consensus sequence | Restriction site used for screening |
| c-myb | CGCGTGCTAGCCCAtggGTTTGCTTTGTTTCTCa | NcoI |
| CGCGTGCTAGCCCAACTGTTTGCTTTGTTTCTC | ||
| CCAAT | GACACGCCTTGGAGCCtATaGCAGAGCTAGTTAG | SfcI |
| GACACGCCTTGGAGCCAATGGCAGAGCTAGTTAG | ||
| Zfp161 | CCCAGCGTGCCatatGGCCCGGTGACGCG | NdeI |
| CCCAGCGTGCCGCGCGGCCCGGTGACGCG | ||
| Sp1 | GAGCAGTAGCCCGCTCCCagtCCGGGAGACCTGGC | SmaIb |
| GAGCAGTAGCCCGCTCCCCTCCCGGGAGACCTGGC | ||
| AP2α | GACTTATAGCCACTTCCtgaGGCTCAGTTTCCCCATG | c |
| GACTTATAGCCACTTCCCAGGGCTCAGTTTCCCCATG |
The oligonucleotide sequence is shown with the wildtype sequence underneath for comparison. The conserved cis-binding site is shown in bold type, with the nucleotide changes in lowercase and underlined.
Sequence is specific to the plasmid with insert.
Site is present in wildtype sequence.
Mutation was identified through sequencing.
Differential expression of Tcof1 promoter constructs
To investigate differential expression between cell types, deletion and mutation assays were performed in HEK293 cells that were grown in Dulbecco's modified Eagle's medium supplemented with 10% FBS and 1% penicillin/streptomycin (Invitrogen). Cells were passaged twice at approximately 85–90% confluency, then plated for transfections at a density of 1 × 10⁶ cells per well in a six-well plate. Cloned reporter plasmids were transiently transfected in triplicate into HEK293 cells exactly as above for P19 cells. Transfections were incubated at 37°C in 5% CO2 for 48 h prior to cell lysis. Expression was analyzed exactly as above for P19 cells.
Differential expression of candidate transcription factor transcripts
To determine differential transcription of candidate transcription factors, semi-quantitative RT-PCR of candidate transcripts was performed and primers are given 5′ to 3′: GAPDH RT F/GAPDH RT R; mAP-2 RT-F/mAP-2 RT-R; Cebpa RT-F ttacaacaggccaggtttcc and Cebpa RT-R ctctgggatggatcgattgt; Cebpb RT-F caagctgagcgacgagtaca and Cebpb RT-R cagctgctccaccttcttct; Cebpd RT-F atcgctgcagcttcctatgt and Cebpd RT-R agtcatgctttcccgtgttc; Cebpz RT-F atccttctgtggcccttttt and Cebpz RT-R ttgggttgcatcacaacact; c-myb RT-F gctgaagaagctggtggaac and c-myb RT-R caacgcttcggaccatattt; Zfp161 RT-F agctcaggggagcttttgtt and Zfp161 RT-R caggggcaagccagatataa; Ik-1 RT-F cacaacgagatggcagaaga and Ik-1 RT-R cccaggtagttgatggcatt; and Sp1 RT-F agcgaccaagatcactccat and Sp1 RT-R tgggtgactcaattctgctg. Transcripts were isolated and cDNA was synthesized as above. Standard PCR was accomplished as above.
Chromatin immunoprecipitation
P19 cells were maintained as above until 50–60% confluency, and then scraped into cold 1× PBS diluted to approximately 500 cells per 1 mL. Native protein–chromatin complexes were cross-linked in 1% formaldehyde for 17 min at room temperature, and then the reaction was quenched using 0.125 M glycine. Cell lysis and immunoprecipitation (IP) was then performed according to the manufacturer's recommendations (Santa Cruz Biotechnologies, Santa Cruz, CA) using EDTA-free protease inhibitor cocktail (Roche, Indianapolis, IN). Samples were sonicated to fragment chromatin using a Heat Systems Ultrasonics Cell Disruptor W-220F (Misonix, Farmingdale, NY) set at output 1, with 10 rounds of 15 × 1-s pulses at 30-s intervals on ice. Protein concentration of supernatant was determined by modified protein assay (Bio-Rad), and approximately 500 μg total protein was used per IP. Chromatin samples were pre-cleared with 50 μL Protein A/G PLUS-Agarose (Santa Cruz Biotechnologies). Either 1.5 or 3 μg antibody [AP-2α (3B5), c-myb (H-141), Sp1 (PEP 2), Sp3 (D-20), C/EBPβ (H-7), or ZNF161 (ZNF5J141) (Santa Cruz)] or no antibody control was used for IP. Free chromatin was extracted using phenol–chloroform procedure and quantitated using Picogreen (Molecular Probes [Invitrogen]) reagent as recommended by the manufacturer.
Primers upstream of mouse Tcof1 TSS surrounding the conserved c-myb binding site are 5′ to 3′ mChIP c-myb F (ctgctgtctttggggct) and mChIP c-myb R (tatgtttggatcgcgcct); surrounding the CCAAT binding site are ChIP mC/EBPb F (atgaatactcggaagc) and ChIP mC/EBPb R (ccacgaaggctaacta); and surrounding the Zfp161 site and CpG island are MTcof1 Met 1F (actccagctgcaagactacac) and MTcof1 Met 1R (cgctctgctcctttacttcc). Primers surrounding the Sp1/Sp3 and AP2α conserved sites are mChIP Sp1/3 F (cgggaagtaaaggagcagag) and mChIP Sp1/3 R (cgggaattacaaagctgcac). PCR was accomplished as described previously, with annealing temperature of 55°C, 56°C, and 60°C, respectively, for 40 cycles of amplification.
MethylScreen analysis of GC-rich promoter region
The MethylScreen assay was adapted for use in the mouse Tcof1 gene (Holemon et al., 2007). Primers MTcof1 Met 1F and MTcof1 Met 1R (given above) amplify the 252 bp predicted CpG island surrounding the TSS and encompassing 6 HhaI sites and 15 McrBC sites. Genomic DNA was extracted from P19 cell pellets or from mouse tissue using the Wizard Genomic DNA purification kit according to the manufacturer's recommendations (Promega). Control methylated DNA was generated by subjecting P19 genomic DNA to methylation by HhaI methylase or SssI methylase according to the manufacturer's recommendations (New England Biolabs). Both control methylated and untreated P19 and mouse tissue genomic DNA samples were then subjected to digestion using: (1) methyl-sensitive HhaI, (2) methyl-dependent McrBC, (3) both HhaI and McrBC, or (4) glycerol only. PCR of digest products was accomplished as above with annealing temperature at 56°C for 30 cycles. Patterns of amplification were compared for differences.
Results
Identification of conserved regions upstream of Tcof1
The upstream region of mouse Tcof1 is homologous to the human TCOF1 upstream region, especially in small (20–200 bp) nearly identical (80–100% identity) segments. There are four main areas conserved between mouse and human, specifically the proximal upstream region at approximately +1 bp to −1 kb and enhancer-like regions farther upstream at approximately –3, –4.5, and –6.5 kb. These regions are located at least 50 kb from the closest known transcript found upstream of Tcof1 (Kent et al., 2002). Small regions of near exact homology were identified surrounding peaks of conservation at the TSS and at +350 bp in intron 1, and then at approximately −25, −70, −800, −1100, and −1700 bp upstream of the TSS, as indicated by vertical arrows in Figure 1A. We chose to investigate the proximal 2 kb region because of the high degree of homology among different species.
Determination of Tcof1 promoter regulatory regions in P19 cells
Mouse P19 embryonic carcinoma cells are developmentally pluripotent, derived from a 7.5 dpc embryo, with the potential to differentiate into all three germ layers, including neuroectoderm from which the neural crest arises (McBurney, 1993). As mentioned previously, Tcof1 is expressed at very high unrestricted levels in early mouse embryo, and also at high levels in P19 cells (Mogass et al., 2004). To ensure that the P19 cell line is appropriate for this study, we confirmed expression of AP2α, Foxd3, Msx1, Slug, Snail1, Twist, and Wnt-1 genes that are involved in early neuroectoderm and neural crest cell survival using RT-PCR analysis (Borchers et al., 2001). We were able to readily detect these marker transcripts using mRNA-specific primers; thus, the P19 cell line remains undifferentiated with pluripotency (data not shown).
Several deletion clones were constructed to specifically test highly conserved near-identical sequences upstream of Tcof1 that were identified through BLAST analysis, and deletions from the 5′ and 3′ ends of a 2.1 kb upstream region are represented schematically in Figure 1A. Results from transient transfections in P19 cells are shown in Figure 1B. Comparisons are pairwise, with each construct compared to the immediate longer construct to assess specific effects of deletion. Comparisons are significant at p < 0.001 unless otherwise noted, and most significant (p < 0.001) results are given in Table 2.
Table 2.
Summary of Results for Analysis of the Mouse Tcof1 Regulatory Region
| |
|
P19 cells |
HEK293 cells |
||
|---|---|---|---|---|---|
| Deletion | Conserved site | Construct | Element | Construct | Element |
| Nonspecific | |||||
| −1751 to −942 | Unknown | 2A, 2B, 2C | R | 2A, 2C | R |
| +256 to +367 | AP2α | 1B to 6B | R | 1B to 6B | R |
| P19 specific | |||||
| −829 to −453 | Ik-1 | 4A | R | — | N |
| −253 to −53 | CCAAT | 6A | A | 6C | R |
| Mutation | Zfp161 | 5B*Zfp161 | R | — | N |
| HEK293 specific | |||||
| −453 to −253 | c-myb | 5B | N | 5C | A |
| +43 to +256 | Sp1/Sp3 | — | N | 1A to 6A | R |
| Mutation | Sp1/Sp3 | — | N | 1C*Sp1/Sp3 | A |
Regions are depicted as containing an activator (A), repressor (R), or no effect (N) element. Results are significant at the p < 0.001 level as assessed by the appropriate Student's t-test.
Deletion of −1751 to −942 bp consistently shows an increase in expression (2C vs. 1C, 2B vs. 1B, and 2A vs. 1A), demonstrating that this region encompasses a repressor. Deletion of −829 to −453 bp shows an increase in expression with the +43 bp end (4A vs. 3A), and further deletion from −453 to −253 bp also shows an increase in expression with +256 and +43 bp ends (5B vs. 4B, 5A vs. 4A, p < 0.005), suggesting that there are repressor elements that are context dependent. Deletion of the region from +43 to +256 bp that includes exon 1 and part of intron 1 increases expression (A vs. B, p < 0.005), suggesting a repressor element within the deleted region. Deletion of the intronic region from +256 to +367 bp significantly increases expression (B vs. C), which demonstrates a repressor element within the intron. In contrast, deletion of −253 to −53 bp significantly decreases expression (6B vs. 5B, 6A vs. 5A), demonstrating that the deleted fragment contains the activator element.
In summary, the region that confers greatest expression is the minimal promoter of Tcof1 from −253 to +43 bp, or construct 5A. Multiple upstream and intronic sequences then confer repression on this minimal promoter as shown by the increase in expression due to deletion of regions −1751 to −942 bp (2), −829 to −453 bp (4), −453 to −253 bp (5), +43 to +256 bp (B), and +256 to +367 bp (C).
Identification of candidate transcription factor binding sites
Using the TESS website, we further investigated the highly conserved region upstream of TCOF1 to identify putative transcription factor binding sites. Mammalian (i.e., mouse, rat, dog, rhesus macaque, chimpanzee, and human) homologs of TCOF1-2 kb upstream sequence contain five upstream and two intronic candidate transcription factor binding sites that coincide with highly conserved regions utilized in the deletion analysis with 70–100% identity, although the positions of the sites vary slightly among species (Dixon et al., 1997a, 1997b; Haworth et al., 2001; Schug, 2003; Shows et al., 2006). Other predicted cis-regulatory sites were identified within the −2 kb sequence, although they are not conserved across all species, which suggests that species-specific regulation of TCOF1 may account for species-specific differences in craniofacial skeletons.
The consensus and sequences of the seven highly conserved sites are shown in Figure 2, with positions shown below for the mouse sequence. The consensus site at −847 bp is predicted to bind an uncharacterized nuclear factor that activates the LVa promoter element in Moloney-Murine Leukemia Virus (M-MLV) and Walleye Dermal Sarcoma Virus (WDSV) and coincides with the peak of high conservation seen at −800 bp upstream of the TSS (Speck and Baltimore, 1987; Hronek et al., 2004). The consensus site at −732 bp is in reverse orientation and is predicted to bind Ikaros factor (Ik-1), a six-finger zinc-binding protein important for hematopoiesis in mice (O'Neill et al., 2000; Lopez et al., 2002). The consensus site at −454 bp is predicted to bind c-myb factor, a leucine-zipper oncoprotein required in the neuroectoderm to mesenchyme transition to form migrating neural crest cells in chicken, as well as in maxilla and palate development at approximately E12.5 in mouse (Ness, 2003; Mukhopadhyay et al., 2004; Karafiat et al., 2005). The consensus site at −117 bp is a CCAAT box predicted to bind the activator CCAAT binding factor (mCBF or Cebpζ), although many proteins also bind to the CCAAT core with reduced affinity, including CCAAT/enhancer-binding protein (Cebp) isoforms α, β, and δ (Ramji and Foka, 2002). The CCAAT box coincides with the peak of conservation surrounding −70 bp upstream of the TSS. The consensus site at −29 bp is predicted to bind Zfp161, a zinc-finger protein that is both an activator and a repressor that binds to GC-rich sequences and coincides with the peak of conservation at −25 bp upstream of the TSS (Numoto et al., 1999). The reverse consensus site at +245 bp in intron 1 is predicted to bind the activator Sp1 and/or the repressor Sp3, homologous factors required in early embryo development (Lania et al., 1997). The consensus site at +344 bp is predicted to bind AP2α, another early embryonic factor shown to be required for neural crest cell fate determination in Xenopus, and coincides with the peak of conservation at +350 bp downstream of the TSS within intron 1 (Luo et al., 2003).
Functions of cis-regulatory sites in Tcof1 upstream region
Site-directed mutagenesis was performed on the putative c-myb, CCAAT, Zfp161, Sp1/Sp3, and AP2α candidate binding sites to test the function of these highly conserved sequences in proximity to the TSS. Testing of the Zfp161 site was especially important because it could not be tested by deletion analysis. The consensus binding sites were mutated to obliterate binding and to create restriction endonuclease sites for screening of clones (Table 1). The wildtype constructs 4B (containing c-myb, CCAAT, and Zfp161 candidate sites), 5B (containing CCAAT and Zfp161 candidate sites), and 1C (full-length containing Sp1/Sp3 and AP2α candidate sites) were used as templates for mutations, and transfection results in P19 cells are shown in Figure 3. Comparisons are pairwise, with each mutated construct compared to the equivalent wildtype construct. Significance of comparisons is at the level of p < 0.001 unless otherwise noted. A summary of the most significant (p < 0.001) results is given in Table 2.
FIG. 3.
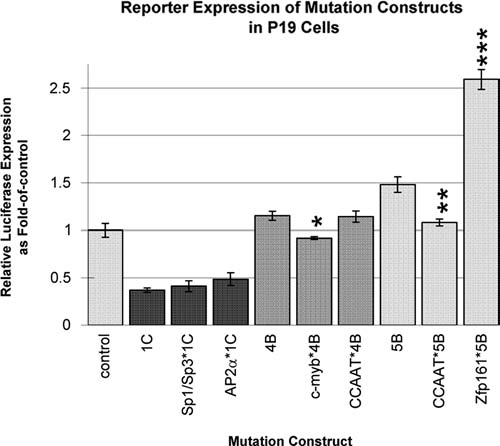
Specificity of conserved putative transcription factor binding sites within the mouse Tcof1 regulatory region. Site-directed mutation of candidate sites was performed, and constructs were transiently transfected into the P19 mouse embryonic carcinoma cell line. The site mutated is indicated with an asterisk followed by the name of the clone used as template. Transfections were performed in triplicate, and results are shown as a fold-of-control value with standard deviations. Comparisons of results are pairwise, with each mutated construct compared to the wildtype template. Significance of comparisons is determined using the appropriate Student's t-test with *p < 0.01, **p < 0.005, or ***p < 0.001.
The mutation of the Zfp161 site (Zfp161*5B vs. 5B) yields a significant increase in expression, demonstrating that this site participates directly in repression of the Tcof1 gene. Mutation of the CCAAT site on the 5B template (CCAAT*5B vs. 5B, p < 0.005) shows a decrease in expression; however, the same CCAAT mutation on the 4B template shows no change in expression, suggesting that the CCAAT site may be a cis-activator in a context-dependent manner. Mutation of the c-myb site (c-myb*4B vs. 4B, p < 0.01) shows a slight decrease in expression, suggesting that it may be a cis-activator.
Determination of Tcof1 promoter regulatory regions in HEK293 cells
The HEK293 human embryonic kidney–transformed cell line was used as a control cell line to test for differential expression, since the Tcof1 promoter is known to function at low levels constitutively in differentiated cells. Deletion constructs are the same as used for P19 cells. Comparison results for transfections of deletion constructs in HEK293 cells are shown in Figure 4A, and most significant (p < 0.001) results are summarized in Table 2. Results are significant at p < 0.001 unless otherwise noted.
FIG. 4.
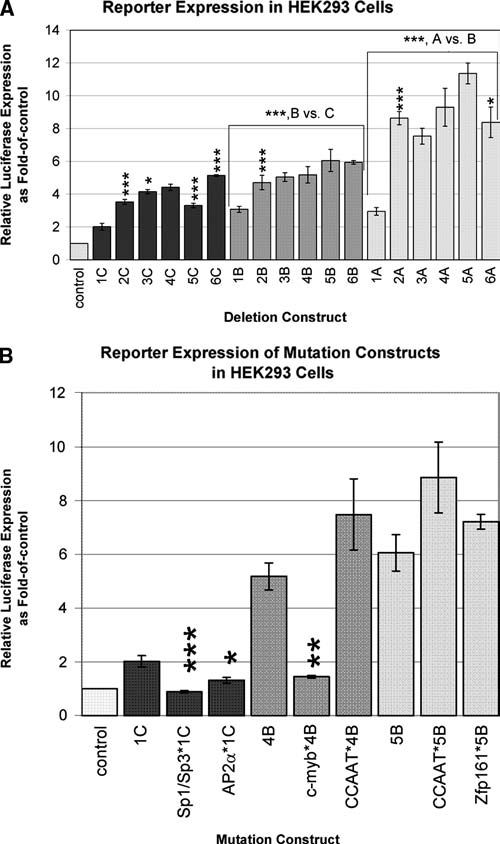
Analysis of cell-specific regulation of Tcof1. (A) Transient transfection luciferase expression analysis of deletion clones in HEK293 human embryonic kidney transformed cells. Deletion clone constructs are the same as for P19 cells as in Figure 1A, and results are reported as in Figure 1B. (B) Transient transfection luciferase expression analysis of site-directed mutation clones in HEK293 cells. Clone constructs are the same as for P19 cells, and results are reported as in Figure 3.
Deletion of −1751 to −942 bp shows an increase in expression compared to the full-length construct (2C vs. 1C, 2B vs. 1B, and 2A vs. 1A in Fig. 4A) as in P19 cells, suggesting that this repressor element is not cell specific. Deletion of −942 to −829 bp with the +367 bp end shows a slight increase not seen in P19 cells (3C vs. 2C, p < 0.01), suggesting a repressor element that is cell specific and context dependent. Deletion of the region from −829 to −453 bp shows no difference in expression unlike in P19 cells, so that this repressor element is specific to P19 cells. Deletion of the region −453 to −253 bp with the +367 bp end shows a decrease in expression (5C vs. 4C) that is opposite to the increase in P19 cells, so that this region contains an activator specific to HEK293 cells and/or a repressor specific to P19 cells. Deletion of the −253 to −53 bp region causes a significant increase in expression with the +367 bp end that is opposite the decrease seen in P19 cells (6C vs. 5C), suggesting that the repressor may be specific to P19 cells; however, with the +43 bp end, deletion of this region causes a slight decrease in expression as seen in P19 cells (6A vs. 5A, p < 0.01), so that this region shows context-dependent effects in HEK293 cells. Deletion of the region from +43 to +256 bp containing exon 1 and part of intron 1 (A vs. B) and deletion of +256 to +367 bp (B vs. C) increase expression like in P19 cells, demonstrating that these fragments contain repressors that are not cell specific.
In summary, the construct showing highest expression in HEK293 cells is the −253 to +43 bp construct 5A as in P19 cells, although it is not significantly different from its immediate longer construct. This supports that expression is constitutive in different cell types. Thus, multiple upstream and intronic repressors have also been demonstrated in HEK293 cells as shown by an increase in expression due to deletion of the regions −1751 to −942 bp (2), +256 to +367 bp (C), and +43 to +256 bp (B) that are not cell specific, and −942 to −829 bp (3) and −253 to −53 bp (6) that are specific to HEK293 cells. This demonstrates differential repression of constitutive activation between cell types.
To further demonstrate cell-specific effects, mutated constructs were also tested in the HEK293 cell line as shown in Figure 4B with most significant comparison results (p < 0.001) summarized in Table 2. Significance is at the level of p < 0.001 unless otherwise noted. Site-directed mutations in Sp1/Sp3 (Sp1/Sp3*1C vs. 1C) and AP2α (AP2α*1Cvs. 1C, p < 0.01) each shows decreased expression unlike in P19 cells, suggesting that these elements are activators in HEK293 cells. This is in contrast to the repressive effect due to deletions of the regions +43 to +256 bp (B) and +256 to +367 bp (C), suggesting that there may be unknown repressors within this region. Mutation of the c-myb site (c-myb*4B vs. 4B, p < 0.005) shows a decrease in expression, demonstrating that it is an activator of Tcof1 as in P19 cells. This result is unexpected because there was no change due to deletion of the −453 to −253 bp region surrounding the c-myb site in HEK293 cells. Mutation of the CCAAT site shows no difference in expression unlike in P19 cells. This is expected considering that expression does not change when the CCAAT-containing region −253 to −53 bp is deleted in HEK293 cells. Mutation of the Zfp161 site does not show a significant change in expression unlike in P19 cells. Thus, the negative regulatory effect of the Zfp161 site appears to be restricted to P19 cells.
Cell-specific transcription of candidate transcription factors
To determine whether candidate binding factors may affect cell-specific expression of constructs, semi-quantitative RT-PCR was used to determine the presence of their transcripts in both P19 and HEK293 cell lines (Fig. 5A and B, respectively) because antibodies were not available for all factors to determine protein levels. Transcript-specific primers for candidates Cebpα, Cebpβ, Cebpδ, Cebpζ, c-myb, Ik-1, Zfp161, Sp1, and AP2α are specific for both human and mouse homologous regions of the genes. In P19 cells, transcripts are readily detectable except for Cebpα, Cebpδ, and Ik-1 (Fig. 5A). In HEK293 cells, transcripts are readily detectable except for Cebpα, Cebpδ, c-myb, Ik-1, and Zfp161 (Fig. 5B). Thus, c-myb and Zfp161 each show cell-specific transcription in P19 cells, but not in HEK293 cells.
FIG. 5.
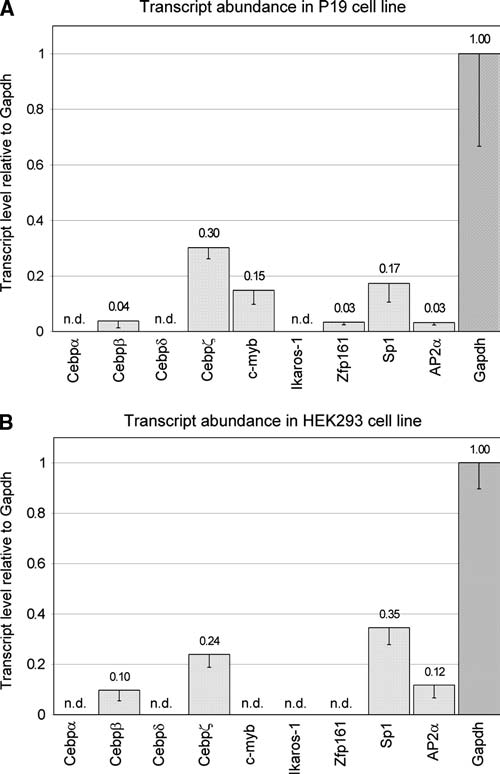
Presence of candidate transcription factor transcripts in cell lines. Semi-quantitative reverse transcription PCR analysis of candidate transcription factors was performed in triplicate, and transcript level was determined as a ratio of GAPDH transcript level at 22 cycles of PCR. Values are given with standard deviations for (A) P19 cells and (B) HEK293 cells. Transcripts not detectable after 40 cycles of PCR are denoted as n.d.
Specific in vivo binding of candidate transcription factors in P19 cells
Candidate transcription factors for which antibodies were commercially available (c-myb, Cebpb, Zfp161, Sp1, Sp3, and AP2α) were tested for binding specificity using chromatin immunoprecipitation (ChIP), and results are shown in Figure 6. Visualization of chromatin shearing demonstrated a range of average size of about 300–400 bp fragments (data not shown). Western blot verified presence of these proteins in the P19 cell line (data not shown). Chromatin enrichment above background was seen for primer set mChIP c-myb F/R surrounding the c-myb binding site using anti-Cebpb, anti-Zfp161, and anti-Sp1 ChIP (Fig. 6, top) and for primer set ChIP mC/EBPb F/R surrounding the CCAAT binding site using anti-Zfp161 and anti-Sp3 ChIP (Fig. 6, middle). No chromatin enrichment was seen for any ChIP with primer sets MTcof1 Met 1F/1R encompassing the CpG island and TSS (Fig. 6, bottom), or mChIP Sp1/3 F/R encompassing exon 1 and intron 1 (data not shown). Thus, Cebpb, Zfp161, Sp1, and Sp3 factors are associated with chromatin upstream of the TSS surrounding the c-myb and CCAAT binding sites, but not at their predicted binding sites.
FIG. 6.

Chromatin enrichment of Tcof1 regulatory region. PCR of enriched chromatin was performed using immunoprecipitated chromatin samples for (1) no antibody background control, (2) input chromatin positive control, (3) anti-c-myb, (4) anti-Cebpb, (5) anti-Zfp161, (6) anti-Sp1, (7) anti-Sp3, (8) anti-AP2α, and (9) water only. Marker (M) shows 200 and 300 bp (and 400 bp in middle row) bands. Amplification shown was performed using a primer set surrounding the (top) c-myb candidate binding site with a product size of 219 bp, (middle) CCAAT candidate binding site with a product size of 222 bp, and (bottom) Zfp161 candidate site with a product size of 252 bp.
Mouse Tcof1 promoter is not occupied by methylated cytosine residues
To support constitutive activation of the Tcof1 promoter, we performed a modified MethylScreen assay for methylated cytosine residues within the predicted CpG island at the TSS of Tcof1, and results are given in Figure 7. Absence of PCR product indicates complete digestion, while, conversely, presence of PCR product indicates incomplete digestion. In P19 cells, E11.5 mouse total embryo, and adult mouse ear, untreated genomic DNA demonstrates complete digestion with HhaI and HhaI/McrBC digests, and incomplete digestion with McrBC and glycerol only. Control methylated P19 genomic DNA demonstrated predicted but opposite results: incomplete digestion with HhaI and glycerol only, and complete digestion with McrBC and HhaI/McrBC. Presence of PCR product for HhaI-methylated DNA digested with McrBC indicates incomplete methylation of template, as has been noted for HhaI methylase previously (New England Biolabs). Thus, the mouse Tcof1 CpG island within the promoter is not methylated in P19 cells, E11.5 embryos, or adult mice.
FIG. 7.
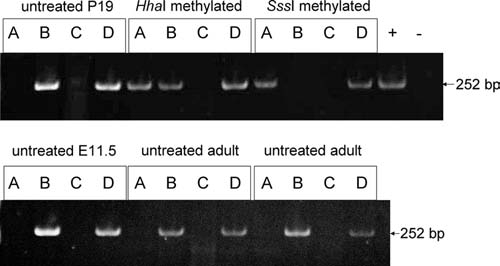
MethylScreen analysis. PCR product is shown at 252 bp for six different genomic DNA samples: untreated P19 cell, HhaI methylated P19 cell, SssI methylated P19 cell, untreated E11.5 mouse whole embryo, and two untreated adult mouse ear punch samples. Genomic DNA was subjected to each of four restriction digest reactions: (A) HhaI methylation-sensitive restriction endonuclease, (B) McrBC methylation-dependent restriction endonuclease, (C) both HhaI and McrBC enzymes, and (D) glycerol only. Positive control template (+) for PCR is untreated P19 cell DNA not subjected to restriction digestion, and negative control template (−) for PCR is water only.
Discussion
The Zfp161 site is a tissue-specific repressor of Tcof1 expression
Mutation of the Zfp161 site greatly increases expression above all other constructs in P19 cells, which demonstrates highest-level activation of the promoter by abolishing repression through this site. Tcof1 displays high-level expression in the early embryo, so that repression through the Zfp161 site implies a necessity for tight control of Tcof1 expression in development. Binding of Zfp161 factor to the Tcof1 regulatory region and transcription of Zfp161 in P19 cells both support the role of Zfp161 repression on the Tcof1 promoter in the early embryo. However, Zfp161 does not bind to its predicted site, so perhaps introducing adenine–thymine pairs by mutation changes the melting characteristics of the CpG island to alter the integrity of the TSS and further upregulate activation of this promoter.
On the other hand, activation or repression by Zfp161, a POK (poxvirus and zinc finger, Krüppel-like) transcription factor, is context dependent and binding affinity can be changed through dimerization with self or other Krüppel-like zinc finger proteins (Numoto et al., 1993; Kaplan and Calame, 1997; Obata et al., 1999; Wang et al., 2005). In fact, Zfp161 associates with chromatin surrounding the c-myb and CCAAT candidate sites, suggesting that Zfp161 may either work indirectly in regulation of Tcof1, or bind its own site weakly because of protein–protein interactions with other Krüppel-like factors binding the c-myb or CCAAT sites. ChIP experiments are unlikely to detect weakly binding transcription factors, so Zfp161 could still bind weakly to its site, but be detected as binding at another site as a heterodimer. Zfp161 could then bind its own site strongly in the absence of other factors, but in P19 cells heterodimerization weakens binding to its site. In P19 cells elimination of binding through mutation of the Zfp161 site in the presence of Zfp161 allows a significant increase in expression, whereas in HEK293 cells mutation causes no change in expression in the absence of Zfp161, which supports the participation of weak Zfp161 binding to its site in repression of Tcof1 in P19 cells. However, since Zfp161 is not present in HEK293 cells, Tcof1 is repressed in a different manner in this cell line.
Zfp161 is localized to subnuclear domains, and is expressed in various adult tissues (Numoto et al., 1993; Sugiura et al., 1997). It is unknown if Zfp161 is expressed in developing neural crest, although in E10.5 mouse it is expressed in the core of branchial arches one and two, overlapping Tcof1 expression at this time point (unpublished data; Dixon et al., 1997b, 2000; Paznekas et al., 1997; Gray et al., 2004). Ectopic expression of Zfp161 has been shown to suppress proliferation in mouse cell lines, causing a slow-growth phenotype (Kaplan and Calame, 1997). Zfp161 may then be required to attenuate expression of Tcof1 to control proliferation through weak binding as the neural crest expands.
The CCAAT site is a tissue-specific activator of Tcof1 expression
The minimal promoter of mouse Tcof1 is shown to be a 296 bp fragment from −253 to +43 bp that contains the conserved CCAAT and Zfp161 putative binding sites. The human TCOF1 upstream region also demonstrates an approximate 300 bp minimal promoter consisting of the conserved CCAAT and ZF5 (the human homolog of Zfp161) sites that complements our result (Masotti et al., 2005). In addition, the minimal promoter region encompasses a predicted CpG island that remains unmethylated in P19 cells, E11.5 mouse embryo, and adult mouse ear, thus contributing to constitutive expression.
Within the minimal promoter, the sequence surrounding the putative CCAAT binding site is involved in cell-specific activation of Tcof1, in that elimination of this region causes a significant decrease in expression in P19 cells but not in HEK293 cells (6B vs. 5B and 6A vs. 5A, Figs. 1B and 4A). Site-directed mutation of the CCAAT site results in an expected decrease in expression in P19 cells that also supports CCAAT as an activation site (CCAAT*5B vs. 5B, Fig. 3). Previous microarray analyses identified the CCAAT binding factor Cebpζ (also known as Cebpa-rs1) as coordinately transcribed with Tcof1 so that Cebpζ is upregulated in Tcof1 overexpressing and downregulated in Tcof1 knocked-down N1E-110 neuroblastoma cell lines, suggesting that Tcof1 and Cebpζ are involved in the same or similar pathways and may be regulated similarly (GEO accession no. GDS998; Mogass et al., 2004). Cebpζ is known to be expressed in mouse embryos and various adult tissues like Tcof1 (Hoeppner et al., 1996).
Interestingly, CCAAT-binding factors can participate in coordinate tissue-specific regulation when the CCAAT element is proximal to a c-myb regulatory element as in the Tcof1 upstream region, so that specific combinations of Cebp factors interacting with c-myb could account for cell-specific differences in CCAAT-directed activation (Ramji and Foka, 2002). In fact, Cebpβ is shown in this study to associate with chromatin surrounding the c-myb candidate site; however, we were unable to assess Cebpζ binding because there was no antibody available.
The c-myb element may be a tissue-specific activator of Tcof1
Site-directed mutation of the c-myb site results in a decrease in expression in the HEK293 cell line, suggesting that the c-myb site is an activator (c-myb*5B, Fig. 4B). However, c-myb transcripts are not present in HEK293 cells, so it is likely that a factor other than c-myb is responsible for this activity, such as another myb factor (Ness, 2003).
Deletion of the −453 to −253 bp region surrounding the conserved c-myb site demonstrates a repressor effect in P19 cells (5A vs. 4A, 5B vs. 4B in Fig. 1B); however, mutation of the c-myb site shows no effect. So, the c-myb element itself is not directly involved in repression in P19 cells, but another element within the deleted region causes cell-specific repression. For example, within this region in mouse and rat (but not human, chimp, or rhesus macaque) is a stretch of thymidine residues predicted to bind paired homeobox transcription factor Pax1, a factor known to be involved in cartilage development (Lefebvre and Smits, 2005). In human and chimpanzee (but not rhesus macaque) there is a predicted YY1 binding site in the same position, and a polymorphism near this YY1 binding site is associated with lower expression of reporter gene in human cell culture (Masotti et al., 2005). Furthermore, YY1 participates in neuroectoderm differentiation to migratory neural crest cells through regulation of slug in Xenopus (Morgan et al., 2004).
Unknown elements are general repressors of Tcof1 expression
Deletion of the upstream region −829 to −453 bp that contains the conserved Ik-1 predicted binding site shows P19 cell–specific repression in the 4A construct only (3A vs. 4A, Fig. 1B). However, the Ik-1 transcript is absent from both cell lines, so another cis- or trans-regulator in this region acts in a cell-specific manner. Furthermore, the Ik-1 site was not tested by site-directed mutation, so it is not known whether the conserved site itself participates in repression but with a different binding factor.
Deletion of the upstream region −1751 to −942 bp shows repression in both cell types, although there was no conserved predicted binding site within this region. However, this deletion fragment does contain two of the peaks of conservation at −1100 and −1700 bp, suggesting that these peaks may contain novel cis-repressors upstream of the TSS. Further study is required to identify specific cis- and trans-regulatory elements that act in this region.
In conclusion, differential regulation of Tcof1 through repression of constitutive activation appears to maintain a tightly regulated level of Tcof1 in the early embryo that is necessary for proper craniofacial development in the mouse, as well as maintain low-level expression in other tissues. Highly conserved sequences within the upstream region contribute to maintenance of repression, while a 296 bp fragment that includes highly conserved CCAAT and Zfp161 binding sites is responsible for high constitutive activation. So then tissue-specific differences in expression of Tcof1 are a result of lesser or greater repression governed through regions upstream of the minimal promoter with tissue-specific effects. While results in this study are primarily in vitro and limited to two cell lines, we feel that these results will be the basis for many future studies of Tcof1 regulation, including investigating the basis of constitutive activation of the minimal promoter in vivo.
Acknowledgments
The authors thank Joyce Lloyd, Ph.D., for advice on study design and manuscript preparation, and Aarti Jani for technical assistance. K.H.S. is supported by an NIH/NIDCR NRSA award, F32-DE017065. R.S. is supported by an NIH grant, R01-DE13172.
References
- Borchers A. David R. Wedlich D. Xenopus cadherin-11 restrains cranial neural crest migration and influences neural crest specification. Development. 2001;128:3049–3060. doi: 10.1242/dev.128.16.3049. [DOI] [PubMed] [Google Scholar]
- Dixon J. Dixon M.J. Genetic background has a major effect on the penetrance and severity of craniofacial defects in mice heterozygous for the gene encoding the nucleolar protein Treacle. Dev Dyn. 2004;229:907–914. doi: 10.1002/dvdy.20004. [DOI] [PubMed] [Google Scholar]
- Dixon J. Edwards S.J. Anderson I. Brass A. Scambler P.J. Dixon M.J. Identification of the complete coding sequence and genomic organization of the Treacher Collins syndrome gene. Genome Res. 1997a;7:223–234. doi: 10.1101/gr.7.3.223. [DOI] [PubMed] [Google Scholar]
- Dixon J. Hovanes K. Shiang R. Dixon M.J. Sequence analysis, identification of evolutionary conserved motifs and expression analysis of murine tcof1 provide further evidence for a potential function for the gene and its human homologue, TCOF1. Hum Mol Genet. 1997b;6:727–737. doi: 10.1093/hmg/6.5.727. [DOI] [PubMed] [Google Scholar]
- Dixon J. Brakebusch C. Fassler R. Dixon M.J. Increased levels of apoptosis in the prefusion neural folds underlie the craniofacial disorder, Treacher Collins syndrome. Hum Mol Genet. 2000;9:1473–1480. doi: 10.1093/hmg/9.10.1473. [DOI] [PubMed] [Google Scholar]
- Dixon J. Jones N.C. Sandell L.L. Jayasinghe S.M. Crane J. Rey J.P. Dixon M.J. Trainor P.A. Tcof1/Treacle is required for neural crest cell formation and proliferation deficiencies that cause craniofacial abnormalities. Proc Natl Acad Sci USA. 2006;103:13403–13408. doi: 10.1073/pnas.0603730103. [DOI] [PMC free article] [PubMed] [Google Scholar]
- Edwards S.J. Gladwin A.J. Dixon M.J. The mutational spectrum in Treacher Collins syndrome reveals a predominance of mutations that create a premature-termination codon. Am J Hum Genet. 1997;60:515–524. [PMC free article] [PubMed] [Google Scholar]
- Frischmeyer P.A. van Hoof A. O'Donnell K. Guerrerio A.L. Parker R. Dietz H.C. An mRNA surveillance mechanism that eliminates transcripts lacking termination codons. Science. 2002;295:2258–2261. doi: 10.1126/science.1067338. [DOI] [PubMed] [Google Scholar]
- Gladwin A.J. Dixon J. Loftus S.K. Edwards S. Wasmuth J.J. Hennekam R.C. Dixon M.J. Treacher Collins syndrome may result from insertions, deletions or splicing mutations, which introduce a termination codon into the gene. Hum Mol Genet. 1996;5:1533–1538. doi: 10.1093/hmg/5.10.1533. [DOI] [PubMed] [Google Scholar]
- Gonzalez B. Henning D. So R.B. Dixon J. Dixon M.J. Valdez B.C. The Treacher Collins syndrome (TCOF1) gene product is involved in pre-rRNA methylation. Hum Mol Genet. 2005;14:2035–2043. doi: 10.1093/hmg/ddi208. [DOI] [PubMed] [Google Scholar]
- Gray P.A. Fu H. Luo P. Zhao Q. Yu J. Ferrari A., et al. Mouse brain organization revealed through direct genome-scale TF expression analysis. Science. 2004;306:2255–2257. doi: 10.1126/science.1104935. [DOI] [PubMed] [Google Scholar]
- Haworth K.E. Islam I. Breen M. Putt W. Makrinou E. Binns M. Hopkinson D. Edwards Y. Canine TCOF1; cloning, chromosome assignment and genetic analysis in dogs with different head types. Mamm Genome. 2001;12:622–629. doi: 10.1007/s00335-001-3011-0. [DOI] [PubMed] [Google Scholar]
- Hayano T. Yanagida M. Yamauchi Y. Shinkawa T. Isobe T. Takahashi N. Proteomic analysis of human Nop56p-associated pre-ribosomal ribonucleoprotein complexes. Possible link between Nop56p and the nucleolar protein treacle responsible for Treacher Collins syndrome. J Biol Chem. 2003;278:34309–34319. doi: 10.1074/jbc.M304304200. [DOI] [PubMed] [Google Scholar]
- Hoeppner M.A. Gilbert D.J. Copeland N.G. Jenkins N.A. Linzer D.I. Wu B. Cloning and characterization of mouse CCAAT binding factor. Nucleic Acids Res. 1996;24:1091–1098. doi: 10.1093/nar/24.6.1091. [DOI] [PMC free article] [PubMed] [Google Scholar]
- Holemon H. Korshunova Y. Ordway J.M. Bedell J.A. Citek R.W. Lakey N. Leon J. Finney M. McPherson J.D. Jeddeloh J.A. MethylScreen: DNA methylation density monitoring using quantitative PCR. Biotechniques. 2007;43:683–693. doi: 10.2144/000112597. [DOI] [PubMed] [Google Scholar]
- Hronek B.W. Meagher A. Rovnak J. Quackenbush S.L. Identification and characterization of cis-acting elements residing in the walleye dermal sarcoma virus promoter. J Virol. 2004;78:7590–7601. doi: 10.1128/JVI.78.14.7590-7601.2004. [DOI] [PMC free article] [PubMed] [Google Scholar]
- Isaac C. Marsh K.L. Paznekas W.A. Dixon J. Dixon M.J. Jabs E.W. Meier U.T. Characterization of the nucleolar gene product, treacle, in Treacher Collins syndrome. Mol Biol Cell. 2000;11:3061–3071. doi: 10.1091/mbc.11.9.3061. [DOI] [PMC free article] [PubMed] [Google Scholar]
- Kaplan J. Calame K. The ZiN/POZ domain of ZF5 is required for both transcriptional activation and repression. Nucleic Acids Res. 1997;25:1108–1116. doi: 10.1093/nar/25.6.1108. [DOI] [PMC free article] [PubMed] [Google Scholar]
- Karafiat V. Dvorakova M. Krejci E. Kralova J. Pajer P. Snajdr P. Mandikova S. Bartunek P. Grim M. Dvorak M. Transcription factor c-myb is involved in the regulation of the epithelial-mesenchymal transition in the avian neural crest. Cell Mol Life Sci. 2005;62:2516–2525. doi: 10.1007/s00018-005-5297-7. [DOI] [PMC free article] [PubMed] [Google Scholar]
- Kent W.J. Sugnet C.W. Furey T.S. Roskin K.M. Pringle T.H. Zahler A.M. Haussler D. The Human Genome Browser at UCSC. Genome Res. 2002;12:996–1006. doi: 10.1101/gr.229102. [DOI] [PMC free article] [PubMed] [Google Scholar]
- Lania L. Majello B. de Luca P. Transcriptional regulation by the Sp family proteins. Int J Biochem Cell Biol. 1997;29:1313–1323. doi: 10.1016/s1357-2725(97)00094-0. [DOI] [PubMed] [Google Scholar]
- Lefebvre V. Smits P. Transcriptional control of chondrocyte fate and differentiation. Birth Defects Res C Embryo Today. 2005;75:200–212. doi: 10.1002/bdrc.20048. [DOI] [PubMed] [Google Scholar]
- Lopez R.A. Schoetz S. DeAngelis K. O'Neill D. Bank A. Multiple hematopoietic defects and delayed globin switching in Ikaros null mice. Proc Natl Acad Sci USA. 2002;99:602–607. doi: 10.1073/pnas.022412699. [DOI] [PMC free article] [PubMed] [Google Scholar]
- Luo T. Lee Y.H. Saint-Jeannet J.P. Sargent T.D. Induction of neural crest in Xenopus by transcription factor AP2alpha. Proc Natl Acad Sci USA. 2003;100:532–537. doi: 10.1073/pnas.0237226100. [DOI] [PMC free article] [PubMed] [Google Scholar]
- Marsh K.L. Dixon M.J. Treacher Collins syndrome. Adv Otorhinolaryngol. 2000;56:53–59. doi: 10.1159/000059083. [DOI] [PubMed] [Google Scholar]
- Marsh K.L. Dixon J. Dixon M.J. Mutations in the Treacher Collins syndrome gene lead to mislocalization of the nucleolar protein treacle. Hum Mol Genet. 1998;7:1795–1800. doi: 10.1093/hmg/7.11.1795. [DOI] [PubMed] [Google Scholar]
- Marszalek B. Wojcicki P. Kobus K. Trzeciak W.H. Clinical features, treatment and genetic background of Treacher Collins syndrome. J Appl Genet. 2002;43:223–233. [PubMed] [Google Scholar]
- Marszalek B. Wisniewski S.A. Wojcicki P. Kobus K. Trzeciak W.H. Novel mutation in the 5′ splice site of exon 4 of the TCOF1 gene in the patient with Treacher Collins syndrome. Am J Med Genet. 2003;123:169–171. doi: 10.1002/ajmg.a.20312. [DOI] [PubMed] [Google Scholar]
- Masotti C. Armelin-Correa L.M. Splendore A. Lin C.J. Barbosa A. Sogayar M.C. Passos-Bueno M.R. A functional SNP in the promoter region of TCOF1 is associated with reduced gene expression and YY1 DNA-protein interaction. Gene. 2005;359:44–52. doi: 10.1016/j.gene.2005.06.004. [DOI] [PubMed] [Google Scholar]
- McBurney M.W. P19 embryonal carcinoma cells. Int J Dev Biol. 1993;37:135–140. [PubMed] [Google Scholar]
- Mogass M. York T.P. Li L. Rujirabanjerd S. Shiang R. Genomewide analysis of gene expression associated with Tcof1 in mouse neuroblastoma. Biochem Biophys Res Commun. 2004;325:124–132. doi: 10.1016/j.bbrc.2004.10.004. [DOI] [PubMed] [Google Scholar]
- Morgan M.J. Woltering J.M. In der Rieden P.M. Durston A.J. Thiery J.P. YY1 regulates the neural crest-associated slug gene in Xenopus laevis. J Biol Chem. 2004;279:46826–46834. doi: 10.1074/jbc.M406140200. [DOI] [PubMed] [Google Scholar]
- Mukhopadhyay P. Greene R.M. Zacharias W. Weinrich M.C. Singh S. Young W.W. Pisano M.M. Developmental gene expression profiling of mammalian, fetal orofacial tissue. Birth Defects Res (Part A) 2004;70:912–926. doi: 10.1002/bdra.20095. [DOI] [PubMed] [Google Scholar]
- Ness S.A. Myb protein specificity: evidence of a context-specific transcription factor code. Blood Cells Molecules Disease. 2003;31:192–200. doi: 10.1016/s1079-9796(03)00151-7. [DOI] [PubMed] [Google Scholar]
- Numoto M. Niwa O. Kaplan J. Wong K. Merrell K. Kamiya K. Yanagihara K. Calame K. Transcriptional repressor ZF5 identifies a new conserved domain in zinc finger proteins. Nucleic Acids Res. 1993;21:3767–3775. doi: 10.1093/nar/21.16.3767. [DOI] [PMC free article] [PubMed] [Google Scholar]
- Numoto M. Yokoro K. Koshi J. ZF5, which is a Kruppel-type transcriptional repressor, requires the zinc finger domain for self-association. Biochem Biophys Res Commun. 1999;256:573–578. doi: 10.1006/bbrc.1999.0375. [DOI] [PubMed] [Google Scholar]
- Obata T. Yanagidani A. Yokoro K. Numoto M. Yamamoto S. Analysis of the consensus binding sequence and the DNA-binding domain of ZF5. Biochem Biophys Res Commun. 1999;255:528–534. doi: 10.1006/bbrc.1998.9970. [DOI] [PubMed] [Google Scholar]
- O'Neill D.W. Schoetz S.S. Lopez R.A. Castle M. Rabinowitz L. Shor E. Krawchuk D. Goll M.G. Renz M. Seelig H.P. Han S. Seong R.H. Park S.D. Agalioti T. Munshi N. Thanos D. Erdjument-Bromage H. Tempst P. Bank A. An ikaros-containing chromatin-remodeling complex in adult-type erythroid cells. Mol Cell Biol. 2000;20:7572–7582. doi: 10.1128/mcb.20.20.7572-7582.2000. [DOI] [PMC free article] [PubMed] [Google Scholar]
- Paznekas W.A. Zhang N. Gridley T. Jabs E.W. Mouse TCOF1 is expressed widely, has motifs conserved in nucleolar phosphoproteins, and maps to chromosome 18. Biochem Biophys Res Commun. 1997;238:1–6. doi: 10.1006/bbrc.1997.7229. [DOI] [PubMed] [Google Scholar]
- Ramji D.P. Foka P. CCAAT/enhancer-binding proteins: structure, function, and regulation. Biochem J. 2002;365:561–575. doi: 10.1042/BJ20020508. [DOI] [PMC free article] [PubMed] [Google Scholar]
- Schug J. Using TESS to predict transcription factor binding sites in DNA sequence. In: Baxevanis A.D., editor. In Current Protocols in Bioinformatics. John Wiley & Sons; New York: 2003. pp. 2.6.1–2.6.15. [DOI] [PubMed] [Google Scholar]
- Shows K.H. Ward C. Summers L. Li L. Ziegler G.R. Hendrickx A.G. Shiang R. Reduced TCOF1 mRNA level in a rhesus macaque with Treacher Collins-like syndrome: further evidence for haploinsufficiency of treacle as the cause of disease. Mamm Genome. 2006;17:168–177. doi: 10.1007/s00335-005-0079-y. [DOI] [PubMed] [Google Scholar]
- So R.B. Gonzalez B. Henning D. Dixon J. Dixon M.J. Valdez B.C. Another face of the Treacher Collins syndrome (TCOF1) gene: identification of additional exons. Gene. 2004;328:49–57. doi: 10.1016/j.gene.2003.11.027. [DOI] [PubMed] [Google Scholar]
- Speck N.A. Baltimore D. Six distinct nuclear factors interact with the 75-base-pair repeat of the Moloney murine leukemia virus enhancer. Mol Cell Biol. 1987;7:1101–1110. doi: 10.1128/mcb.7.3.1101. [DOI] [PMC free article] [PubMed] [Google Scholar]
- Splendore A. Silva E.O. Alonso L.G. Richieri-Costa A. Alonso N. Rosa A. Carakushanky G. Cavalcanti D.P. Brunoni D. Passos-Bueno M.R. High mutation detection rate in TCOF1 among Treacher Collins syndrome patients reveals clustering of mutations and 16 novel pathogenic changes. Hum Mutat. 2000;16:315–322. doi: 10.1002/1098-1004(200010)16:4<315::AID-HUMU4>3.0.CO;2-H. [DOI] [PubMed] [Google Scholar]
- Splendore A. Jabs E.W. Passos-Bueno M.R. Screening of TCOF1 in patients from different populations: confirmation of mutational hot spots and identification of a novel missense mutation that suggests an important functional domain in the protein treacle. J Med Genet. 2002;39:493–495. doi: 10.1136/jmg.39.7.493. [DOI] [PMC free article] [PubMed] [Google Scholar]
- Splendore A. Fanganiello R.D. Masotti C. Morganti L.S. Passos-Bueno M.R. TCOF1 mutation database: novel mutation in the alternatively spliced exon 6A and update in mutation nomenclature. Hum Mutat. 2005;25:429–434. doi: 10.1002/humu.20159. [DOI] [PubMed] [Google Scholar]
- Sugiura K. Muro Y. Nagai Y. Kamimoto T. Wakabayashi T. Ohashi M. Hagiwara M. Expression cloning and intracellular localization of a human ZF5 homologue. Biochim Biophys Acta. 1997;1352:23–26. doi: 10.1016/s0167-4781(97)00045-6. [DOI] [PubMed] [Google Scholar]
- Tatusova T.A. Madden T.L. Blast 2 sequences—a new tool for comparing protein and nucleotide sequences. FEMS Microbiol Lett. 1999;174:247–250. doi: 10.1111/j.1574-6968.1999.tb13575.x. [DOI] [PubMed] [Google Scholar]
- Teber O.A. Gillessen-Kaesbach G. Fischer S. Bohringer S. Albrecht B. Albert A. Arslan-Kirchner M. Haan E. Hagedorn-Greiwe M. Hammans C. Henn W. Hinkel G.K. Konig R. Kunstmann E. Kunze J. Neumann L.M. Prott E.C. Rauch A. Rott H.D. Seidel H. Spranger S. Sprengel M. Zoll B. Lohmann D.R. Wieczorek D. Genotyping in 46 patients with tentative diagnosis of Treacher Collins syndrome revealed unexpected phenotypic variation. Eur J Hum Genet. 2004;12:879–890. doi: 10.1038/sj.ejhg.5201260. [DOI] [PubMed] [Google Scholar]
- The Treacher Collins Syndrome Collaborative Group. Positional cloning of a gene involved in the pathogenesis of Treacher Collins syndrome. Nat Genet. 1996;12:130–136. doi: 10.1038/ng0296-130. [DOI] [PubMed] [Google Scholar]
- Valdez B.C. Henning D. So R.B. Dixon J. Dixon M.J. The Treacher Collins syndrome (TCOF1) gene product is involved in ribosomal DNA gene transcription by interacting with upstream binding factor. Proc Natl Acad Sci USA. 2004;101:10709–10714. doi: 10.1073/pnas.0402492101. [DOI] [PMC free article] [PubMed] [Google Scholar]
- Wang J. Kudoh J. Takayanagi A. Shimizu N. Novel human BTB/POZ domain-containing zinc finger protein ZNF295 is directly associated with ZFP161. Biochem Biophys Res Commun. 2005;327:615–627. doi: 10.1016/j.bbrc.2004.12.048. [DOI] [PubMed] [Google Scholar]
- Winokur S.T. Shiang R. The Treacher Collins syndrome (TCOF1) gene product, treacle, is targeted to the nucleolus by signals in its C-terminus. Hum Mol Genet. 1998;7:1947–1952. doi: 10.1093/hmg/7.12.1947. [DOI] [PubMed] [Google Scholar]
- Wise C.A. Chiang L.C. Paznekas W.A. Sharma M. Musy M.M. Ashley J.A. Lovett M. Jabs E.W. TCOF1 gene encodes a putative nucleolar phosphoprotein that exhibits mutations in Treacher Collins syndrome throughout its coding region. Proc Natl Acad Sci USA. 1997;94:3110–3115. doi: 10.1073/pnas.94.7.3110. [DOI] [PMC free article] [PubMed] [Google Scholar]