Abstract
Moxifloxacin is under development for expanded use against Mycobacterium tuberculosis. Rifampin is a mainstay of therapy. We examined the interaction of moxifloxacin plus rifampin for log-phase and nonreplicating persister (NRP) organisms. For this evaluation, we employed our hollow-fiber infection model, in which organisms are exposed to clinically relevant drug concentration-time profiles and the impact on bacterial cell kill and resistant subpopulation amplification is determined. In log phase, resistance emergence was observed in all monotherapy regimens and in no combination therapy regimen. No difference was seen in time to a 3-log reduction in the bacterial burden; there was a significant difference in time to resistance emergence (P = 0.0006). In the NRP experiment, no resistance emergence was seen. There was a significant difference between the monotherapy and combination therapy regimens in time to a 3-log reduction in the bacterial burden (P = 0.042). The combination is efficacious for suppressing resistant organisms but is antagonistic for cell kill.
IMPORTANCE
M. tuberculosis infects one-third of the world’s population. Multiresistant organisms have become more frequent, threatening our ability to provide adequate chemotherapy. Moxifloxacin has been seen as an important new agent with the potential to supplant isoniazid or add to the rifampin/isoniazid combination. M. tuberculosis also exists in different physiological states, including the nonreplicating persister phenotype. We examined the moxifloxacin/rifampin combination in a new in vitro system to allow judgment of how moxifloxacin would interact with rifampin and allow its performance in clinical trials to be placed into perspective. Importantly, the combination suppressed resistance emergence, but at the price of slightly slowing bacterial cell kill. This new combination is a welcome addition to the physician’s armamentarium.
Moxifloxacin is under development for first-line therapy of tuberculosis (TB) due to Mycobacterium tuberculosis with the hope that it may significantly shorten treatment duration. Currently, it is recommended for therapy of multidrug-resistant (MDR) TB.
Therapy for TB involves multiple drugs administered for prolonged periods. Standard therapy is for 6 months, while therapy for MDR and extremely drug-resistant TB can exceed 18 months. Multidrug TB therapy exists for two reasons. The primary reason is suppression of emergence of resistance. The secondary reason is to improve the rate and extent of M. tuberculosis cell kill, with the goal of being able to shorten the duration of therapy.
An example of resistance suppression was successfully demonstrated about 5 decades ago with the combination of isoniazid plus para-aminosalicylic acid (1). An example of increasing the rate of cell kill was seen with the addition of pyrazinamide to the standard TB induction regimen. Here, the rate of culture negativity significantly increased when pyrazinamide was added to the induction regimen.
Investigators at Johns Hopkins University have indicated that the standard combination of isoniazid plus rifampin, the base regimen for susceptible M. tuberculosis, may be antagonistic with respect to cell kill (2–4). Moxifloxacin, a fluoroquinolone, tends to be able to penetrate human cells well, making it a good match for rifampin in terms of being available both extra- and intracellularly, has a reasonable rate of kill as determined in EBA studies, and has a safety profile that makes it an attractive candidate for combination therapy with rifampin.
It was the intent of this set of experiments to examine rifampin and moxifloxacin alone and in combination. We examined this combination for M. tuberculosis H37Ra in log-phase growth but also in Wayne-Hayes level II anaerobiosis in our hollow-fiber infection model (HFIM).
RESULTS
Organism rifampin and moxifloxacin MICs and mutation frequencies.
The rifampin MIC (aerobic) was 0.06 mg/liter. The M. tuberculosis mutation frequency in response to 2.0 mg/liter rifampin was 1.20 × 10⁻⁷. This was also determined aerobically.
For moxifloxacin, the MIC (aerobic) was 0.25 mg/liter and the frequency of mutation to resistance in response to 1.5 mg/liter could not be determined (zero colonies found on plates).
Cell kill and resistance emergence in a rifampin/moxifloxacin log-phase experiment.
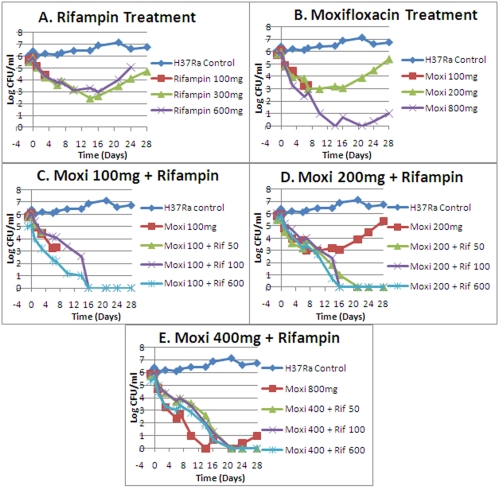
The cell kill over 28 days for all regimens is shown in Fig. 1A to E. Three arms were terminated early due to fungal contamination (rifampin at 100 mg/day [QD], moxifloxacin at 100 mg QD, and moxifloxacin plus rifampin at 100 and 50 mg QD). One regimen was terminated at day 24 (rifampin at 600 mg QD).
FIG 1 .
Effects of moxifloxacin alone and in combination on log-phase M. tuberculosis H37Ra. Panels: A, rifampin treatment; B, moxifloxacin treatment; C, 100 mg moxifloxacin in combination with three rifampin regimens; D, 200 mg moxifloxacin in combination with three rifampin regimens; E, 400 mg moxifloxacin in combination with three moxifloxacin regimens. Drug administrations were done once daily.
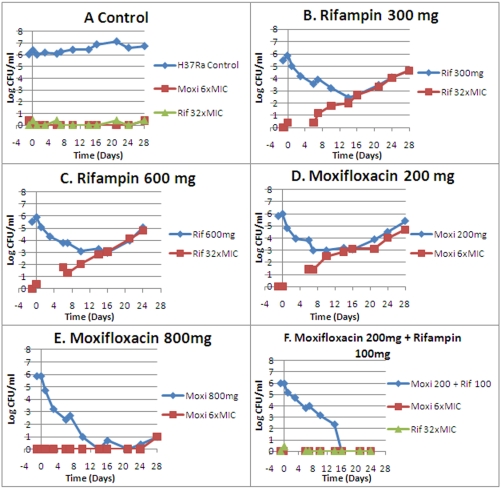
All monotherapy arms had resistance emergence during the period of observation, although with moxifloxacin at 800 mg QD, resistance occurred only after day 21 and by day 24. With none of the combination therapy arms was any resistance emergence seen. Monotherapy resistance emergence is displayed in Fig. 2. The lowest-exposure combination therapy regimen is shown as a negative outcome for resistance emergence.
FIG 2 .
Emergence of resistance during drug administration. Panels: A, control; B, 300 mg rifampin QD; C, 600 mg rifampin QD; D, 200 mg moxifloxacin QD; E, 800 mg moxifloxacin QD; F, 200 mg moxifloxacin QD plus 100 mg rifampin QD.
The nominal concentration-time profiles for all of the arms were attained with acceptable accuracy and precision (all concentrations were achieved within approximately ±10% of the nominal value). These data are available upon request.
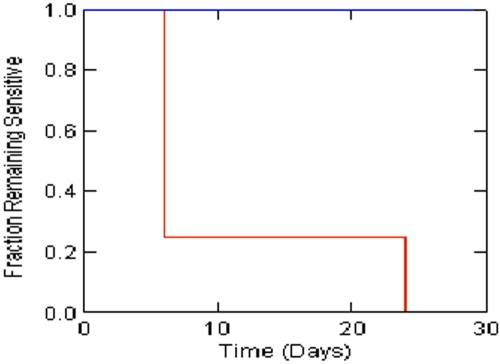
We employed Kaplan-Meier analysis to compare single versus combination agent therapies for time to resistance emergence, as well as time to a 3-log kill of M. tuberculosis. The effect of combination therapy was highly significant with regard to resistance suppression, as shown in Fig. 3 (P = 0.0006; Breslow-Gehan test). Combination therapy did not provide a time to a 3-log cell kill that was significantly different from that of monotherapy (P = 0.075; Breslow-Gehan test). This is confounded by resistance emergence, which occurred early in some monotherapy arms; i.e., cell kill with resistant subpopulation amplification alters the time to a specified amount of cell kill. This contrast is best pursued where there is no resistance emergence to confound the cell kill rate outcome (see below).
FIG 3 .
Times to resistance emergence in M. tuberculosis H37Ra for single versus combination chemotherapy. The difference is significant (P = 0.0006; Breslow-Gahan test). Red is monotherapy arms. Blue is combination therapy arms.
Documentation of Wayne-Hayes level II anaerobiosis (5) for the nonreplicating persister (NRP) study.
In the HFIM study, O2 tensions in the liquid medium were monitored at least 5 days/week. There were 36/53 (68%) measurements over the course of the experiment that were 10 parts per billion (ppb) or lower. The highest (one occasion) was 14 ppb.
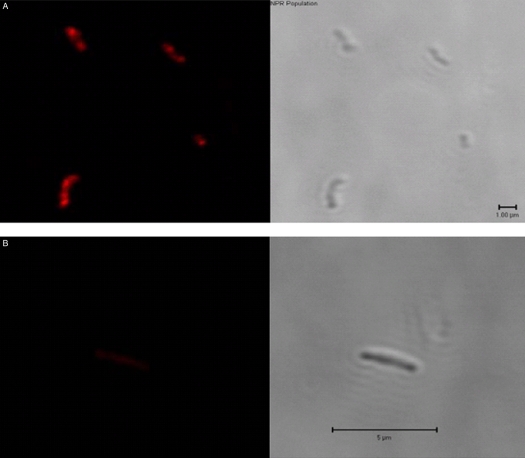
We also examined the organisms for the ability to be stained with Nile red (6) as an indicator of the NRP state. This is shown in Fig. 4A and B. The organisms under anaerobiosis demonstrated clear staining with Nile red, whereas log-phase organisms did not.
FIG 4 .
Nile red staining of log-phase and NRP M. tuberculosis. (A) Organisms held in anaerobiosis for 28 days and thought to be in the Wayne-Hayes level II state. (Left) Organisms are visibly stained with Nile red. (Right) Organisms visualized by phase-contrast microscopy. (B) Organisms in log-phase growth. (Left) No staining visible with Nile red. (Right) Organisms visualized by phase-contrast microscopy.
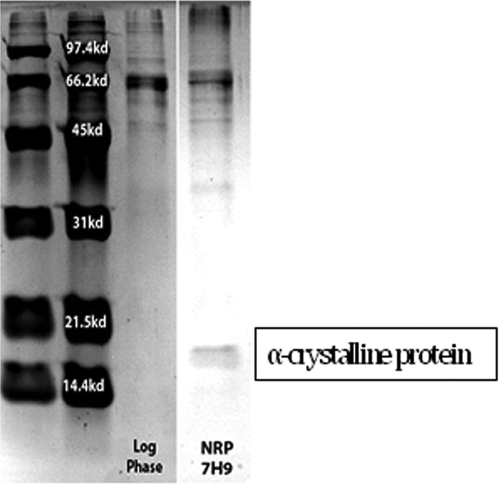
It has also been demonstrated previously (7) that organisms in the NRP state due to Wayne-Hayes level II anaerobiosis produce a 16-kDa protein (α-crystalline protein). This is demonstrated in Fig. 5.
FIG 5 .
Presence of 16-kDa α-crystalline protein, a proof of attainment of Wayne-Hayes level II anaerobiosis.
Given the documentation of O2 tension, Nile red staining, and production of α-crystalline protein, we conclude that the organisms studied were in the NRP state due to Wayne-Hayes level II anaerobiosis.
Cell kill and resistance emergence in a rifampin/moxifloxacin NRP-phase experiment.
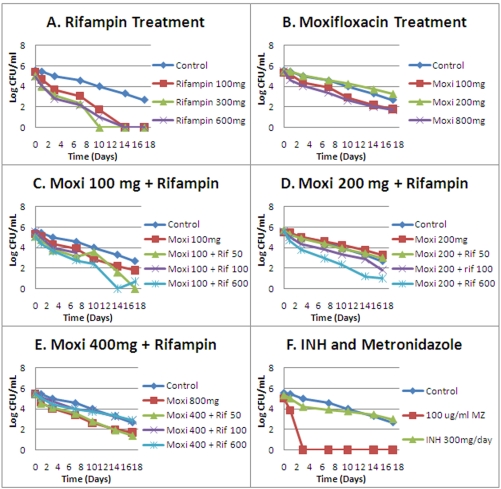
The cell kill over 17 days for all regimens is shown in Fig. 6A to F. In contrast to the log-phase growth culture, there is a considerable rate of cell death in the control arm. This is to be expected, given the stringency of the environment. We checked the dissolved-oxygen content of the medium (see above) and found that it was consistent with Wayne-Hayes level II anaerobiosis. However, we also ascertained the ambient gas content of our system versus the headspace ambient gas in classical Wayne-Hayes-type experiments. We were surprised to find that our system was considerably more stringent. We speculate that this increased environmental stringency is responsible for the death of the no-treatment controls. It should also be noted that all of the rifampin arms and two of three moxifloxacin active treatment arms produced cell kills in excess of that seen in the controls.
FIG 6 .
Effects of moxifloxacin alone and in combination on NRP-phase (Wayne-Hayes level II anaerobiosis) M. tuberculosis H37Ra. Panels: A, rifampin treatment; B, moxifloxacin treatment; C, 100 mg moxifloxacin in combination with three rifampin regimens; D, 200 mg moxifloxacin in combination with three rifampin regimens; E, 400 mg moxifloxacin in combination with three moxifloxacin regimens; F, effect of continuous infusion of isoniazid and continuous infusion of metronidazole. Drug administrations were done once daily.
There are two other important observations. The first was that in no instance was any resistance observed in any arm at any time for the duration of the experiment. Given the metabolic state of the organisms, this is not a surprise. In order for resistance to be detected, the resistant subpopulations need to increase to a point where the subculture volume employed has a reasonable likelihood of containing at least one colony that is drug resistant. Even if such a colony existed in our experimental setup, its inability to grow and amplify would render the likelihood of identifying such a colony small, given the 400-μl subculture volume relative to the 15 ml of the hollow-fiber unit. The second is that a number of the combination chemotherapy arms did not kill faster than the control treatment. This is shown in Fig. 6C to E.
Finally, it should be noted that both isoniazid and metronidazole (Fig. 6F) performed as expected under these conditions, with isoniazid demonstrating no kill in excess of the no-treatment control, while a high concentration of metronidazole (100 mg/liter) rapidly (day 3) sterilized the unit.
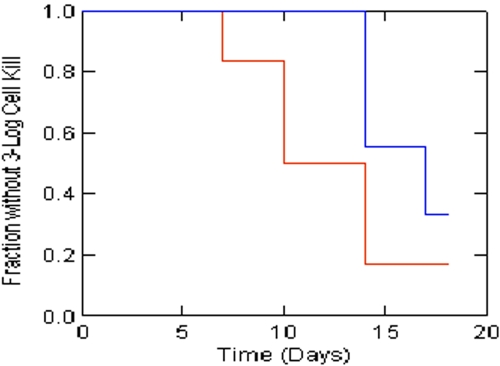
Finally, the poorer performance of the combination therapy arms caused us to formally test whether there was a significant difference in time to a 3-log cell kill for single versus combination chemotherapy. In this circumstance, there was no emergence of resistance to confound the results. The Kaplan-Meier analysis shown in Fig. 7 demonstrated that there was a significant difference (P = 0.042; Breslow-Gehan test) between combination therapy and monotherapy, with the monotherapy groups having a shorter time to a 3-log cell kill.
FIG 7 .
Times to achievement of a 3-log kill of M. tuberculosis H37Ra cells in the NRP phase for single versus combination chemotherapy. The difference is significant (P = 0.042; Breslow-Gahan test). Red is monotherapy arms. Blue is combination therapy arms.
Examination of pharmacodynamic indexes for monotherapy versus combination therapy regimens for suppression of amplification of resistant subpopulations.
We examined the concentration-time profiles of the monotherapy and combination therapy regimens for the log-phase organisms and used suppression of resistance as the index of success. Table 1 shows the pharmacodynamic indexes for the monotherapy regimens that failed and for the lowest-exposure combination therapy regimens that suppressed less-susceptible subpopulation amplification.
TABLE 1 .
Pharmacodynamic parameter values of failing and succeeding single and combination therapy regimens for resistance suppression
| Regimen | AUC/MIC ratio of free: | Resistance suppression | |
|---|---|---|---|
| Rifampin | Moxifloxacin | ||
| 600 mg rifampin QD | 168.2 | Failure | |
| 800 mg moxifloxacin QD | 177.2 | Failure | |
| 100 mg rifampin QD + 100 mg moxifloxacin QD | 24.2 | 21.5 | Success |
The exposure for the 600-mg QD rifampin dose failed with the observation of resistance emergence, and the free-drug area-under-the-curve (AUC)/MIC ratio was 168.2. For the moxifloxacin 800-mg-equivalent exposure given daily, failure due to resistance was late but occurred at a free-drug AUC/MIC ratio of 177.2.
In contrast, the combination regimen of 100 mg rifampin plus 100 mg moxifloxacin suppressed the amplification of less-susceptible populations until the end of the experiment. The free-drug AUC/MIC ratio for rifampin in this combination was 24.2, and for moxifloxacin it was 21.5. The combination regimen reduced the drug exposure required for resistance suppression by circa 7-fold for rifampin and by circa 8-fold for moxifloxacin.
DISCUSSION
Moxifloxacin is the newest agent being extensively evaluated for first-line status for TB therapy. Rifampin is the backbone of current TB therapy, when the pathogen is susceptible to it. A number of investigators have indicated that isoniazid is actually antagonistic when part of the standard four-drug therapy in mouse experiments (2–4). Consequently, we decided to examine the combination of moxifloxacin plus rifampin.
One of the unique aspects of therapy for TB is that it is hypothesized that there are multiple physiological states of the pathogen that have an impact on the ability to kill target organisms and also may have an impact on the duration of therapy necessary to attain a true clinical cure (8). One of these physiological states is thought to result in a subpopulation being in the NRP state (5, 9). Production of Wayne-Hayes level II anaerobiosis has been used as a tool for studying M. tuberculosis in this state. We decided to examine the combination of moxifloxacin plus rifampin against M. tuberculosis in log-phase growth but also in the NRP state.
The interaction of antimicrobial agents is often thought of as being synergistic, additive, or antagonistic (10). While it is a useful frame of reference, it is critical to recognize that this is an incomplete way to think of drug-drug interaction for effect. It is important to state what the endpoint is that is being evaluated. Generally, the interaction is evaluated as a function of cell kill. However, this is not the only endpoint that is clinically important. The ability of agents in combination to suppress the amplification of resistant subpopulations is arguably as important as or more important than the ability to kill organisms at an optimal rate. Our laboratory has recently demonstrated that these endpoints may be dichotomous, as we examined meropenem plus tobramycin against Pseudomonas aeruginosa (11). In this evaluation, we looked at both of these endpoints.
When the moxifloxacin-rifampin interaction was examined in log-phase growth organisms, the outcome was quite clear (Fig. 1 and 2). Monotherapy with either moxifloxacin or rifampin demonstrated a good organism kill in the first 1 to 2 weeks of the experiment. After this point, clear regrowth was seen. Examination of growth on drug-containing plates demonstrated that in all of the monotherapy arms there was emergence of resistance in the first week to 10 days. The single exception was high-dose moxifloxacin at 800 mg QD, where resistance emergence was not seen until day 24 of the experiment.
Combination chemotherapy outcomes were very clear. In no instance was any resistance emergence observed for the full duration of the experiment. In order to test for differences between monotherapy and combination agent therapy, we employed Kaplan-Meier product limit estimation. For cell kill, we employed the time needed to achieve a 3-log decline in colony counts from the baseline. For resistance emergence, we looked at the time to the first observation of resistant colonies on drug-containing plates exceeding the baseline number. No significant difference was seen between monotherapy and combination therapy groups in the time needed to achieve a 3-log decline in total colony counts (P = 0.075), but a highly significant difference was seen for the time to identification of resistant colonies (Fig. 3; P = 0.0006). The main effect identifiable for combination therapy with log-phase organisms is suppression of resistance. Given the confounding between resistance emergence and the rate of decline of the total population burden, it was not clear whether there was truly no difference in the rate of kill. For this evaluation, we chose to examine the second experiment with organisms in the NRP phase.
One of the findings in this population is that there was no resistance emergence seen in any regimen evaluation at any time. This is not surprising for a number of reasons. First, the number of baseline organisms in the NRP state was relatively low (as is thought to be the case clinically). Second, the stringent conditions caused cell death over time in the no-treatment control. Therefore, the number of organisms in which resistance can emerge goes down with time. Third, the metabolic state of NRP organisms is such that there is no growth, and hence, organisms best able to withstand drug pressure cannot amplify because no growth is occurring. Also, little in the way of protein synthesis occurs (12), so that mechanisms such as efflux pump induction and expression cannot provide protection.
However, the lack of resistance means that this population can be used to examine for the effect of combination therapy on the rate of cell kill without confounding. Examining Fig. 6 and 7 shows that there was a significant difference between monotherapy and combination agent therapy with respect to the time it took to achieve a 3-log kill of the total bacterial burden from the baseline. In this instance, however, the monotherapy arms achieved this reduction in the bacterial burden significantly more rapidly than the combination therapy regimens did. This indicates that the combination of moxifloxacin plus rifampin is somewhat antagonistic with respect to cell kill but is synergistic with respect to suppression of emergence of resistance (seen in the log-phase organism experiment). It should also be noted that rifampin outperformed moxifloxacin in the NRP experiment, indicating that this is still the standard for NRP-phase organisms but that moxifloxacin is a welcome addition.
We looked at the ability to suppress less-susceptible subpopulations from amplifying quantitatively by calculating the free-drug AUC/MIC ratios of both moxifloxacin and rifampin for the largest monotherapy failure exposures (rifampin at 600 mg QD and moxifloxacin at 800 mg QD) and the lowest combination therapy regimen successful at suppressing resistance emergence (rifampin at 100 mg QD plus moxifloxacin at 100 mg QD). The exposures that allowed suppression in combination were approximately 7-fold (rifampin) and 8-fold (moxifloxacin) lower than those of monotherapy regimens that failed. Clearly, there was a synergistic interaction between these agents with respect to resistance emergence.
The conclusion that one can draw is that it is likely that the moxifloxacin-rifampin combination is somewhat analogous to the isoniazid-rifampin combinations in that there may be some antagonism with respect to rates of overall reduction of the bacterial burden but that there is clearly protection with regard to resistance emergence. The implication is that this combination is welcome as another excellent choice to add to the clinician’s armamentarium but it may not mediate a major reduction in the duration of therapy for wild-type M. tuberculosis infections (but is hugely important for MDR TB therapy). Indeed, one large clinical trial in which moxifloxacin was substituted for isoniazid (13) has demonstrated this point recently. However, another, where moxifloxacin was substituted for ethambutol (14), demonstrated a benefit with respect to the time to culture negativity. It would be important to interpret this difference with respect to the degree of cell kill antagonism for the rifampin-isoniazid combination versus the rifampin-moxifloxacin combination and to evaluate rifampin-isoniazid and moxifloxacin in combination in this in vitro system.
MATERIALS AND METHODS
Bacterial isolate.
M. tuberculosis H37Ra (ATCC 25177; American Type Culture Collection) was used in our studies (it should be noted that this isolate is not the same as H37Rv with respect to MIC values and other characteristics and that neither may reflect those of wild-type isolates). Bacterial cultures were stored at −80°C in Middlebrook 7H9 broth with 10% oleic acid-albumin-dextrose-catalase (OADC) and 0.025% Tween 80 (Becton Dickinson), here called “medium,” and aliquots were thawed for each study. The cultures were incubated in 5% CO2 at 37°C in medium for 4 days to achieve exponential-phase growth. NRP M. tuberculosis H37Ra was generated using the Wayne-Hayes model (5). Briefly, M. tuberculosis H37Ra was grown in Dubos Tween albumin broth. The culture was slowly stirred in a sealed glass bottle with a 1:1 headspace-to-volume ratio for 28 days at 37°C.
Antimicrobial agents.
Rifampin was obtained from the pharmacy at Albany Medical College (Albany, NY). Stock solutions of this antibiotic were prepared in sterile water, and aliquots were stored at –80°C. For each study, a sample of the drug was thawed and diluted to the desired concentration in sterile water or Middlebrook 7H9 broth and used immediately.
Moxifloxacin was the kind gift of Bayer Pharmaceuticals. Stock solutions of this antibiotic were prepared in sterile water, and aliquots were stored at –80°C. For each study, a sample of the drug was thawed and diluted to the desired concentration in sterile water or Middlebrook 7H9 broth and used immediately.
MIC determination.
H37Ra MIC values were determined by plating 10 µl of a 1 × 10⁶-CFU/ml concentration of culture onto Middlebrook 7H10 agar plus OADC containing geometric 2-fold dilutions of rifampin or moxifloxacin. Plates were incubated at 37°C, and results were read after 21 days of incubation. The MIC was defined as the lowest concentration that allowed growth of M. tuberculosis that was ≤1% of that of untreated controls. MIC testing was performed as described by CLSI (17). This determination was conducted aerobically.
Mutation frequency determinations.
M. tuberculosis H37Ra was grown to exponential phase in 7H9 broth as described above. On the 4th day, the mutation frequency in the cultures was determined by plating 5 ml of a log-phase culture of M. tuberculosis onto Middlebrook 7H10-OADC plates containing either 32× the MIC of rifampin or 6× the MIC of moxifloxacin. The mutation frequency was determined after 21 days of incubation at 37°C. This determination was performed aerobically.
Measurement of dissolved O2.
Dissolved-O2 measurements were taken with a Mettler, Toledo InPro6900 sensor and an O2 4,100-ppb transmitter (Mettler, Toledo, Bedford, MA).
Nile red assay.
Nile red (Sigma-Aldrich, St. Louis, MO) was dissolved in ethanol at 0.5 mg/ml and stored at −20°C. For staining, 1 µl of Nile red solution was added to 50 µl of bacterial solution and the mixture was incubated at 37°C for 10 min. Samples were washed three times with phosphate-buffered saline (PBS) and then mounted in glycerol on microscope slides. Cells were viewed using a Carl Zeiss 510 META laser scanning microscope at a wavelength of 514 nm.
Detection of α-crystalline protein.
The NRP cultures were harvested on day 28 of NRP generation, centrifuged at 3,000 × g for 20 min, washed three times with PBS containing protease inhibitor cocktail (Sigma-Aldrich, St. Louis, MO) and Tween 80 (PBSIT), and resuspended to 1 ml in PBSIT. Samples were frozen and thawed 10 times using a dry ice bath and a 37°C water bath. Total cellular proteins were extracted with a Mini-BeadBeater (Biospec, Bartlesville, OK) using an equal volume of 0.1-mm glass beads (Sigma-Aldrich, St. Louis, MO). Cell debris and beads were centrifuged at 16,000 × g, and the supernatant was collected. Cellular proteins were prepared with 2× sodium dodecyl sulfate (SDS) sample buffer (125 mM Tris-HCl [pH 6.8], 4% SDS, 20% glycerol, 0.005% bromophenol blue) and heated at 95°C for 5 min. Cellular proteins were stained with Coomassie blue and separated by SDS-PAGE with a constant 100 V on 12% acrylamide gels (15).
HFIM.
The HFIM permits us to simulate the concentration-time profile of any dose of antibiotic. A computer-controlled syringe pump delivers the antibiotic into a central reservoir in the required amount at the desired schedule of administration. Fresh medium is pumped into the system while drug-containing medium is isovolumetrically removed from the system at rates programmed by the investigator to simulate the desired drug half-life (t1/2).
In these experiments, 15 ml of M. tuberculosis H37Ra was inoculated into the peripheral compartments of hollow-fiber cartridges at a concentration of 1 × 10⁶ to 5 × 10⁶ CFU/ml.
Using human pharmacokinetic parameters (t1/2 of 12 h and 50% protein binding for moxifloxacin, t1/2 of 3.5 h and 84% protein binding for rifampin), the free-drug serum concentration-time profiles of moxifloxacin and rifampin were simulated. The regimens were the same for both the 28-day log-phase growth study and the 17-day NRP Wayne-Hayes level II anaerobiosis study. The rifampin-only regimens were 100, 200, and 600 mg QD. For moxifloxacin, they were 100, 200, and 800 mg QD. These regimens were chosen to be at or below the currently recommended and licensed drug doses. The exception is the 800-mg moxifloxacin dose, which was chosen to determine if it is better for NRP therapy. For combination regimens, all possible combinations (n = 9) of 100, 200, and 600 mg of rifampin were made with 100, 200, and 400 mg of moxifloxacin.
For the arms where combination therapy was employed, the correct and quite different t1/2s of rifampin and moxifloxacin were developed by using the approach of Blaser (16). For the 28-day log-phase study, bacterial samples (400 µl) were taken from each hollow-fiber cartridge, washed (samples are taken from each hollow-fiber system and washed twice with sterile saline by centrifugation at 1,500 × g; the samples are then sonicated and vortexed to break up any clumps and plated on 7H10-OADC agar for quantitative culture) to prevent drug carryover, and then quantitatively cultured on drug-free agar and agar supplemented with 32× the MIC of rifampin or 6× the MIC of moxifloxacin to determine the effect of each treatment regimen on the total and rifampin- or moxifloxacin-resistant populations, respectively. After 21 days of incubation, the colonies were counted. The 17-day NRP study was performed identically.
The pharmacokinetic profiles simulated for rifampin and moxifloxacin were confirmed by liquid chromatography-tandem mass spectrometry. The central reservoir was sampled on 15 occasions over 48 h. The data were modeled and considered acceptable if clearance and volume estimates were within 10% of the nominal values. The experiments were conducted on two separate occasions.
Pharmacokinetic methods.
Concentration-time profiles were analyzed employing the ADAPT II package of programs of D. Z. D’Argenio and A. Schumitzky, Biomedical Simulations Resource, University of Southern California (identification module: maximum-likelihood estimation). As computer-controlled infusion pumps drove the profile, a one-compartment open model with zero-order input and first-order elimination was employed.
Statistical analysis.
We examined the time to resistance emergence and the time to sterility using a Kaplan-Meier estimator. The analysis was performed using SYSTAT for Windows v11. A P value of 0.05 was considered significant.
ACKNOWLEDGMENTS
This work was supported by the Bill and Melinda Gates Foundation in their TB Drug Accelerator project. The moxifloxacin powder was supplied by the Bayer-TB Alliance Joint Development Committee and Joint Steering Committee.
We have no conflicts to divulge.
Footnotes
Citation Drusano, G. L., N. Sgambati, A. Eichas, D. L. Brown, R. Kulawy, et al. 2010. The combination of rifampin plus moxifloxacin is synergistic for suppression of resistance but antagonistic for cell kill of Mycobacterium tuberculosis as determined in a hollow-fiber infection model. mBio 1(3):e00139-10. doi:10.1128/mBio.00139-10.
REFERENCES
- 1. Selkon J. B., Devadatta S., Mitchison D. A., Narayana A. S., Nair C. N., Ramachandran K. 1964. The emergence of isoniazid-resistant cultures in patients with pulmonary tuberculosis during treatment with isoniazid alone or isoniazid plus PAS. Bull. World Health Organ. 31:273–294 [PMC free article] [PubMed] [Google Scholar]
- 2. Almeida D., Nuermberger E., Tasneen R., Rosenthal I., Tyagi S., Williams K., Peloquin C., Grosset J. 2009. Paradoxical effect of isoniazid on the activity of rifampin-pyrazinamide combination in a mouse model of tuberculosis. Antimicrob. Agents Chemother. 53:4178–4184 [DOI] [PMC free article] [PubMed] [Google Scholar]
- 3. Grosset J., Truffot-Pernot C., Lacroix C., Ji B. 1992. Antagonism between isoniazid and the combination pyrazinamide-rifampin against tuberculosis infection in mice. Antimicrob. Agents Chemother. 36:548–551 [DOI] [PMC free article] [PubMed] [Google Scholar]
- 4. Dickinson J. M., Aber V. R., Mitchison D. A. 1977. Bactericidal activity of streptomycin, isoniazid, rifampin, ethambutol, and pyrazinamide alone and in combination against Mycobacterium tuberculosis. Am. Rev. Respir. Dis. 116:637–635 [DOI] [PubMed] [Google Scholar]
- 5. Wayne L. G., Hayes L. G. 1996. An in vitro model for sequential study of shiftdown of Mycobacterium tuberculosis through two stages of nonreplicating persistence. Infect. Immun. 64:2062–2069 [DOI] [PMC free article] [PubMed] [Google Scholar]
- 6. Garton N. J., Waddell S. J., Sherratt A. L., Lee S. M., Smith R. J., Senner C., Hinds J., Rajakumar K., Adegbola R. A., Besra G. S., Butcher P. D., Barer M. R. 2008. Cytological and transcript analyses reveal fat and lazy persister-like bacilli in tuberculous sputum. PLoS Med. 5:e75. [DOI] [PMC free article] [PubMed] [Google Scholar]
- 7. Desjardin L. E., Hayes L. G., Sohaskey C. D., Wayne L. G., Eisenach K. D. 2001. Microaerophilic induction of the alpha-crystallin chaperone protein homologue (hspX) mRNA of Mycobacterium tuberculosis. J. Bacteriol. 183:5311–5316 [DOI] [PMC free article] [PubMed] [Google Scholar]
- 8. Blumberg H. M., Burman W. J., Chaisson R. E., Daley C. L., Etkind S. C., Friedman L. N., Fujiwara P., Grzemska M., Hopewell P. C., Iseman M. D., Jasmer R. M., Koppaka V., Menzies R. I., O’Brien R. J., Reves R. R., Reichman L. B., Simone P. M., Starke J. R., Vernon A. A. 2003. American Thoracic Society/Centers for Disease Control and Prevention/Infectious Diseases Society of America: treatment of tuberculosis. Am. J. Respir. Crit. Care Med. 167:603–662 [DOI] [PubMed] [Google Scholar]
- 9. Wayne L. G., Hayes L. G. 1998. Nitrate reduction as a marker for hypoxic shiftdown of Mycobacterium tuberculosis. Tuber. Lung Dis. 79:127–132 [DOI] [PubMed] [Google Scholar]
- 10. Greco W. R., Bravo G., Parsons J. C. 1995. The search for synergy: a critical review from a response surface perspective. Pharmacol. Rev. 47:331–385 [PubMed] [Google Scholar]
- 11. Drusano G. L., Liu W., Fregeau C., Kulawy R., Louie A. 2009. Differing effect of combination chemotherapy with meropenem and tobramycin on cell kill and suppression of resistance on wild-type Pseudomonas aeruginosa PA01 and its isogenic MexAB efflux pump-overexpressed mutant. Antimicrob. Agents Chemother. 53:2266–2273 [DOI] [PMC free article] [PubMed] [Google Scholar]
- 12. Gefen O., Gabay C., Municoglu M., Engel G., Balaban N. Q. 2008. Single cell protein induction dynamics reveals a period of vulnerability to antibiotics in persister bacteria. Proc. Natl. Acad. Sci. U. S. A. 105:6145–6149 [DOI] [PMC free article] [PubMed] [Google Scholar]
- 13. Dorman S. E., Johnson J. L., Goldberg S., Muzanye G., Padayatchi N., Bozeman L., Heilig C. M., Bernardo J., Choudhri S., Grosset J. H., Guy E., Guyadeen P., Leus M. C., Maltas G., Menzies D., Nuermberger E. L., Villarino M., Vernon A., Chaisson R. E., and the Tuberculosis Trials Consortium 2009. Substitution of moxifloxacin for isoniazid during intensive phase treatment of pulmonary tuberculosis. Am. J. Respir. Crit. Care Med. 180:273–280 [DOI] [PubMed] [Google Scholar]
- 14. Conde M. B., Efron A., Loredo C., De Souza G. R., Graça N. P., Cezar M. C., Ram M., Chaudhary M. A., Bishai W. R., Kritski A. L., Chaisson R. E. 2009. Moxifloxacin versus ethambutol in the initial treatment of tuberculosis: a double-blind, randomised, controlled phase II trial. Lancet 373:1183–1189 [DOI] [PMC free article] [PubMed] [Google Scholar]
- 15. Yuan Y., Crane D. D., Barry C. E. 1996. Stationary phase-associated protein expression in Mycobacterium tuberculosis: function of the mycobacterial α-crystallin homolog. J. Bacteriol. 178:4484–4492 [DOI] [PMC free article] [PubMed] [Google Scholar]
- 16. Blaser J.1985. In-vitro model for simultaneous simulation of the serum kinetics of two drugs with different half-lives. J. Antimicrob. Chemother. 15Suppl. A: 125–130 [DOI] [PubMed] [Google Scholar]
- 17. Clincial and Laboratory Standards Institute 2003. Susceptibility testing of mycobacteria, nocardiae, and other aerobic actinomycetes; approved standard. Clinical and Laboratory Standards Institute, Wayne, PA: [PubMed] [Google Scholar]


