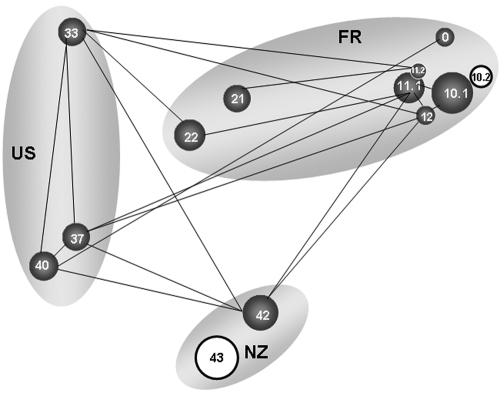
FIG 5 .
Genetic similarity of populations of P. syringae, based on partial sequences of the cts gene, in terms of the sites and dates of isolation from water. Populations are represented by circles whose size is proportional to the relative concentration of the P. syringae population (number of bacteria per liter) in the waters that were sampled. The numbers in the circles correspond to the sampling sites listed in Table 1. The regional origins of samples are indicated by the gray ovals (US, United States; FR, France; NZ, New Zealand). Within the U.S. and France regions, the physical distance between populations shown is roughly proportional to their real geographic distance. The genetic structures of populations linked by black lines are not significantly different (P > 0.05) based on an FST test. The structures of those not linked by black lines are significantly different (P ≤ 0.05). The structures of the populations circled in black are significantly different from those of all of the other populations in this study.

