Abstract
Iron is essential for proliferation of normal and neoplastic cells. Cellular iron uptake, utilization and storage are regulated by transcriptional and post-transcriptional mechanisms. We hypothesized that the disruption of iron homeostasis may modulate the growth properties of cancer cells. To address this, we employed H1299 lung cancer cells engineered for tetracycline-inducible overexpression of the post-transcriptional regulator iron regulatory protein 1 (IRP1). The induction of IRP1 (wild-type or the constitutive IRP1C437S mutant) did not affect the proliferation of the cells in culture, and only modestly reduced their efficiency to form colonies in soft agar. However, IRP1 dramatically impaired the capacity of the cells to form solid tumor xenografts in nude mice. Tumors derived from IRP1-transfectants were <20% in size compared to those from parent cells. IRP1 coordinately controls the expression of transferrin receptor 1 (TfR1) and ferritin by binding to iron-responsive elements (IREs) within their mRNAs. Biochemical analysis revealed high expression of epitope-tagged IRP1 in tumor tissue, which was associated with a profound increase in IRE-binding activity. As expected, this response misregulated iron metabolism by increasing TfR1 levels. Surprisingly, IRP1 failed to suppress ferritin expression and did not affect the levels of the iron transporter ferroportin. Our results show that the overexpression of IRP1 is associated with an apparent tumor suppressor phenotype and provide a direct regulatory link between the IRE/IRP system and cancer.
Introduction
Even though iron is not a classic carcinogen, it is closely associated with cancer. First, it is essential for proliferation of cancer cells (1); furthermore, iron overload predisposes to liver fibrosis and hepatocellular carcinoma (2). The mechanisms for iron-induced carcinogenesis remain elusive. It is believed that iron overload disrupts the redox balance of the cell and generates chronic oxidative stress, which modulates signaling networks related to malignant transformation (3) and may lead to mutations in critical gatekeeping or DNA repair genes (2). Selective genomic sites are reported to be particularly vulnerable to iron-catalyzed oxidant attack (4). On the other hand, iron-induced oxidative stress may also damage cellular organelles, such as the mitochondria and lysosomes, and thereby promote apoptotic or necrotic cell death (5). Thus, it appears that misregulation of iron metabolism elicits complex responses, which have been associated with end points as diverse as cell immortalization and cell death.
Most cells within mammalian tissues acquire iron from the plasma iron carrier transferrin, which undergoes endocytosis upon binding to the cell surface transferrin receptor 1 (TfR1) and releases its cargo in the acidified endosome (6). Iron is then transported across the endosomal membrane by the divalent metal transporter 1 and utilized in various metalloproteins (7). Excess of iron is stored and detoxified in ferritin, a cytosolic storage protein (8). The expression of TfR1 and ferritin is coordinately controlled by post-transcriptional mechanisms that involve binding of iron regulatory proteins (IRP1 and IRP2) to iron-responsive elements (IREs) within their mRNAs (9). In iron-deficient cells, IRE/IRP interactions stabilize TfR1 mRNA and inhibit ferritin mRNA translation. The IRE/IRP system also accounts for the translational regulation of the mRNA encoding the iron transporter ferroportin, which mediates iron efflux in many cell types (7), as well as a limited number of additional mRNAs related directly or indirectly to iron metabolism (9). In iron-replete cells, IRP1 assembles a cubane 4Fe-4S cluster that prevents IRE-binding and converts it to cytosolic aconitase (10), while IRP2 undergoes proteasomal degradation (11). It has been suggested that under physiological oxygen tension IRP1 predominates in the aconitase form and alterations in cellular iron levels are primarily sensed by IRP2 (12).
We previously showed that tetracycline-inducible overexpression of the constitutive IRP1C437S mutant misregulated iron metabolism in human H1299 lung cancer cells (13). This mutant fails to assemble an iron-sulfur cluster (14,15). As expected, IRP1C437S expression increased TfR1 levels; however, it only suppressed ferritin synthesis in low-density cell cultures (13). Under these conditions, the cells were sensitized to iron loading, which promoted oxidative stress and apoptosis. Based on these findings, we hypothesized that misregulation of IRP1 may affect tumor growth in vivo. We employed H1299 cells engineered to express high levels of IRP1C437S or wild-type IRP1 and evaluated their tumorigenic capacity. We show that the overexpression of IRP1 (either mutant or wild-type), highly active in IRE-binding, did not alter the growth properties of the H1299 cells in vitro, but dramatically impaired their capacity to form tumor xenografts in nude mice.
Materials and methods
Cell culture
Human H1299 lung cancer cells and clones expressing either IRP1C437S (HIRP1mut) or wild-type IRP1 (HIRP1wt) in a tetracycline-inducible manner were grown in Dulbecco’s modified Eagle medium (DMEM) supplemented with 10% fetal bovine serum, 2 mM glutamine, 100 U/ml penicillin and 0.1 ng/ml streptomycin. The HIRP1wt cells were generated as described in (13) for HIRP1mut cells. Stable clones were maintained in the presence of 2 μg/ml tetracycline, 2 μg/ml puromycin and 250 μg/ml G418.
Cell proliferation assay
A total of 2 × 10⁴ cells were seeded in 24-well dishes and growth was monitored by the MTT tetrazolium assay (Promega). The cells were washed twice with phosphate-buffered saline (PBS) and incubated at 37°C for 3 h with phenol red-free DMEM containing 141 mg/ml 3-(4,5-dimethylthiazol-2-yl)-2,5-diphenyltetrazolium bromide (MTT) and 3.25 mg/ml phenazine methosulfate. Formazan in cell supernatant was measured spectrophotometrically at 490 nm.
Soft agar colony formation assay
A total of 2 × 10⁴ cells were trypsinized and resuspended in 3 ml 0.5% (w/v) Bacto™ Agar solution containing DMEM with 20% fetal bovine serum. The mixtures were passed 5–6 times through a 20G needle and overlaid onto a 0.5% (w/v) Bacto™Agar solution in 6-well dishes. On the following day, 2 ml of DMEM supplemented with 20% fetal bovine serum was added. Colonies (defined as aggregates of >30 cells) were counted under a microscope after 21 days. Cloning efficiency was calculated by the number of colonies × 100 divided by the number of cells plated.
Animal studies
BALB/c (nu/nu) mice were purchased from Charles River Laboratories (Cambridge, MA). The animals were cared to and maintained in accordance with institutional guidelines. For the tumorigenicity assay, 2 × 10⁶ viable cells, suspended in 200 μl PBS, were injected subcutaneously into the flanks of 4–6 weeks old female mice (16). Three animals were used for each experimental group. The mice were monitored twice a week. The dimensions of the tumor xenografts were determined every 5 days with a linear caliper. The tumor volume was calculated according to the equation V (mm3) = π/6 (a × b2), where a is the long axis and b is the short axis of the tumor. At the end of the experiment the animals were sacrificed and the tumors were excised, weighed and further processed for histological and biochemical analysis.
Histological analysis
Sections of tumor tissues (up to 1 mm thick) were fixed overnight in 10% formaldehyde. Tissue slides were embedded in paraffin, sectioned, dehydraded in graded alcohol and stained with hematoxylin and eosin. Ferric iron was visualized by Pearl’s Prussian blue with the Accustain®Iron Stain kit (Sigma).
Analysis of tumor tissue iron content by atomic absorption spectrometry
Tumor tissue samples, or 0.2–0.25 g bovine liver as a control, were weighed wet, then dried overnight at 106°C and weighed again. The dried samples were ashed in an oven at 500°C for 17 h and, subsequently, fully solubilized in 6 N HCl. The solution was diluted to a final 1.2 N HCl with deionized water. The iron concentration was determined by atomic absorption spectrometry (17).
Preparation of cell and tumor tissue extracts
Cells were washed twice in ice-cold PBS and lysed in ‘cytoplasmic lysis buffer’ (20 mM Tris–Cl pH 7.4, 40 mM KCl and 1% Triton X-100). Excised tumors were dissected into pieces and frozen at −80°C. Tumor tissues (~0.2 g wet weight) were suspended in 500 μl of ‘cytoplasmic lysis buffer’ and homogenized in a 1 ml glass homogenizer. Cell debris was cleared by centrifugation and protein concentration was measured with the Bradford reagent (Bio-Rad).
Western blotting
Protein lysates (30–70 μg) were resolved by SDS–PAGE on 10% gels and proteins were transferred onto nitrocellulose filters. The blots were saturated with 10% non-fat milk in PBS containing 0.1% Tween-20 (PBS-T) and probed with 1:1000 diluted M2-FLAG (Sigma), TfR1 (Zymed), ferritin (Roche), ferroportin (Alpha Diagnostics) or β-actin (Sigma) antibodies. Following a wash with PBS-T, the blots with monoclonal TfR1 antibodies were incubated with peroxidase-coupled rabbit anti-mouse IgG (1:4000 dilution) and the blots with all other polyclonal antibodies were incubated with goat anti-rabbit IgG (Sigma, 1:5000 dilution). Peroxidase-coupled antibodies were detected by the enhanced chemiluminescence method, according to the manufacturer’s instructions (Amersham).
Electrophoretic mobility shift assay
IRE-binding activity was analyzed by an Electrophoretic Mobility Shift Assay (EMSA), as earlier described (18). Briefly, cell lysates or tumor tissue homogenates containing 15 μg protein were incubated at room temperature with a radiolabeled ferritin IRE probe (25 000 c.p.m.) in the absence or presence of 2% 2-mercaptoethanol (2-ME). After 20 min, heparin (50 μg) was added to the reaction, to inhibit non-specific protein interactions with the probe, and the incubation was continued for another 10 min. Subsequently, the samples were loaded on a non-denaturing polyacrylamide gel. RNA/protein complexes were visualized by autoradiography.
Aconitase assay
Aconitase activity was determined by the reduction of NADP+ at 340 nm in a coupled reaction with isocitrate dehydrogenase, with 200 μM citrate as substrate (19). The formation of cis-aconitate was monitored spectrophotometrically at 240 nm, using an extinction coefficient of 3.6 mM−1 (20). One unit of aconitase is defined as the amount that converts 1 micromole of substrate per minute at pH 7.4 at 25°C.
Statistical analysis
Data are shown as means ± SEM. Statistical analysis was performed by the unpaired Student’s t-test with the Prism GraphPad Software (version 4.0c).
Results
Overexpression of IRP1 does not affect the growth of H1299 cells in vitro
HIRP1mut and HIRP1wt cells are engineered to express IRP1C437S or wild-type IRP1, respectively, under the control of a tetracycline-inducible promoter (13). Removal of tetracycline from culture media (tet-off system) resulted in accumulation of FLAG-tagged IRP1 in transfected clones but not in parent H1299 cells (Figure 1A), associated with a dramatic increase in IRE-binding activity (Figure 1B). Notably, the IRE-binding activity of wild-type IRP1 was comparable to that of the constitutive IRP1C437S mutant (lanes 2 and 4) and this persisted even after treatment of the cell extracts with 2-ME (bottom panel). Thus, HIRP1mut and HIRP1wt cells appear phenotypically indistinguishable, as they both overexpress a form of IRP1 highly active in IRE-binding.
Fig. 1.
Tetracycline-inducible expression of IRP1C437S or wild-type IRP1. Parent H1299, HIRP1mut and HIRP1wt cells were grown for 48 h with 2 mg/ml (+) or without (−) tetracycline and cell lysates were prepared. (A) The expression of transfected FLAG-tagged IRP1 was analyzed by western blotting; the blots were hybridized with FLAG (top) and β-actin (bottom) antibodies. (B) Analysis of IRE-binding activity by EMSA with a 32P-labeled IRE probe in the absence (top) or presence (bottom) of 2% mercaptoethanol (2-ME). Only IRP1/IRE complexes are shown.
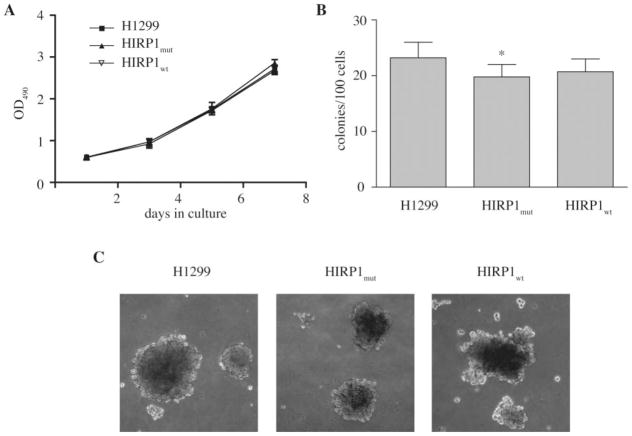
We first evaluated whether the overexpression of active IRP1 affects cell growth. However, parent H1299 lung cancer cells and clones overexpressing IRP1 (mutant or wild-type) exhibited similar proliferation rates, as judged by an MTT proliferation assay (Figure 2A) and by direct cell counting (data not shown). Because high levels of IRP1C437S lead to misregulation of cellular iron metabolism (13), we examined whether this might affect anchorage-independent growth, which is an established indicator of tumorigenic capacity (21). HIRP1mut and HIRP1wt cells tended to form colonies in soft agar with modestly (~10–15%) reduced efficiency compared to parent H1299 counterparts (Figure 2B). There were no dramatic differences in the macroscopic size of the colonies (Figure 2C). These results suggest that the overexpression of IRP1 does not extensively affect the growth and tumorigenic properties of H1299 cells in vitro.
Fig. 2.
Overexpression of IRP1 does not affect cell growth in vitro. (A) Growth rates of parent H1299 (filled square), HIRP1mut (filled diamond) and HIRP1wt (inverted triangle) cells in monolayers. Values correspond to triplicate samples (mean ± SEM). (B) and (C) Anchorage-independent growth of parent H1299, HIRP1mut and HIRP1wt cells in soft agar. Efficiency for colony formation is shown in (B); images of colonies (×100 magnification) are shown in (C). All media did not contain tetracycline to allow expression of transfected IRP1. *P < 0.05 versus control (Student’s t-test).
Overexpression of IRP1 inhibits the growth of tumor xenografts in nude mice
To assess whether the overexpression of IRP1 modulates tumorigenicity in vivo, parent H1299, HIRP1mut or HIRP1wt cells were injected subcutaneously into the flanks of BALB/c (nu/nu) nude mice to form solid tumor xenografts. No tetracycline was added to the drinking water, to allow expression of transfected IRP1 (mutant or wild-type) in the injected HIRP1mut or HIRP1wt cells. Tumor formation was monitored over time. Parent H1299 cells gave rise to exponentially growing ‘control’ tumors within 3–4 weeks post-injection. Importantly, the xenografts derived from HIRP1mut or HIRP1wt cells, referred to as ‘IRP1mut’ or ‘IRP1wt’ tumors, were growing considerably slower compared to controls (Figure 3).
Fig. 3.
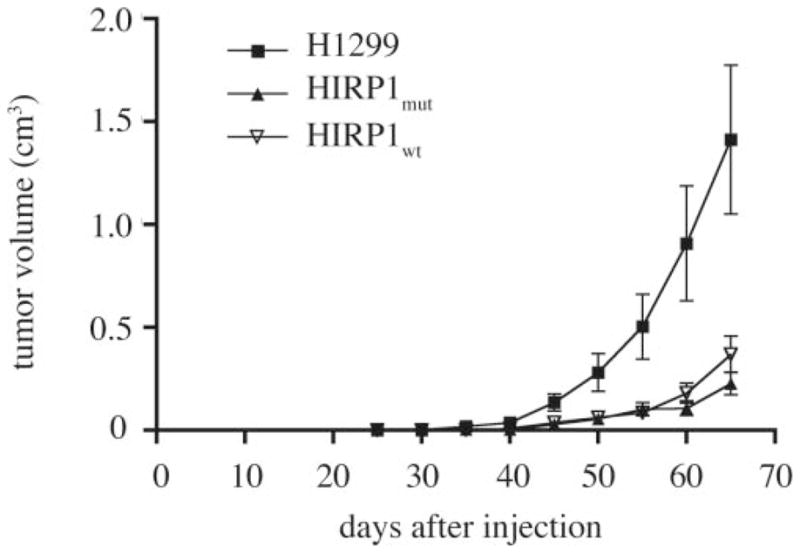
Overexpression of IRP1 suppresses the growth of tumor xenografts in nude mice. Nude mice were injected subcutaneously in each flank with parent H1299 (filled square), HIRP1mut (filled diamond) and HIRP1wt (inverted triangle) cells and tumor growth was monitored over time. Cumulative results from three independent experiments are shown (mean ± SEM). A total of 17 tumor xenografts were formed from parent H1299 cells (n = 9 mice), 10 from HIRP1wt cells (n = 6 mice) and 15 from HIRP1mut cells (n = 9 mice).
Histological and biochemical analysis of tumor xenografts
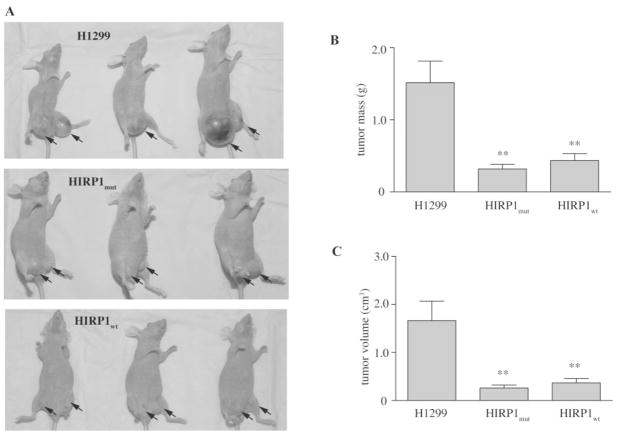
All mice were sacrificed 10 weeks post injection and the tumor xenografts were removed for further analysis. Representative pictures from anesthetized animals, prior to sacrifice are shown in Figure 4A. ‘IRP1mut’ and ‘IRP1wt’ tumors were significantly smaller compared to controls. Thus, the average masses of all ‘IRP1mut’ and ‘IRP1wt’ tumors analyzed were ~21 and 29% of control (P < 0.01), respectively (Figure 4B). Likewise, the average volumes of all ‘IRP1mut’ and ‘IRP1wt’ tumors analyzed were ~16 and 20% of control (P < 0.01), respectively (Figure 4C).
Fig. 4.
Macroscopic characteristics of ‘control’, ‘IRP1mut’ and ‘IRP1wt’ tumors. Nude mice were injected subcutaneously in each flank with parent H1299, HIRP1mut or HIRP1wt cells and tumor xenografts (arrows) were grown for 10 weeks. (A) Anesthetized animals from one representative experiment bearing ‘control’, ‘IRP1mut’ and ‘IRP1wt’ tumors prior to sacrifice. (B) and (C) Comparison of mass (B) and size (C) of isolated tumor xenografts from three independent experiments (mean ± SEM). A total of 17 tumor xenografts were formed from parent H1299 cells (n = 9 mice), 10 from HIRP1wt cells (n = 6 mice) and 15 from HIRP1mut cells (n = 9 mice). **P < 0.01 versus control (Student’s t-test).
Sections of the xenografts were stained with hematoxylin and eosin (Figure 5A, C and E). All tumors formed a well-circumscribed mass in the subcutis and normal adjacent tissue had some mammary ducts. There was virtually no stroma or basement membrane material present and occasional thin-walled vessels were visible. A central necrotic area, comprising ~10% of the surface of the analyzed section was evident in ‘control’ tumors (Figure 5A, arrow). In contrast, there were no necrotic areas in ‘IRP1mut’ tumors (Figure 5C). There were occasional regions of necrosis in ‘IRP1wt’ tumors, representing ~5% of the lesion (Figure 5E, arrow). Ferric iron could be detected in areas of all xenografts following staining with Pearl’s Prussian blue; however, there were no apparent differences in total iron content (Figures 5B, D and F). Analysis of tumor tissue samples by atomic absorption spectrometry revealed a content of ~250 μg Fe per gram dry weight in all ‘IRP1mut’, ‘IRP1wt’ and ‘control’ tumors, corroborating the conclusion drawn from the histological data.
Fig. 5.
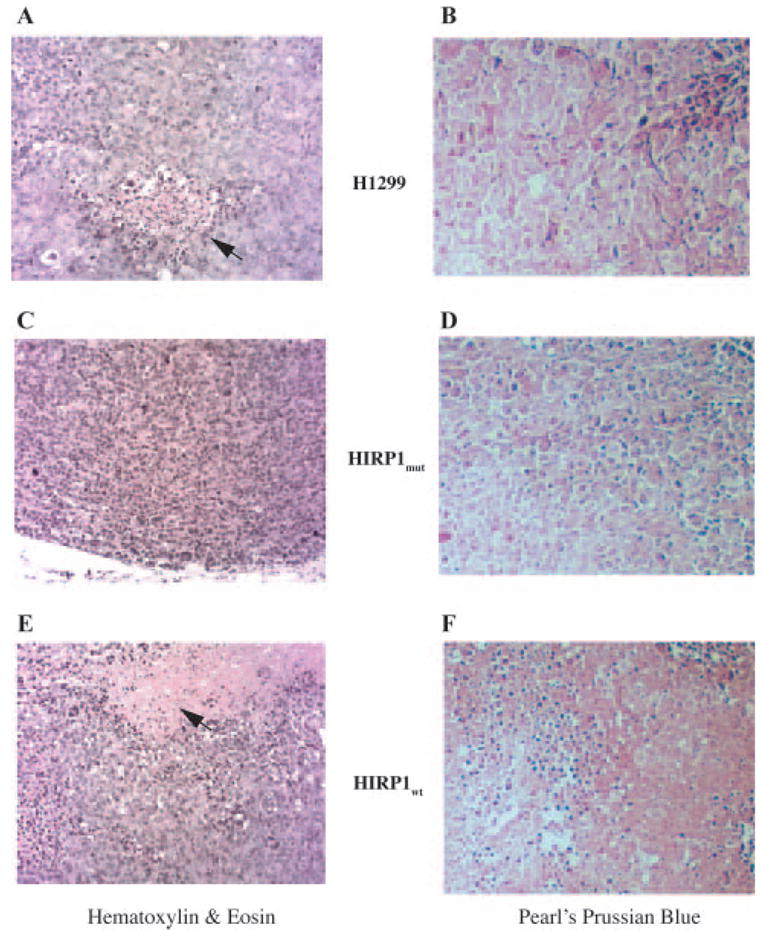
Histological analysis of ‘control’, ‘IRP1mut’ and ‘IRP1wt’ tumors. (A, C and F) Staining with hematoxylin and eosin; arrows indicate necrotic areas. (B, D and F) Staining with Pearl’s Prussian Blue. Magnification is ×200.
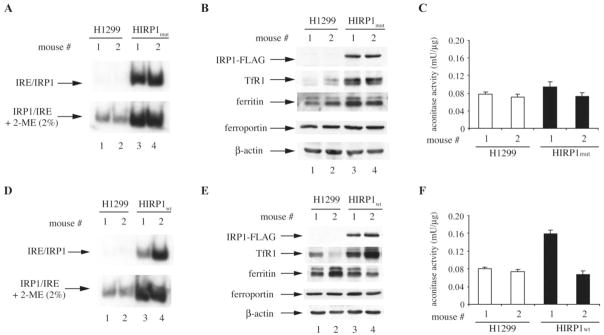
Extracts from ‘IRP1mut’ and ‘IRP1wt’ tumors displayed a dramatic increase in IRE-binding activity compared to controls (Figure 6A and D), which is consistent with the expression of IRP1C437S or wild-type IRP1, respectively (Figure 6B and E, upper panels). In agreement with the data obtained with HIRP1mut cells (Figure 1B), in ‘IRP1mut’ tumors the IRE-binding activity corresponding to overexpressed IRP1C437S was not enhanced by 2-ME (Figure 6A, bottom panel), and the aconitase activity was similar to that of controls (Figure 6C). Similar results were obtained in ‘IRP1wt’ tumors; however, in one out of two analyzed mice the (already high) IRE-binding activity was further induced by 2-ME (Figure 6D, bottom panel), suggesting that a fraction of overexpressed wild-type IRP1 in the tumor was present in the [4Fe-4S] form. This interpretation is also supported by the corresponding increase in the aconitase activity (Figure 6F).
Fig. 6.
‘IRP1mut’ and ‘IRP1wt’ tumors express active IRP1. (A) and (D) Extracts from ‘control’, ‘IRP1mut’ and ‘IRP1wt’ tumors were analyzed for IRE-binding activity by EMSA with a 32P-labeled IRE probe in the absence (top) or presence (bottom) of 2% mercaptoethanol (2-ME). Only IRP1/IRE complexes are shown. (B) and (E) Western blot analysis with antibodies against FLAG, TfRI, ferritin, ferroportin and β-actin. (C) and (F) Analysis of aconitase enzymatic activity.
As expected, the increased IRE-binding activity in both ‘IRP1mut’ and ‘IRP1wt’ tumors correlated with upregulation of TfR1 (second panels). Surprisingly, ferritin expression was not repressed (third panels), despite the potent IRE-binding activity. Likewise, there was no difference in the expression of ferroportin (fourth panels), while levels of control β-actin remained unchanged in all tumor samples (bottom panels).
Discussion
HIRP1mut and HIRP1wt cells were utilized to assess whether misregulation of iron metabolism by overexpression of IRP1 affects tumor growth. The previously characterized HIRP1mut cells (13) express the constitutive IRP1C437S mutant under the tight control of a tetracycline-inducible promoter (Figure 1A). Likewise, HIRP1wt cells express wild-type IRP1 in a tetracycline-inducible fashion (Figure 1A). Interestingly, wild-type IRP1 exhibited a robust IRE-binding activity (Figure 1B), which was not further increased by a treatment of cell extracts with 2-ME (bottom panel), known to activate [4Fe-4S]-IRP1 for IRE-binding in vitro (14,15). These findings suggest that the majority of wild-type IRP1 was present in the apoform, even though in the context of a tumor xenograft, a fraction of the overexpressed protein may assemble an iron-sulfur cluster (Figure 6D and F). In conclusion, HIRP1mut and HIRP1wt cells exhibit a similar phenotype with regard to the induction of IRE-binding activity, and thus, IRP1C437S and wild-type IRP1 appear indistinguishable in the model system employed here.
The growth rates of transfected clones did not differ from those of parent cells (Figure 2A), suggesting that the overexpression of active IRP1 (IRP1C437S or wild-type) does not impinge on cell proliferation in vitro. This is consistent with previous findings showing that the growth rates of HIRP1mut cells are unaffected by the presence or absence of tetracycline in the media, to repress IRP1C437S or not (13). The data in Figure 2B and C indicate that high levels of active IRP1 only minimally impair anchorage-independent growth, without affecting the size of the colonies.
By contrast, HIRP1mut and HIRP1wt cells displayed a dramatically reduced capacity to form tumor xenografts in nude mice, compared to parent H1299 cells (Figure 3). Similar differences between in vitro and in vivo growth (in xenograft models) have also been reported for PERK−/− cells, which fail to mount an ‘integrated stress response’ (22). The fact that the IRP1-dependent apparent tumor suppressor phenotype was documented with two independent clones, engineered to express either mutant or wild-type protein, argues against a plausible clonal-specific phenomenon. Importantly, transfected IRP1 was not only expressed at high levels in the tumors at the time when the mice where sacrificed (Figure 6B and E), but also remained highly active in IRE-binding (Figure 6A and D). Taken together, these results strongly suggest that the apparent tumor suppressor phenotype is associated with the high levels of active IRP1.
We reasoned that the IRP1-mediated inhibition of tumor growth in vivo could result in a measurable increase in tumor iron concentration via upregulation of TfR1 and possibly also translational repression of the iron exporter ferroportin; such responses might in turn promote cell damage via oxidative stress (5). However, even though TfR1 levels were indeed elevated in tumors derived from HIRP1mut and HIRP1wt cells and the levels of ferroportin were unaltered (Figure 6B and E), there were no obvious differences in tumor iron content (Figure 5 and data not shown). This finding indicates that the uptake of transferrin-bound iron was not drastically increased in the tumors, despite the upregulation of TfR1. The reason for this is unclear, especially considering that in cultured HIRP1mut cells, increased TfR1 levels stimulated the uptake of 59Fe-transferrin (13).
It should also be noted that ferritin levels were high in the tumors derived from HIRP1mut and HIRP1wt cells (Figure 6B and E), despite the strong IRE-binding activity (Figure 6A and D). Thus, ferritin synthesis apparently evades the control of active IRP1 in the tumor, which is consistent with previous findings in high-density cultures of HIRP1mut cells (13). These in vivo data challenge a widely accepted concept for the translational regulation of ferritin expression (9,23) and suggest that the function of IRP1 as a translational repressor is conditional. Likewise, overexpressed IRP1 apparently failed to inhibit translation of ferroportin mRNA.
Interestingly, the transforming potential of the c-Myc proto-oncogene has been correlated with the suppression of H-ferritin via stimulation of IRP2 expression (24). In light of these findings, it will be important to examine the effects of IRP2 overexpression on ferritin mRNA translation and on the growth of tumor xenografts. A recent report also showed that c-Myc transcriptionally activates TfR1 and thereby promotes growth of cancer cells in vitro and in tumor xenografts (25). Our data imply that the IRP1-mediated activation of TfR1 is not sufficient to elicit such responses. We speculate that other downstream targets of IRP1 may override the stimulatory effects of TfR1 in cell growth.
In summary, our data demonstrate the capacity of IRP1 to suppress tumor growth in vivo, at least in the context of the xenograft model. At present, it is unclear whether IRP1-mediated misregulation of iron metabolism per se accounts for this unexpected phenotype. Alternatively, it is conceivable that the apparent antineoplastic properties of IRP1 may be related to the control of yet uncharacterized gene(s) implicated in cell growth and/or stress responses.
Acknowledgments
We thank Drs Shuo Wang and Antonis Koromilas (Lady Davis Institute for Medical Research) for sharing their expertise with animal experiments. We also thank Dr Manuela Santos (Université de Montréal) for assistance with atomic absorption spectrometry. J.W. was recipient of a fellowship from the Fonds de la recherche en santé du Quebéc (FRSQ). K.P. holds a senior career award from FRSQ. Supported by a grant from the Canadian Institutes for Health Research (CIHR).
Abbreviations
- IREs
iron-responsive elements
- IRP1
iron regulatory protein 1
- 2-ME
2-mercaptoethanol
- PBS
phosphate-buffered saline
- TfR1
transferrin receptor 1
Footnotes
Conflict of Interest Statement. None declared.
References
- 1.Le NT, Richardson DR. The role of iron in cell cycle progression and the proliferation of neoplastic cells. Biochim Biophys Acta. 2002;1603:31–46. doi: 10.1016/s0304-419x(02)00068-9. [DOI] [PubMed] [Google Scholar]
- 2.Kowdley KV. Iron, hemochromatosis, and hepatocellular carcinoma. Gastroenterology. 2004;127:S79–86. doi: 10.1016/j.gastro.2004.09.019. [DOI] [PubMed] [Google Scholar]
- 3.Benhar M, Engelberg D, Levitzki A. ROS, stress-activated kinases and stress signaling in cancer. EMBO Rep. 2002;3:420–425. doi: 10.1093/embo-reports/kvf094. [DOI] [PMC free article] [PubMed] [Google Scholar]
- 4.Toyokuni S. Iron and carcinogenesis: from Fenton reaction to target genes. Redox Rep. 2002;7:189–197. doi: 10.1179/135100002125000596. [DOI] [PubMed] [Google Scholar]
- 5.Eaton JW, Qian M. Molecular bases of cellular iron toxicity. Free Radic Biol Med. 2002;32:833–840. doi: 10.1016/s0891-5849(02)00772-4. [DOI] [PubMed] [Google Scholar]
- 6.Aisen P. Transferrin receptor 1. Int J Biochem Cell Biol. 2004;36:2137–2143. doi: 10.1016/j.biocel.2004.02.007. [DOI] [PubMed] [Google Scholar]
- 7.Hentze MW, Muckenthaler MU, Andrews NC. Balancing acts; molecular control of mammalian iron metabolism. Cell. 2004;117:285–297. doi: 10.1016/s0092-8674(04)00343-5. [DOI] [PubMed] [Google Scholar]
- 8.Arosio P, Levi S. Ferritin, iron homeostasis, and oxidative damage. Free Radic Biol Med. 2002;33:457–463. doi: 10.1016/s0891-5849(02)00842-0. [DOI] [PubMed] [Google Scholar]
- 9.Pantopoulos K. Iron metabolism and the IRE/IRP regulatory system: an update. Ann NY Acad Sci. 2004;1012:1–13. doi: 10.1196/annals.1306.001. [DOI] [PubMed] [Google Scholar]
- 10.Haile DJ, Rouault TA, Tang CK, Chin J, Harford JB, Klausner RD. Reciprocal control of RNA-binding and aconitase activity in the regulation of the iron-responsive element binding protein: role of the iron-sulfur cluster. Proc Natl Acad Sci USA. 1992;89:7536–7540. doi: 10.1073/pnas.89.16.7536. [DOI] [PMC free article] [PubMed] [Google Scholar]
- 11.Guo B, Phillips JD, Yu Y, Leibold EA. Iron regulates the intracellular degradation of iron regulatory protein 2 by the proteasome. J Biol Chem. 1995;270:21645–21651. doi: 10.1074/jbc.270.37.21645. [DOI] [PubMed] [Google Scholar]
- 12.Meyron-Holtz EG, Ghosh MC, Rouault TA. Mammalian tissue oxygen levels modulate iron-regulatory protein activities in vivo. Science. 2004;306:2087–2090. doi: 10.1126/science.1103786. [DOI] [PubMed] [Google Scholar]
- 13.Wang J, Pantopoulos K. Conditional de-repression of ferritin synthesis in cells expressing a constitutive IRP1 mutant. Mol Cell Biol. 2002;22:4638–4651. doi: 10.1128/MCB.22.13.4638-4651.2002. [DOI] [PMC free article] [PubMed] [Google Scholar]
- 14.Philpott CC, Haile D, Rouault TA, Klausner RD. Modification of a free Fe-S cluster cysteine residue in the active iron-responsive element-binding protein prevents RNA binding. J Biol Chem. 1993;268:17655–17658. [PubMed] [Google Scholar]
- 15.Hirling H, Henderson BR, Kühn LC. Mutational analysis of the [4Fe-4S]-cluster converting iron regulatory factor from its RNA-binding form to cytoplasmic aconitase. EMBO J. 1994;13:453–461. doi: 10.1002/j.1460-2075.1994.tb06280.x. [DOI] [PMC free article] [PubMed] [Google Scholar]
- 16.Nie G, Chen G, Sheftel AD, Pantopoulos K, Ponka P. In vivo tumor growth is inhibited by cytosolic iron deprivation caused by the expression of mitochondrial ferritin. Blood. 2006;108:2428–2434. doi: 10.1182/blood-2006-04-018341. [DOI] [PubMed] [Google Scholar]
- 17.Santos MM, de Sousa M, Rademakers LH, Clevers H, Marx JJ, Schilham MW. Iron overload and heart fibrosis in mice deficient for both beta2-microglobulin and Rag1. Am J Pathol. 2000;157:1883–1892. doi: 10.1016/s0002-9440(10)64827-4. [DOI] [PMC free article] [PubMed] [Google Scholar]
- 18.Mueller S, Pantopoulos K. Activation of iron regulatory protein-1 (IRP1) by oxidative stress. Methods Enzymol. 2002;348:324–337. doi: 10.1016/s0076-6879(02)48651-x. [DOI] [PubMed] [Google Scholar]
- 19.Fillebeen C, Caltagirone A, Martelli A, Moulis JM, Pantopoulos K. IRP1 Ser-711 is a phosphorylation site, critical for regulation of RNA-binding and aconitase activities. Biochem J. 2005;388:143–150. doi: 10.1042/BJ20041623. [DOI] [PMC free article] [PubMed] [Google Scholar]
- 20.Kennedy MC, Emptage MH, Dreyer JL, Beinert H. The role of iron in the activation-inactivation of aconitase. J Biol Chem. 1983;258:11098–11105. [PubMed] [Google Scholar]
- 21.Freedman VH, Shin SI. Cellular tumorigenicity in nude mice: correlation with cell growth in semi-solid medium. Cell. 1974;3:355–359. doi: 10.1016/0092-8674(74)90050-6. [DOI] [PubMed] [Google Scholar]
- 22.Bi M, Naczki C, Koritzinsky M, et al. ER stress-regulated translation increases tolerance to extreme hypoxia and promotes tumor growth. EMBO J. 2005;24:3470–3481. doi: 10.1038/sj.emboj.7600777. [DOI] [PMC free article] [PubMed] [Google Scholar]
- 23.Gebauer F, Hentze MW. Molecular mechanisms of translational control. Nat Rev Mol Cell Biol. 2004;5:827–835. doi: 10.1038/nrm1488. [DOI] [PMC free article] [PubMed] [Google Scholar]
- 24.Wu KJ, Polack A, Dalla-Favera R. Coordinated regulation of iron-controlling genes, H-ferritin and IRP2, by c-MYC. Science. 1999;283:676–679. doi: 10.1126/science.283.5402.676. [DOI] [PubMed] [Google Scholar]
- 25.O’Donnell KA, Yu D, Zeller KI, Kim JW, Racke F, Thomas-Tikhonenko A, Dang CV. Activation of transferrin receptor 1 by c-Myc enhances cellular proliferation and tumorigenesis. Mol Cell Biol. 2006;26:2373–2386. doi: 10.1128/MCB.26.6.2373-2386.2006. [DOI] [PMC free article] [PubMed] [Google Scholar]


