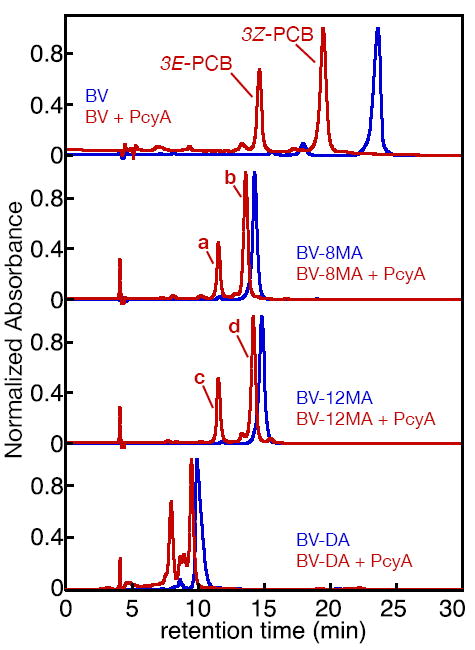
Figure 2.

Reaction of BV with PcyA. BV derivatives were analyzed by RP-HPLC in 50% aqueous acetone/20 mM formic acid either with (red) or without (blue) prior treatment with PcyA. Absorbance at 650 nm was monitored using a diode-array detector. Top, reduction of BV gave rise to a mix of 3E-PCB and 3Z-PCB, as expected (52). Second from top, reduction of BV-8MA gave rise to two product peaks (a and b) identified as 3E-PCB-8MA and 3Z-PCB-8MA, respectively. Third from top, reduction of BV-12MA produced products c and d, similarly identified as 3E-PCB-12MA and 3Z-PCB-12MA. Absorbance spectra for 3E- and 3Z-PCB and products a-d are presented in Supp. Fig. 6, and peak wavelengths are reported in Supp. Table 5. Bottom, reduction of BV-DA by PcyA resulted in formation of several apparent products that were not well resolved in this mobile phase. Further characterization of these products (Supp. Fig. 7) suggested the presence of PCB diamide, but it was not possible to obtain pure products.
