

Abstract
Academic and social success in school has been linked to children’s self-regulation. This study investigated the assessment of the executive function (EF) component of self-regulation using a low-cost, easily administered measure to determine whether scores obtained from the behavioral task would agree with those obtained using a laboratory-based neuropsychological measure of EF skills. The sample included 74 children (37 females; M = 86.2 months) who participated in two assessments of working memory and inhibitory control: Knock-Tap (NEPSY: Korkman, Kirk, and Kemp, 1998), and participation in event-related potential (ERP) testing that included the Directional Stroop Test (Davidson, Cruess, Diamond, O’Craven, & Savoy, 1999). Three main findings emerged. First, children grouped as high versus low performing on the NEPSY Knock-Tap Task were found to performed differently on the more difficult conditions of the DST (the Incongruent and Mixed Conditions), suggesting that the Knock-Tap Task as a low-cost and easy to administer assessment of EF skills may be one way for teachers to identify students with poor inhibitory control skills. Second, children’s performance on the DST was strongly related to their ERP responses, adding to evidence that differences in behavioral performance on the DST as a measure of EF skills reflect corresponding differences in brain processing. Finally, differences in brain processing on the DST task also were found when the children were grouped based on Knock-Tap performance. Simple screening procedures can enable teachers to identify children whose distractibility, inattentiveness, or poor attention spans may interfere with classroom learning.
Academic achievement has become a national priority with increasing visibility. While academic achievement is influenced by many variables, including teacher characteristics and curriculum content, research also points to characteristics of children, such as self-regulation and classroom behaviors, that impact learning in early elementary grades (Blair, 2002; Ladd, Birch, & Buhs, 1999; Nelson, Benner, Lane & Smith, 2004; Van Acker, Grant, & Henry, 1996; Wehby, Symons, Canale & Go, 1998). Self-regulation in particular has been targeted for research because of its link to children’s academic and social success in school (Hongwanishkul, Happeney, Lee, & Zelazo, 2005; Blair & Peters, 2003; Blair & Razza, 2007; Rudasill & Konold, 2008). This study explores the assessment of one component of self-regulation, called executive function skills, using a low-cost, easily administered measure.
Self-regulation is defined as “primarily volitional cognitive and behavioral processes through which an individual maintains levels of emotional, motivational, and cognitive arousal that are conducive to positive adjustment and adaptation” (p. 900; Blair & Diamond, 2008). There are varying conceptualizations of the relationship between self-regulation and executive function. This study is built upon the view that self-regulation includes both temperamental (i.e., effortful control) and cognitive (i.e., executive function) elements (Blair & Razza, 2007; Rueda, Posner, & Rothbart, 2005). Although effortful control and executive function (EF) skills are related both conceptually (Rueda, et al, 2005; Blair & Razza, 2007; Hongwanishkul et al.; Blair & Diamond, 2008) and empirically (Blair & Razza, 2007; Rueda et al. 2005; Hongwanishkul et al, 2005), researchers in the area of self-regulation have identified EF skills as having critical importance for early academic achievement. This study focuses on EF skills in an investigation of two assessment approaches. One approach seeks to determine the usefulness of a low-cost, easily administered measure of EF skills that may be used by regular classroom teachers and the second approach uses a laboratory-based neuropsychological measure of EF skills. In this study, the EF skills of working memory and inhibitory control are specifically investigated. A high level of agreement between the two assessment approaches to these EF skills would mean that teachers could identify students with poor EF skills, allowing them to provide intervention strengthen these skills.
EF skills refer to cognitive processes that control or regulate behaviors and are associated with the ability to persist on difficult tasks, work in the face of distractions, follow classroom rules, inhibit inappropriate behavior, and attend to classroom activities (Alexander, Entwisle, & Dauber, 1993; Blair, 2002; Blair & Diamond, 2008; Kendall, 1993; Veldman & Worsham, 1983). EF skills include attention shifting, working memory, and inhibitory control. However, research points to working memory and inhibitory control in particular as instrumental for young children’s early academic success (Berlin & Bohlin, 2002; Blair & Peters, 2003; Blair & Razza, 2007).
Working memory, the ability to keep information in mind and use it as needed to guide ongoing or later behavior, has been empirically linked to children’s academic and intellectual functioning. Hongwanishkul et al. (2005) found that assessments of preschool children’s working memory were significantly and positively related to their general intellectual functioning. Swanson, Jerman, and Zheng (2008) examined the role of children’s growth in working memory on their ability to accurately solve mathematics problems in early elementary school. Their results indicated that working memory contributes to children’s success in mathematics, even after controlling for children’s skills such as calculation, phonological processing, and processing speed. Passolunghi, Vercelloni, and Schadee (2007) found evidence for a causal relationship between children’s working memory and mathematics abilities in early elementary school. A longitudinal study of native English-speaking children and English language learners revealed that working memory in kindergarten was one of the significant predictors of reading comprehension in fourth grade (Lesaux, Rupp, & Siegel, 2007).
Inhibitory control, the ability to keep irrelevant or distracting information from interfering with performance, is also important to children’s academic achievement. Blair and Razza (2007) report that children’s inhibitory control skills measured in preschool predicted their kindergarten skills in mathematics. When inhibitory control skills were measured in kindergarten, they predicted mathematics and early literacy skills. According to Berlin and Bohlin (2002), measures of inhibitory control in 5-year-old children were positively correlated with teachers’ ratings of behavior problems in the classroom, and Blair and Peters (2003) report that preschool children with higher levels of EF skills had higher teacher ratings of on-task behavior. Conversely, examinations of the performance of school-aged children with reading disabilities revealed difficulties inhibiting distracters during task performance (Brosnan, Hamill, Robson, Sheperd & Cody, 2002) as well as significant deficits in working memory span that impacted word retrieval and sentence processing (Plaza, Cohen, & Chevrie-Muller, 2002; Jeffries & Everatt, 2004).
EF tasks have been described as “factorially confounded” in that multiple cognitive functions are thought to be measured by each task (Fletcher, 1996). In addition, measures of working memory and inhibitory control are reported to show developmental differences in factor structure analyses (Lehto, Puujarvi, Kooistra, & Pulkkinen, 2003; Wiebe, Espy, & Charak, 2007). For example, Wiebe et al. (2007) found scores from 2- to 6-year-old children on measures of working memory and inhibitory control loaded on a single factor, which they labeled “general executive control” rather than on one of three factorial models (e.g., working memory and inhibitory control; working memory, interference from distractors, and proactive interference; and working memory, motor inhibition and cognitive inhibition). In contrast, Lehto et al. found that three separate factors emerged (i.e., working memory, inhibition and attention shifting) in measures of EF skills with 8- to 13-year-old children. Developmental differences in the factor structure that represent different EF tasks is not surprising given the neuroscience findings documenting age-related functional changes in prefrontal and adjacent or associated cortical areas in the brain (Klingberg, Forssberg & Westerberg, 2002; Rothbart, Sheese & Posner, 2007) and behavioral science findings of increasing differentiation of cognitive skills that are reflected in changes in the factor structure with age (e.g., changes in verbal intelligence factors, Molfese, Yaple, Helwig, Harris & Connell, 1992). Changes in synaptogenesis, myelination of fibers, and synaptic pruning occur from infancy through late adolescence (Huttenlocher & Dabholkar, 1997). Other changes noted in brain activation are associated with different task demands and variations in task performance. Changes related to brain structure and function as well as influenced by learning and experience are thought to be reflected in performance differences on the EF tasks.
A variety of tasks are designed to measure the working memory and inhibitory control behaviors hypothesized to underlie EF skills, and some of these tasks intentionally tap both working memory and inhibitory control. For example, Davidson, et al. (1999) modified the Stroop Color Naming Test (Stroop, 1935) to create the Directional Stroop Task (DST) as a test of working memory and inhibitory control for children who may vary in reading skills. The task allows inhibition and demands on holding information in memory to be independently varied. There are three conditions: one in which the child presses a button on the same side of the display that a stimulus appears (Congruent Condition), one in which the child presses a button opposite to the display (Incongruent Condition), and one in which the child responds to randomly ordered presentations of Congruent and Incongruent conditions (Mixed Condition). Another task that taps both working memory and inhibitory control is the Knock-Tap subtest of the NEPSY (Korkman et al., 1998). In this task, children knock with their knuckles on the table or tap with the flat of their palm to match the actions of the examiner or, in the second phase, respond with the opposite action of the action of the examiner and do not respond at all to one action. Tasks such as these are particularly useful with children in the range of preschool to early elementary age where working memory and inhibitory control may reflect on EF factor.
The use of EF skill assessments by teachers has become a topic of interest as evidence of the feasibility and value of these measures for educational purposes accumulates. For example, children’s distractibility, inattentiveness, or poor attention spans can be misattributed to behavior problems (e.g., Attention Deficit/Hyperactivity Disorder [ADHD] or conduct problems), low intelligence (IQ), or to poor school readiness skills (Alloway, Gathercole, Kirkwood & Elliott, 2008). However, assessments of working memory and inhibitory control skills have identified differences between children with deficits in these EF skills compared to children with clinical diagnoses of ADHD and with low IQ (Gathercole, Alloway, Kirkwood, Elliott, Holmes & Hilton, 2008). Alloway et al (2008) reported good validity for scores on a teacher rating scale designed to screen early elementary aged children for working memory problems.
These research findings are important because if assessments of children’s working memory and inhibitory control skills can help teachers identify students with poor EF skills, this affords opportunities for teachers to strengthen these skills. For example, Diamond, Barnett, Thomas and Munro (2007) describe a study using Tools of the Mind, a curriculum designed to improve working memory, inhibitory control and cognitive flexibility skills in young children. In that study, preschool children’s (mean age 5 years) performance after training was better compared to controls on a Stroop-like task called the “Dots task”, which is similar to the DST used in the present study but uses different displays, and on a Flanker task (i.e., a task in which a central target [e.g., a shape] is surrounded or flanked by a distractor [e.g., different shape]). Further, performance of the children who received EF skills training on an early literacy screener (Get Ready To Read; Whitehurst & Lonigan, 2001) was positively correlated with EF task performance. Evidence for the potential benefits of EF skills training also is found in studies by both Morgan, Livesey and Job (1993) and Bierman, Nix, Greenberg, Blair and Domitrovich (2008). Specifically, Morgan et al. reported that the development of inhibitory control skills of preschool and kindergarten children can be accelerated through training. Bierman, et al. showed that performance on tasks reflecting working memory, inhibitory control, set shifting and sustained attention improved across the school year in response to an intervention promoting self-regulation.
The purpose of this research is to investigate the relation between the performance of elementary school children on a working memory and inhibitory control assessment (the Knock-Tap subtest) that could readily be used by teachers in the classroom compared to a laboratory-based assessment that combined information from event-related potentials (ERPs) and behavioral performance on the DST. The ERP technique is an ideal procedure for studying brain-behavior relations because brain processing during actual task performance can be measured to determine how performance on the tasks correspond to the amount of brain activation and how activation is distributed across brain regions. ERP techniques are also ideal to use with children because technological advances have shortened the electrode application time to less than 5 minutes, and actual recording time spans the length of time needed by the child to perform the task. The ERP technique is well tolerated by children and portable ERP systems allow testing to occur in quiet locations in school settings, as was done in this study.
The ERP response itself is a synchronized portion of the ongoing EEG pattern with changes in brain activity over time reflected in the ERP waveform (Molfese, Molfese & Pratt, 2007; Rockstroh, Elbert, Lutzenberger, & Birbaumer, 1982). Changes in portions of the waveform are reported as differences in amplitude or height of the brainwave at different points in its time course or differences in latency (time lapsed since stimulus onset) of specific positive or negative peaks within the waveform. What distinguishes the ERP from the more traditional EEG measures is that the ERP is a portion of ongoing EEG activity of the brain that is time-locked to the onset of a specific event (the stimulus) in the environment. This time-locked feature is a strength of the ERP. EEG activity reflects a wide range of neural activities related to the myriad of neural and body self-regulating systems as well as the various sensory and cognitive functions ongoing in the brain at that time. However, this intermixing of cognitive, sensory, and other biological signals in the EEG makes it difficult to separate one dimension from another. On the other hand, because the ERP is time-locked to the onset of an event, researchers can evaluate the relationship between this neuroelectrical response and that event. The temporal event related specificity of the ERP technique represents a major advantage over the traditional EEG measures as well as other imaging techniques, such as fMRI and MRI (Cacioppo, Tassinary & Berntson, 1990; Papanicolaou, 1998).
ERP responses allow researchers to examine direct relations between changes in brain activation from different electrode regions that may originate from different brain areas and the behavioral measures of interest. There are many different approaches used for electrode placement on the scalp but placement is usually based on hypotheses concerning the relation between different anatomical brain regions and the cognitive processes assumed to be engaged by the evoking stimulus and the characteristics of the experimental task (Molfese, Molfese & Kelly, 2001). In this study, high-density array nets with 128 electrodes were used to sample the ERP activity that was then averaged together within scalp regions for each hemisphere representing frontal, central, temporal, parietal and occipital areas. This step was taken to facilitate the comparison between different brain regions during the EF tasks. For example, Rueda, Posner and Rothbart (2005) compared ERP responses of 4-year-old children and adults on a flanker task, an EF task tapping executive attention. While typical developmental differences between children and adults in amplitude and latency were found, important similarities in the activation of frontal and parietal electrode regions were reported along with developmental differences in the broader distribution of activation within brain regions in the children.
While the brain regions involved in EF tasks are well studied (Diamond, 2002), most brain imaging studies have been done with adults. Findings from these studies as well as some of the more recent studies with children have pointed to regions of the frontal and prefrontal cortex along with other brain regions as being involved depending on the EF task. For example, Fan, Flombaum, McCandliss, Thomas and Posner (2003) used fMRI techniques with adults to show that the Stroop Color task and the Flanker task, both of which involve conflicts between the stimulus dimensions upon which response decisions are based, activate common brain regions in the dorsal anterior cingulate and prefrontal cortex as well as unique regions linked to the requirements of the different tasks. Anatomical and biochemical changes in the prefrontal cortex between 3 and 7 years of age have been hypothesized to result in improvements in performance on “cool” or cognitive aspects of EF tasks and on “hot” or affective aspects of EF tasks. Such changes in behavioral performance on these tasks are hypothesized to reflect developmental changes in brain regions, but more developmental studies involving brain imaging techniques and different ER tasks with children in this age range are needed to investigate these hypotheses (Hongwanishkul, Happaney, Lee & Zelazo, 2005).
Of particular interest in the present study are the known differences in ERP activation patterns that are related to skill and experience. In the early stages of skill development, the distribution of activation across different brain regions is unstable, with temporal links between different regions changing from one trial to the next. We believe this instability contributes to inefficient processing which leads to longer response times and less accurate performance. However, with experience and learning, the links between different regions restructure into more efficient networks. Such restructuring moves processing from widely distributed and unstable spatial and temporal networks between brain regions towards more stable network that utilize areas that relate to each other in relatively stable and efficient ways. In turn, behavioral performance improves in accuracy and speed, and perhaps moves more towards some level of automaticity. The performance of children that is less accurate and slower may reflect difficulty in making the transition from engaging numerous spatially and temporally distributed neural sources to smaller, more efficient functional units. Consequently, each encounter with task demands such as those involved with EF tasks places greater demands on their neural system than those seen with children with better performance. Mayes, Molfese, Key and Hunter (2005) report evidence of differences between behavioral performance on the Stroop test and differences in distribution of brain processing regions. Children 7- to 9-year-old who were prenatally cocaine-exposed (CE) or non-drug-exposed (NDE) participated in a study involving ERP techniques similar to those reported in the present study as well as in a Stroop test. Cocaine-exposed children generated slower and prolonged ERP responses while engaging more brain regions (suggesting more diffuse brain processing) while the non-exposed children produced briefer ERP responses from a more discrete set of electrode sites. Group differences were also indentified in which the non-exposed children showed activation in the frontal region that differentiated between inhibition and control conditions, while cocaine-exposed children showed more activation over central regions. Thus, imaging techniques can be used to study brain processing in children with different clinical characteristics and with different behavioral performance levels.
The goal of this investigation is to compare the results of two assessment approaches for working memory and inhibitory control EF skills in typically developing children without clinical-level symptoms of ADHD, low intelligence or learning disabilities. The purpose was to determine the usefulness of the scores obtained using the NEPSY Knock - Tap behavioral assessment and the brain-behavior assessment using the DST for identifying typically developing children with poor (or relatively poor) EF skills. It was expected that the EF skills of the children on the NEPSY would be good, but that a subset of children could be identified with poor performance. Performance of the children on the DST was expected to be more variable due to the more complex task demands of the task, particularly on the Mixed Condition and the computer-based administration. Differences in DST performance were expected to relate to differences in ERP responses. The ERP responses of better performing children were expected to discriminate between conditions while the poorer performing children were not expected to generate such differences, thereby indicating differences in neural processing.
Methods
Participants
Children in the current study were typically developing and comprised a subset from a group of 255 children recruited through public and private elementary schools as part of a larger study of sleep habits and cognitive processing. The identification of children for participation in this study is described below. The sample included 74 children who had been randomly assigned to the control condition of the larger study. The participants (37 females) ranged in age from 72 to 106 months (M = 86.2 months, SD = 9.95 months), with 36 6-year-olds, 20 7-year-olds, and 18 8-year-olds. All participants were typically developing children (Peabody Picture Vocabulary Test, Dunn & Dunn, 1997: M = 105.17, SD = 10.17, range = 86–130) who spoke English as their native language. Of all participants, 65% were Caucasian, 30% were African-American, and 5% constituted other racial/ethnic groups. Total family income ranged from $5,000 to over $50,000, with 70% reporting incomes above $50,000. Five families did not report their family income
Children with previously diagnosed medical, neurological, and/or learning disorders were excluded from the study. Exclusion was based on parental responses to a screening questionnaire of the child’s medical and psychological history. To screen for psychiatric diagnoses, the Early Childhood Inventory 4 (ECI-4): Parental Checklist (Sprafkin, Gadow, Salisbury, Schneider, & Loney, 2002) was used for children ages 4 to 6 years of age, and the Child Symptom Inventory 4 (CSI-4: Gadow & Sprafkin, 1994) was used for children ages 7 and 8 years of age. Children who scored below 75 (less than one standard deviation below the standardized mean) on the Peabody Picture Vocabulary Test (PPVT) were excluded. Additional exclusionary criteria included: medication use within three days of beginning participation or at any point during participation in the study, and/or obesity (an exclusionary criterion for the larger study). Obesity was defined by a body mass index greater than 95th percentile on the National Center for Health Statistics curve (Hammer, Kraemer, Wilson, Ritter, & Dornbusch, 1991).
All participants were administered vision and hearing tests to ensure that their vision and hearing were within normal limits so that they could adequately see and hear the presented stimuli. In addition, each ear was checked for fluid levels using a middle ear screening device (EarCheck® Middle Ear Monitor). In total, 74 children met the criteria for inclusion while 21 potentially eligible children were excluded: 1 due to a failed hearing tests, 3 due to medication use, 4 due to PPVT scores below the cutoff, and 13 due to artifact contamination in the EEG data.
Measures
Executive function assessments
Two neuropsychological assessment tasks of executive function were used in the present study. The Knock-Tap subtest served as one measure of working memory and inhibitory control and was administered according to the standard procedure. The Neuropsychological Assessment (NEPSY: Korkman et al., 1998) is designed as a comprehensive assessment examining the general neuropsychological development of children ages 3- to 12-years of age. The Knock-Tap subtest is specifically designed for children from the ages of 5 through 12 years and is an adaptation of tasks used by Luria (1966). Other researchers have used tasks with similarities to the Knock - Tap task (e.g., Hughes, 1996; Diamond, Prevor, Callender, & Druin, 1997; Diamond & Taylor, 1996) with young children, but the Knock - Tap task differs by also including a response series requiring more than an opposite response. Knock-Tap contains two series of 15 items. For Series 1, the child is required to knock with their knuckles on the table or tap with the flat of their palm that is the opposite action to that of the examiner (e.g., child knocks when the examiner taps). Thus, in Series 1 children were required to remember a rule (use the response that is opposite to the examiners response). Series 2 requires the child to knock or bang with the side of the fist or do nothing in response to different actions by the examiner (e.g., the child knocks when the examiner uses the side fist, bangs with the side fist when the examiner knocks, and does nothing when the examiner taps). In Series 2, the children were required to remember new rules related to two actions of the examiner and inhibit their response for the third action. Korkman (personal communication, 2009) observes that with groups of typically developing children, Knock - Tap scores may not show a lot of variablity in the age range studied here and a subtest score is not, in itself, an adequate basis for forming a clinical diagnosis. However, performance differences in children with inhibition or EF problems can be observed at these ages. With the mix of children present in general classrooms, it was expected that the Knock - Tap could identify a subset of children with poorer performance compared to other children. The Cronbach’s alpha for the Knock-Tap for this sample was α = 0.86, indicating high correct responding across children.
The DST (Davidson et al., 1999) also served as a test of working memory and inhibitory control. This task included three consecutive computer-based blocks of Congruent, Incongruent, and Mixed conditions. The Congruent and Incongruent blocks each consisted of 34 trials, including four practice trials at the beginning of each block. The Mixed block included 64 trials, including four practice trials. Children demonstrated understanding of instructions by successfully completing the practice trials; if the practice trials were completed incorrectly, instructions were repeated and further elaborated. As each trial within a condition began, a fixation point appeared at the center of a computer screen, followed by a randomly varied inter-stimulus interval (between 1800 and 2800 ms), followed in turn by a stimulus presentation. The two stimuli included a solid gray circle or a black and white vertically striped circle. On any one trial, a stimulus appeared to the left or right of a center fixation point and within each block of trials, stimuli appeared equally often on each side of the fixation point. When a stimulus appeared, participants pressed one of two buttons on a response pad. The “Congruent” Condition included the appearance of, for example, a gray circle, with participants instructed to “push the button on the side of the response box that is on the same side where the circle appears on the computer screen”. Thus, performance required children to remember a rule (press the button on the same side as the dot appears). The “Incongruent” Condition included a different stimulus, a striped circle, with children instructed to “push the response button that is on the opposite side from the striped circle”. Performance required children to remember the rule (press the button on the opposite side as the dot appears) and inhibit the response to press the button on the same side where the dot appears. The order of the Congruent and Incongruent Condition blocks and the assignment of the striped and gray circles were counterbalanced across participants and sex. The “Mixed” Condition always occurred last and included both types of stimuli from the first two blocks, presented in a randomly varied order. Children followed the same response rules as for the first two blocks. This ‘“Mixed” Condition was expected to place demands on working memory (remember the rule), inhibition (inhibit pressing the button until the type of circle is known) and cognitive flexibility (switch responses between two different conditions). Stimuli were counterbalanced across conditions and across children. The inter-block interval ranged in duration from 1.5 to 2.5 minutes. Correct responses, rather than reaction time, were recorded consistent with Diamond, et al (2007) and previous work with this task when combined with ERP recording techniques (Mayes, et al, 2003). Reaction time could not used as a response measure because participants’ responses were delayed until a question mark appeared on the computer screen. This delay helped to reduce movement artifacts that otherwise might be generated by the response movement and thereby interfere with ERP recording.
ERP recordings were made using a Net Amps 200, high impedance amplifier with 128 channels from Electrical Geodesic (EGI, Inc., Eugene, OR). EEG signals were recorded using EGI’s proprietary Net Station software (version 4.2) running on a PowerMac G5 computer using Apple Mac OS X 10.4.4. Stimulus presentation was handled by E-PRIME version 1.2 (PST, Inc.), running on a Dell PC, using Microsoft Windows XP with Service Pack 1. Communication between the two computers was handled by a combination of an Ethernet (CAT-5) cable and a PCI-ribbon-cable interface that insured millisecond accuracy for stimulus presentation.
Procedures
The current study was reviewed and approved by the Institutional Review Board at the University of Louisville. Testing occurred primarily on school premises in a quiet room, although some children came to the university laboratory for testing based on the parents’ schedule. All participants were scheduled for two sessions. At the first session, the examiner administered the PPVT, a hearing air conduction threshold screening test and a visual acuity test while the participant’s parent or legal guardian filled out the ECI-4 or CSI-4 form. Children who were not identified as having meet exclusionary criteria returned for a second session, one week after the first session. At the second session, the examiner administered an ear check, followed by the NEPSY Knock-Tap subtest, followed by an event-related potential (ERP) that included the DST.
During the ERP portion of the session, standard electrode application procedures were used (Molfese, Molfese, & Kelly, 2001). In applying the electrode nets, the examiner measured the circumference of the child’s head in order to determine the appropriate sized electrode net and marked reference points to aid in the correct placement of the net. A 128-electrode geodesic high-density array net (EGI, Inc.) was soaked in a warm potassium chloride solution to improve electrode conductance, and then placed on the child’s head. Electrode impedances were adjusted for each child to be below 40 kOhms before testing began and measured again after the testing session to verify the impedances had not changed. Ongoing EEG activity was monitored throughout the testing session using a real-time waveform display. Stimulus presentation was temporarily suspended if two successive trials were contaminated with artifacts. Testing was resumed following two artifact-free seconds of EEG. A computer monitor was positioned 1 m directly above the vertex of the child’s head using a plumb line. Likewise, a computer monitor was centered at eye-level 1m directly in front of the seated child. Once the child was ready for testing, the lights in the room were dimmed, and instructions for the DST were administered. The average duration of the test was approximately 20 minutes across children.
Results
Data analyses involved three phases: (1) analyses of children’s performance on the two behavioral assessment measures (NEPSY Knock-Tap and the DST); (2) analyses of the ERP data collected in response to the visually presented DST; and (3) analyses of brain responses during the DST task based upon performance on the Knock-Tap Task.
Analyses of children’s behavioral performance on NEPSY Knock-Tap and the DST
The means, ranges, and standard deviations of performance on the NEPSY Knock-Tap and DST are presented in Table 1. The mean NEPSY Knock-Tap scores for Series 1 and Series 2 were similar, but a larger range of scores occurred for Series 1 compared to Series 2, possibly reflecting increased familiarity with the task. On Series 2 which requires more EF skills, 12 of the 74 children performed ≥1 standard deviation below the mean (M=14, SD=.92). All of these 12 children performed poorer on Series 2 compared to Series 1 with the exception of one child who performed poorly on both Series. The descriptive statistics for the DST scores show differences in the DST performance of the 12 children with low Knock-Tap scores compared to the 62 children higher Knock-Tap scores. Both groups perform better on the Congruent trials than Incongruent trials. There were no significant differences between the groups for the Congruent trials, but, there were significant differences on Incongruent trials (F(1, 72)=7.46, p=0.0079). On the Mixed trials, children with low Knock-Tap scores had lower scores than the children with higher Knock-Tap scores. While the differences were not significant at conventional levels (F(1, 72)=3.80, p=0.0552), the effect size, or strength of the group difference, is large (Cohen’s D = 1.93)
Table 1.
Raw Scores and Percent Correct for EF Measures
| Measure | High K-T Performing Sample (N = 62) |
Low K-T Performing Sample (N = 12) |
||||||
|---|---|---|---|---|---|---|---|---|
| Raw Scores | % Correct | Raw Scores | % Correct | |||||
| M | SD | M | SD | M | SD | M | SD | |
| NEPSY | ||||||||
| Knock-Tap | ||||||||
| Series 1 | 14.50 | 1.10 | .97 | .07 | 13.75 | 1.60 | .92 | .11 |
| Series 2 | 14.74 | .44 | .98 | .03 | 12.5 | .51 | .84 | .04 |
| Directional Stroop | ||||||||
| Congruent | 28.77a | 1.63 | .96 | .05 | 27.83a | 3.30 | .93 | .11 |
| Incongruent | 27.52b | 3.27 | .82 | .11 | 24.42b | 5.04 | .81 | .17 |
| Mixed | 51.08c | 9.66 | .85 | .16 | 44.58c | 14.61 | .74 | .24 |
Note: a, b, and c notations denote results from tests of statistical difference between means
F(1, 72) = 2.27, p = 0.14, Cohen’s d = .36
F(1, 72) = 7.46, p = 0.008, Cohen’s d = .73
F(1, 72) = 3.80, p = 0.06, Cohen’s d = .52
Analyses of the ERP data collected in response to the visually presented DST
ERP data were pre-processed using Net Station (EGI, Inc.) version 4.2 following standard processing procedures commonly used in the field (Molfese, Molfese, & Kelly, 2001). Data were filtered offline from the original bandpass of 0.1–100Hz to a bandpass of 0.1–30Hz. The filtered data were then segmented into epochs based on stimulus onset with a pre-stimulus baseline period of 100 milliseconds and a post-stimulus interval of 1000 milliseconds. The data were then scanned for artifacts (eye blinks, eye movements, electrode noise) using a semiautomated artifact rejection algorithm. Epochs containing eye blinks or eye movements defined as spikes in the EEG as monitored at the eye channels that exceeded 150μV were removed from further analyses. Poor or distorted EEG signals at specific electrode sites that occurred on more than 10% of all trials were replaced using spherical-spline interpolation (as recommended by Picton, et al., 2000). Rejection rates were comparable across groups and stimulus conditions. The remaining data were baseline corrected to the 100 msec baseline prior to stimulus onset and re-referenced to the average reference before being averaged separately for each condition type (Congruent, Incongruent, Mixed).
Next, all data from individual electrodes were averaged within each scalp region (five scalp regions for each hemisphere: frontal, central, temporal, parietal and occipital). This approach represented a modification of the clusters proposed by Curran (1999), but modified such that the average of the 10 regions equaled zero (Molfese et al., 2006). The group averaged visual ERPs elicited during the shape matching task are displayed in Figure 1.
Figure 1.
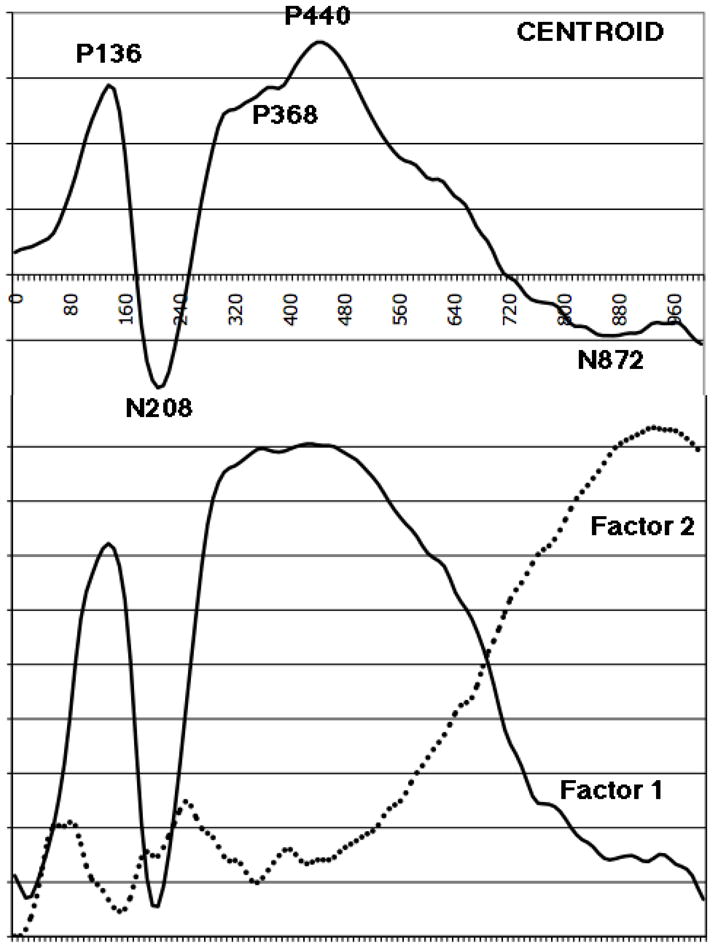
Centroid or Grand Average ERP for the Entire Data Set and the Two Factors Sensitive to DST Condition Effects
At the top of Figure 1, five major peaks are evident in the grand average ERP for the participant sample. These include an initial positive peak that reached its maximum positive value at 136 ms (P136), followed by a subsequent large negative peak at 208 ms (N208), a later occurring positive peak at 368 ms (P368), which was then followed by a larger positive peak at 440 ms (P440) that interrupted briefly a slow negative shift in polarity that peaked at 872 ms (N872) and then continued to the end of the data window at 1000 ms.
The remaining analyses involved several steps. First, 1000 ms of the ERP signal following stimulus onset for each of the 1,480 averaged ERPs (74 children × 2 stimulus conditions × 10 scalp regions) were submitted to a temporal Principal Components Analysis (PCA). The 125 time points (representing data time points sampled at 8 ms intervals) were treated as variables. This sampling rate is typical for ERP studies when higher sampling rates are not needed for optimal analyses. The resulting factors were rotated using Varimax rotation. The 1,480 individual ERPs were treated as cases. A series of orthogonally rotated factors (using Varimax rotation) identified regions of variability within the 1,000-ms post stimulus onset interval. A Scree test (Cattell, 1966) identified the number of factors for subsequent analyses. The factor scores (weights) from the PCA were submitted to an Analysis of Variance (ANOVA) to identify sources of variability in the ERPs. The ANOVA design used DST (2: Low, High) as a between-subjects measure and within-subjects measures of repeated measures for the DST Stimulus Condition (2: correct scores to Congruent and Incongruent presentations during the Mixed Condition), Electrode Region (5: Frontal, Central, Temporal, Parietal, and Occipital) and Hemispheres (2: Left, Right) using the Greenhouse-Geisser correction. Paired t-tests were calculated to assess significant interactions. These analyses were designed to determine whether the low versus high performing groups on the DST generated ERPs that discriminated between the Congruent and Incongruent trials of the mixed condition.
This analysis approach has proven successful in identifying regions of the ERP waveform where the majority of the variability occurred, and in determining if the variability characterized by the different PCA extracted factors resulted from systematic changes in the independent variables under investigation (Rockstroh, Elbert, Birbaumer, & Lutzenberger, 1982). When questions are raised regarding misallocation of variance in a PCA analysis across immediately adjacent peaks, Wood and McCarthy (1984) noted that traditional amplitude and latency approaches are as “subject to the problem of component overlap” (page 258, Chapman & McCrary, 1995; see also Beauducel & Debener, 2003, page 112).
The temporal PCA characterized 86.39% of the total variance in the data set using four factors, each of which was composed of 125 factor loadings (8 ms samples over a 1000 ms epoch). Four factor values were identified that corresponded to the variability characterized by four specific regions within the ERP waveforms. The four separate ANOVAs (one per factor) then were used to examine the relation between the ERP data and performance on the mixed condition of the DST. DST performance was divided based on a low group (N=11) defined by ≤ 1 standard deviation below the mean (scores ranged 18 to 31) and the high group (N = 63) was defined as ≥1 standard deviation below the mean (scores ranged 41 to 60). The first factor identified an Electrode × Group interaction F(4, 292)=52.88, p<0.0001, indicating that children in the high DST performance group processed information during the task using different brain regions than children with low DST performance. No other main effects or interactions were significant for this factor. A similar pattern was shown in Factor 3, with only an Electrode × Group interaction F(4, 292)=5.57, p=0.0058. Conversely, the second factor identified an interaction of Group × Condition (Congruent vs Incongruent), F(1, 73)=6.39, p=0.0137. This was in addition to a Group × Electrode interaction F(4, 292)=4.90, p=0.0096 and a Group × Condition × Electrode interaction, F(4, 292)=3.17, p=0.0456. This interaction was followed up by separate repeated-measures ANOVAs for both the high and low groups separately. No significant effects were shown for the low scoring DST group. However, the high scoring DST group showed main effects for Condition, F(1, 62)=14.00, p<001, and a main effect for Electrode, F(4, 248)=9.88, p<0.0001. The Condition effect reflected a positive voltage response to Inconguent trials (mean = .034) and a negative response to the Congruent trials (−.045). These effects were clarified by a Condition × Electrode interaction, F(4, 248)=5.70, p=0.0050. No other significant effects or interactions were significant for this factor. No significant main effects or interactions were found for the fourth and last factor.
Analyses of brain responses during the mixed condition of the DST task based on performance on the Knock-Tap Task
These analyses were designed to examine whether group differences in brain responses to the Congruent and Incongruent trials of the mixed condition could be identified when the children were grouped based on their Knock-Tap performance. In these analyses, the 12 low scoring children are compared to the 62 high scoring children. Repeated-measures ANOVAs used 2 (group: high Knock-Tap vs. low Knock-Tap) × 2 (condition: Congruent vs. Incongruent) × 2 (hemisphere: left vs. right) × 5 (electrode: frontal, central, temporal, parietal, and occipital). One analysis was performed for each of two factors as identified by the temporal PCA. The first factor identified a significant Electrode × Hemisphere × Group Interaction F(4, 292)=3.01, p=0.04. There were also lower level interactions including Electrode × Group and Hemisphere × Group. The three-way interaction was divided into two follow-up ANOVAs for each of the two levels of group. These follow-up repeated-measures ANOVAs show that the three-way interaction was driven by significant Hemisphere × Electrode interaction F(4, 244)=3.71, p=0.02 in the high group, which was not present in the low-scoring Knock-Tap group. Instead, the low-scoring group showed only an Electrode effect F(4, 44)=19.54, p<0.001. The second factor identified a significant Condition × Electrode × Group interaction F(4, 292)=5.72, p=0.004, as well as two smaller interactions, involving Condition × Group and Electrode × Group. This three-way interaction was followed with two separate repeated-measures ANOVAs at each level of group. Follow-up ANOVAs indicated that the three-way interaction was driven by the high scoring Knock-Tap group and represented by a 2-way interaction between Condition × Electrode, F(4, 244)=4.83, p=0.01, in which responses at left and right central scalp regions discriminated between the Congruent and Incongruent trials, t(61)=3.46, p<.001, and between Electrode × Hemisphere, F(4, 244)=2.80, p=0.04, at occipital left and right regions, t(61)=−2.14, p<.036 and t(61)=−2.57, p<.012, respectively, that were not present in the low scoring Knock-Tap group. The low scoring Knock-Tap group showed no significant effects.
Discussion
The research reported here utilized three different procedures to study the relations between neural responses as indexed by ERPs and behavioral performance on two working memory and inhibitory control tasks. More specifically, we investigated the congruence in performance between the NEPSY Knock-Tap Task, the Directional Stroop Task (DST), and ERPs recorded during DST performance. Three main findings emerged. First, children identified as high or low performing on the NEPSY Knock-Tap Task were found to also perform differently on the more demanding conditions of the DST (the Incongruent and Mixed Conditions), suggesting that the Knock-Tap Task as a low-cost and easy to administer assessment of EF skills is a valid way for teachers to identify students with poor inhibitory control skills. Second, children’s performance on the DST was related to their ERP responses, adding to evidence that differences in behavioral performance on the DST reflect corresponding differences in brain processing. Third, when children were grouped based on their Knock-Tap performance (high and low), group differences in their brain responses to the DST also were identified. Children performing better on the Knock-Tap and the DST tasks reliably generated ERP responses that discriminated between the Congruent and Incongruent conditions of the DST while children who performed one standard deviation below the mean on these tasks generated ERP responses that did not discriminate between conditions.
Differences in performance by the two groups of children on the two EF tasks are interpreted as reflecting differences in the children’s skills in remembering rules and inhibiting responses. While the low Knock-Tap performing group performed as well as the high performing group on the easier DST Congruent Condition, their correct performance was lower on the Incongruent Condition and lower still on the Mixed Conditions. The high accuracy rates noted for high performing children on both Series of the Knock-Tap task suggest that most children between the ages of 5 and 8 years of age do not find these tasks particularly challenging. However, the performance of 12 children in our sample who scored 1 standard deviation or more below the mean on this task shows that there are children within this sample of typically developing children with poorly developed working memory and inhibitory control skills. It is these children that the Knock-Tap was designed to identify and, when identified, present opportunities for teachers to provide the intervention and training needed to strengthen these skills. It is often argued that the early application of interventions to strengthen weak skills could prevent these skills deficits from reaching clinical levels. This study reflects one step toward the goal of bringing such strategies for early identification into the classroom.
Identification must be paired with intervention and there is evidence of effective interventions targeting the EF skills of young children. As noted in the work by Diamond and colleagues (2007), executive function skills involving working memory and inhibition can be strengthened through training. For example, more preschoolers in classrooms using the Tools of the Mind curriculum (Bodrova & Leong, 2007) performed correctly on the DST Mixed Condition compared to children in the “business as usual” curriculum classrooms. By using modeling and scaffolding to guide preschool children’s learning, teachers using the Tools of the Mind curriculum appeared to facilitate children’s working memory and inhibitory control. There are also reports of other interventions that successfully improve EF skills. For example, Dowsett and Livesey (2000) reported improvements in inhibitory control in preschool children participating in a training condition involving practice on EF tasks that were not specifically tapping inhibitory control, such as attention control, representational flexibility, working memory, and error correction. Posner and Raichle (1994) proposed a model of attention involving alerting, orienting and executive control. Attention Training tasks were developed to target these attention skills. Positive changes in attention skills are reported in studies of both preschool and school age children, including children at risk for or with ADHD, arising from the use of these training tasks (Tamm, McCandliss, Liang, Wigal, Posner, & Swanson, 2007).
The current study used the NEPSY Knock-Tap task as an assessment of working memory and inhibitory control. However, there are assessments of these and other EF skills that can be readily learned and administered in educational settings. For example, the Walk-A-Line Slowly task (Kochanska, Murray, Jaques, Koenig & Vandegeest, 1996) has the child walk along a 6 foot line first at normal speed and then as slowly as possible. This task measures inhibitory control. There are several versions of the Continuous Performance Test (CPT) that measure inhibitory control and sustained/selective attention. The CPT requires the child to respond only when they see or hear a target stimulus (e.g., a letter, number, or symbol) in a series of stimuli and not to respond to any other stimulus. The Behavioral Rating Inventory of Executive Function (BRIEF, Gioia, Isquith, Guy, & Kenworthy, 2000) is a teacher and parent rating scale that can be used to measure children’s EF skills in behavioral regulation, set shifting, inhibitory control and skills in initiating, planning, organizing, self-monitoring, and working memory. This comprehensive scale or any of the assessment described above could be used by teachers as measures of children’s EF skills to inform instruction.
ERP Responses and EF Task Performance
The two sets of ERP analyses, one with children grouped based on DST performance and the second with children grouped based on Knock-Tap performance, produced converging results. The ERPs clearly discriminated between Congruent and Incongruent trials and between high scoring and low scoring children. The high performing children consistently generated ERPs that reflected differences in brain processing that were sensitive to task conditions (Congruent vs Incongruent) that were not found in the ERP responses of the lower performing children. These findings reinforcing the notion that very different neural processing was occurring during task performance by the high performing children that was not similarly occurring for the low performing children.
Interestingly, the discrimination of Congruent from Incongruent trials by the high group was detected by electrodes placed over different areas of the scale, but particularly in central and occipital regions. These findings are consistent with studies of brain processing to visually presented stimuli and to results reported by Mayes, Molfese, Key and Hunter (2005) with 7- to 9-year-olds in performing a Stroop task. Finding such as these show that brain regions other than the frontal or prefrontal cortical regions commonly associated with EF tasks are activated during EF task performance. Indeed, investigators using neuroimaging techniques to study EF task performance regularly describe neural networks that map task performance onto multiple brain areas. As noted earlier, Fan, et al (2003) study with adults showed that a Stroop Color task and a Flanker task activated dorsal anterior cingulate and prefrontal cortex as well as regions linked to the requirements of the different tasks. Posner and his colleagues (Fan, McCandliss, Fossella, Flombaum, & Posner, 2005; Rothbart, Sheese & Posner, 2007), in studying brain processing during attention tasks, suggest the involvement of multiple neural structures that are not restricted to the frontal lobes but include the superior parietal and temporal parietal regions as well as the frontal eye fields and the superior colliculus. These findings reinforce the view that brain processing during cognitive tasks involves neural networks distributed across the different brain regions that are recruited to process the different components of tasks, such as, visual, language, problem solving, inhibition elements. It is the differences in specific brain regions recruited across time during task performance and in the level of processing effort reflected in the amplitudes of the brain waves that differentiate between different levels of task performance.
Limitations
Three limitations to the current study warrant mention. First, although the sample comprised children of various backgrounds, the sample was somewhat homogeneous and was not recruited to represent the population of children with learning disabilities or behavioral problems. Future work with more diverse samples of children would help validate finding reported here and determine if the findings can be applied to broader samples of children and/or to samples with specific learning or behavioral problems. Second, only two assessments of EF skills were used and the administration methods used with these assessments were different. Indeed, while both assessments involve inhibitory control, Knock-Tap is administered by an examiner and is an appealing and engaging yet structured activity while the DST is computer-based with a more controlled presentation pace. Thus, these assessments must not be assumed to be interchangeable. Consideration should be given to using more assessments so that task performance can be compared and so that it can be determined how administration methods might influence performance. Third, the ceiling effect of the Knock-Tap test may have affected the findings. Assessments should be considered that are standardized, as is the NEPSY, but have a broader range of challenging tasks suitable for children in this age range.
Implications and future directions
As indicated earlier, findings from this study have implications for teacher practice. Because our study suggests that the DST is a valid measure of certain executive function skills (i.e., inhibitory control), and there is a reasonable agreement between children’s performance on the DST and the Knock-Tap, we can conclude that the Knock-Tap could be used as an easy and accurate way to identify students who might benefit from training or intervention to develop stronger inhibitory control skills. Armed with this type of assessment, teachers will be able to target their instruction to better meet the needs of individual students in the classroom. This is particularly critical in early elementary school when children’s ability to adjust academically and socially to formal school sets the trajectory for later achievement (Alexander, Entwisle, & Dauber, 1993; Entwisle, Alexander, & Olson, 2005).
Future research should include examinations of the DST and Knock-Tap in different populations and across time. Findings from this study can be extended by investigating the congruence between ERP responses, DST performance, and Knock-Tap performance with different age groups - for example, changes in EF performance by younger (e.g., preschool), middle (early elementary) and older (e.g., high school) students. As research shows that executive function skills develop and change with maturity (Lehto, Puujarvi, Kooistra, & Pulkkinen, 2003; Wiebe, Espy, & Charak, 2007), it is important to understand that the relationships between ERP responses, the DST, and Knock-Tap may change as children age. Variables other than age that influence changes in EF skills that are associated with schooling and classroom processes are also critical for understanding the interactions between EF skills and classroom learning.
Another natural extension of this study is to apply findings regarding the validity of DST and Knock-Tap performance for assessing executive function skills to a real-world intervention designed to improve executive functioning in young children. That is, results from this study point to the importance of examining DST and Knock-Tap performance as indicators of executive function skill improvement after a targeted intervention, such as Tools of the Mind curriculum (Diamond et al., 2007). However, it may be more feasible to consider ways to add components targeting EF skill learning to existing curricula in schools and classrooms rather than working to have schools adopt a new curriculum.
Footnotes
Publisher's Disclaimer: This is a PDF file of an unedited manuscript that has been accepted for publication. As a service to our customers we are providing this early version of the manuscript. The manuscript will undergo copyediting, typesetting, and review of the resulting proof before it is published in its final citable form. Please note that during the production process errors may be discovered which could affect the content, and all legal disclaimers that apply to the journal pertain.
References
- Alexander KL, Entwisle DR, Dauber SL. First-grade classroom behavior: Its short- and long-term consequences for school performance. Child Development. 1993;64:801–814. [PubMed] [Google Scholar]
- Alloway T, Gathercole S, Kirkwood H, Elliott J. The working memory rating scale: A classroom-based behavioral assessment of working memory. Learning and Individual Differences. 2008;19:242–245. [Google Scholar]
- Beauducel A, Debener S. Misallocation of variance in event-related potentials: simulation studies on the effects of test power, topography, and baseline-to-peak versus principal component quantifications. Journal of Neuroscience Methods. 2003;124:103–112. doi: 10.1016/s0165-0270(02)00381-3. [DOI] [PubMed] [Google Scholar]
- Berlin L, Bohlin G. Response inhibition, hyperactivity and conduct problems among preschool children. Journal of Clinical Child Psychology. 2002;31:242–251. doi: 10.1207/S15374424JCCP3102_09. [DOI] [PubMed] [Google Scholar]
- Bierman K, Nix R, Greenberg M, Blair C, Domitrovich C. Executive functions and school readiness intervention: Impact, moderation and mediation in the Head Start REDI program. Development and Psychopathology. 2008;20:821–843. doi: 10.1017/S0954579408000394. [DOI] [PMC free article] [PubMed] [Google Scholar]
- Blair C. School readiness: Integrating cognition and emotion in a neurobiological conceptualization of children’s functioning at school entry. American Psychologist. 2002;57:111–127. doi: 10.1037//0003-066x.57.2.111. [DOI] [PubMed] [Google Scholar]
- Blair C, Diamond A. Biological processes in prevention and intervention: The promotion of self-regulation as a means of preventing school failure. Development and Psychopathology. 2008;20:899–911. doi: 10.1017/S0954579408000436. [DOI] [PMC free article] [PubMed] [Google Scholar]
- Blair C, Peters R. Physiological and neurocognitive correlates of adaptive behavior in preschool among children in Head Start. Developmental Neuropsychology. 2003;24:479–497. doi: 10.1207/S15326942DN2401_04. [DOI] [PubMed] [Google Scholar]
- Blair C, Razza R. Relating effortful control, executive function, and false belief understanding to emerging math and literacy ability in kindergarten. Child Development. 2007;78:647–663. doi: 10.1111/j.1467-8624.2007.01019.x. [DOI] [PubMed] [Google Scholar]
- Bodrova E, Leong DJ. Tools of the Mind: The Vygotskian approach to early childhood education. 2. Columbus, OH: Merrill/Prentice Hall; 2007. [Google Scholar]
- Bokura H, Yamaguchi S, Kobayashi S. Electrophysiological correlates for response inhibition in a Go/NoGo task. Clinical Neurophysiology. 2001;112:2224–2232. doi: 10.1016/s1388-2457(01)00691-5. [DOI] [PubMed] [Google Scholar]
- Brosnan M, Hamill S, Robson K, Sheperd H, Cody G. Executive functioning in adults and children with developmental dyslexia. Neuropsychologia. 2002;40:2144–2155. doi: 10.1016/s0028-3932(02)00046-5. [DOI] [PubMed] [Google Scholar]
- Chapman RM, McCrary JW. EP component identification and measurement by principal component analysis. Brain and Cognition. 1995;27:288–310. doi: 10.1006/brcg.1995.1024. [DOI] [PubMed] [Google Scholar]
- Curran T. The electrophysiology of incidental and intentional retrieval: ERP old/new effect in lexical decision and recognition memory. Neuropsychologia. 1999;37:771–785. doi: 10.1016/s0028-3932(98)00133-x. [DOI] [PubMed] [Google Scholar]
- Davidson M, Cruess L, Diamond A, O’Craven KM, Savoy RL. Comparison of executive functions in children and adults using directional Stroop tasks. Presented at Biennial Meeting of the Society for Research in Child Development; Albuquerque, NM. 1999. Apr, [Google Scholar]
- Diamond A. Normal development of prefrontal cortex from birth to young adulthood: Cognitive functions, anatomy and biochemistry. In: Strauss D, Knight R, editors. Principles of frontal lobe function. New York: Oxford University Press; 2002. pp. 466–503. [Google Scholar]
- Diamond A, Barnett WS, Thomas J, Munro S. Preschool program improves cognitive control. Science. 2007;30:1387–1388. doi: 10.1126/science.1151148. [DOI] [PMC free article] [PubMed] [Google Scholar]
- Diamond A, Prevor M, Callender G, Druin DP. Prefrontal cortex cognitive deficits in children treated early and continuously for PKU. Monographs of the Society for Research in Child Development. 1997;62(Serial No. 252):251–207. [PubMed] [Google Scholar]
- Diamond A, Taylor C. Development of a aspect of executive control: Development of the abilities to remember what I said and to “do as I say, not as I do”. Developmental Psychobiology. 1996;29:315–334. doi: 10.1002/(SICI)1098-2302(199605)29:4<315::AID-DEV2>3.0.CO;2-T. [DOI] [PubMed] [Google Scholar]
- Dowsett S, Livesey D. The development of inhibitory control in preschool children: Effects of “executive skills” training. Developmental Psychobiology. 2000;36:161–174. doi: 10.1002/(sici)1098-2302(200003)36:2<161::aid-dev7>3.0.co;2-0. [DOI] [PubMed] [Google Scholar]
- Dunn LM, Dunn LM. Peabody Picture Vocabulary Test. 3. Circle Pines: American Guidance Series; 1997. [Google Scholar]
- Entwisle DR, Alexander KL, Olson LS. First grade and educational attainment by age 22: A new story. American Journal of Sociology. 2005;110:1458–1502. [Google Scholar]
- Fan J, Flombaum J, McCandliss B, Thomas K, Posner M. Cognitive and brain consequences of conflict. Neuroimage. 2003;18:42–57. doi: 10.1006/nimg.2002.1319. [DOI] [PubMed] [Google Scholar]
- Fan J, McCandliss BD, Fossella J, Flombaum JI, Posner MI. The activation of attentional networks. Neuroimage. 2005;26:471–479. doi: 10.1016/j.neuroimage.2005.02.004. [DOI] [PubMed] [Google Scholar]
- Fletcher J. Executive functions in children: Introduction to the special series. Developmental Neuropsychology. 1996;12:1–3. [Google Scholar]
- Gadow KD, Sprafkin J. Child Symptom Inventories Manual. Stony Brook, NY: Checkmate Plus; 1994. [Google Scholar]
- Gathercole S, Alloway T, Kirkwood H, Elliott J, Holmes J, Hilton K. Attentional and executive function behaviors in children with poor working memory. Learning and Individual Differences. 2008;18:214–223. [Google Scholar]
- Gioia GA, Isquith PK, Guy SC, Kenworthy L. Behavior Rating Inventory of Executive Function: Professional manual. Lutz, FL: Psychological Assessment; 2000. [Google Scholar]
- Hammer LD, Kraemer HC, Wilson DM, Ritter PL, Dornbusch SM. Standardized percentile curves of body-mass index for children and adolescents. American Journal of Diseases of Children. 1991;145:259–263. doi: 10.1001/archpedi.1991.02160030027015. [DOI] [PubMed] [Google Scholar]
- Hongwanishkul D, Happaney KR, Lee WS, Zelazo PD. Assessment of hot and cool executive function in young children: Age-related changes and individual differences. Developmental Neuropsychology. 2005;28:617–644. doi: 10.1207/s15326942dn2802_4. [DOI] [PubMed] [Google Scholar]
- Hughes C. Control of action and thought: Normal development and dysfunction in autism. Journal of Child Psychology and Psychiatry. 1996;37:229–236. doi: 10.1111/j.1469-7610.1996.tb01396.x. [DOI] [PubMed] [Google Scholar]
- Huttenlocher PR, Dabholkar AS. Regional differences in synaptogenesis in human cerebral cortex. Journal of Comparative Neurology. 1997;387:167–78. doi: 10.1002/(sici)1096-9861(19971020)387:2<167::aid-cne1>3.0.co;2-z. [DOI] [PubMed] [Google Scholar]
- Jeffries S, Everatt J. Working memory: Its role in dyslexia and other specific learning difficulties. Dyslexia. 2004;10:196–214. doi: 10.1002/dys.278. [DOI] [PubMed] [Google Scholar]
- Kendall PC. Cognitive-behavioral therapies with youth: Guiding theory, current status, and emerging developments. Journal of Consulting and Clinical Psychology. 1993;61:235–247. doi: 10.1037//0022-006x.61.2.235. [DOI] [PubMed] [Google Scholar]
- Klingberg T, Forssberg H, Westerberg H. Increased brain activity in frontal and parietal cortex underlies the development of visuospatial working memory capacity during childhood. Journal of Cognitive Neuroscience. 2002;14:1–10. doi: 10.1162/089892902317205276. [DOI] [PubMed] [Google Scholar]
- Kochanska G, Murray K, Jacques T, Koenig A, Vandegeest K. Inhibitory control in young children and its role in emerging internalization. Child Development. 1996;67:490–507. [PubMed] [Google Scholar]
- Korkman M, Kirk U, Kemp S. NEPSY: A developmental neuropsychological assessment. San Antonio, TX: Psychological Corporation; 1998. [Google Scholar]
- Ladd GW, Birch SH, Buhs ES. Children’s social and scholastic lives in kindergarten: Related spheres of influence? Child Development. 1999;70:1373–1400. doi: 10.1111/1467-8624.00101. [DOI] [PubMed] [Google Scholar]
- Lehto J, Puujarvi P, Kooistra L, Pulkkinen L. Dimensions of executive funcitoning: Evidence from children. British Journal of Developmental Psychology. 2003;21:59–80. [Google Scholar]
- Lesaux NK, Rupp AA, Siegel LS. Growth in reading skills of children from diverse linguistic backgrounds: Findings from a 5-year longitudinal study. Journal of Educational Psychology. 2007;99:821–834. [Google Scholar]
- Luria A. Higher cortical functions in man. New York: Basic Books; 1966. [Google Scholar]
- Mayes LC, Molfese DL, Key APF, Hunter NC. Event-related potentials in cocaine-exposed children during a Stroop task. Neurotoxicology and Teratology. 2005;27:797–813. doi: 10.1016/j.ntt.2005.05.011. [DOI] [PubMed] [Google Scholar]
- Molfese DL, Molfese VJ, Kelly S. The use of brain electrophysiology techniques to study language: A basic guide for the beginning consumer of electrophysiology information. Learning Disabilities Quarterly. 2001;24:177–188. [Google Scholar]
- Molfese DL, Molfese VJ, Pratt NL. The use of event-related evoked potentials to predict developmental outcomes. In: de Haan M, editor. Infant EEG and Event-Related Potentials. Psychology Press; Hove, UK: 2007. [Google Scholar]
- Molfese VJ, Yaple K, Helwig S, Harris L, Connell S. Stanford-Binet Intelligence Scale (4th edition): Factor structure and verbal subscale scores for three year olds. Journal of Psychoeducational Assessment. 1992;10:47–58. [Google Scholar]
- Morgan G, Livesey D, Job R. The effect of response mode and memory on inhibition in young children. 1993 Retrieved January, 2009 from http://www.aare.edu.au/93pap/morgg93156.txt.
- Nelson JR, Benner GJ, Lane K, Smith BW. Academic achievement of K-12 students with emotional and behavioral disorders. Exceptional Children. 2004;71(1):59–73. [Google Scholar]
- Passolunghi MC, Vercelloni B, Schadee H. The precursors of mathematics learning: Working memory, phonological ability and numerical competence. Cognitive Development. 2007;22:165–184. [Google Scholar]
- Posner MI, Raichle M. Images of Mind. New York: W. H. Freeman; 1994. [Google Scholar]
- Picton TW, Bentin S, Berg P, Donchin E, Hillyard SA, Johnson JR, Miller GA, Ritter W, Ruchkin DS, Rugg MD, Taylor MJ. Guidelines for using human event-related potentials to study cognition: Recording standards and publication criteria. Psychophysiology. 2000;37:127–152. [PubMed] [Google Scholar]
- Plaza M, Cohen H, Chevrie-Muller C. Oral language deficits in dyslexic children: Weaknesses in working memory and verbal planning. Paper presented at Tennet XII; Montréal, Quebec, CA. 2002. [DOI] [PubMed] [Google Scholar]
- Rothbart M, Sheese B, Posner M. Executive attention and effortful control: Linking temperament, brain networks and genes. Child Development Perspectives. 2007;1:2–7. [Google Scholar]
- Rockstroh B, Elbert T, Birbaumer N, Lutzenberger W. Slow brain potentials and behavior. Baltimore: Urban-Schwarzenberg; 1982. [Google Scholar]
- Rudasill KM, Konold TR. Contributions of children’s temperament to teachers’ judgments of social competence from kindergarten through second grade. Early Education and Development. 2008;19:643–666. [Google Scholar]
- Rueda MR, Posner MI, Rothbart MK. The development of executive attention: contributions to the emergence of self regulation. Developmental Neuropsychology. 2005;28:573–594. doi: 10.1207/s15326942dn2802_2. [DOI] [PubMed] [Google Scholar]
- Sprafkin J, Gadow KD, Salisbury H, Schneider J, Loney J. Further evidence of reliability and validity of the Child Symptom Inventory-4: Parent Checklist in clinically referred boys. Journal of Child and Adolescent Psychology. 2002;31:513–524. doi: 10.1207/S15374424JCCP3104_10. [DOI] [PubMed] [Google Scholar]
- Stroop JR. Studies of interference in serial verbal reactions. Journal of Experimental Psychology. 1935;12:643–662. [Google Scholar]
- Swanson HL, Jerman O, Zheng X. Growth in working memory and mathematical problem solving in children at risk and not at risk for serious math difficulties. Journal of Educational Psychology. 2008;100:343–379. [Google Scholar]
- Tamm L, McCandliss B, Liang A, Wigal T, Posner M, Swanson J. Can attention itself be trained? Attention training for children at risk for ADHD. In: McBurnett K, Pfiffner LJ, editors. Attention Deficit Hyperactivity Disorder: Concepts, Controversies and New Directions. New York: CRC Press; 2007. [Google Scholar]
- Van Acker R, Grant S, Henry D. Teacher and student behavior as a function of risk for aggression. Education and Treatment of Children. 1996;19:316–334. [Google Scholar]
- Veldman DJ, Worsham M. Types of student classroom behavior. Journal of Educational Research. 1983;76:204–209. [Google Scholar]
- Wehby JH, Symons FJ, Canale J, Go FJ. Teaching practices in classrooms for students with emotional and behavioral disorders: Discrepancies between recommendations and observations. Behavioral Disorders. 1998;24:51–56. [Google Scholar]
- Whitehurst G, Lonigan C. Get Ready To Read! Columbus, OH: Pearson Early Learning; 2001. www.teachervision.com/lesson-plans/loesson-7836.html. [Google Scholar]
- Wiebe S, Andrews Espy K, Charak D. Using confirmatory factor analysis to understand executive control in preschool children: Latent structure. Developmental Psychology. 2007;44:575–87. doi: 10.1037/0012-1649.44.2.575. [DOI] [PubMed] [Google Scholar]